Looks like no one added any tags here yet for you.
National income
The income earned by the factors of production of an economy, is equal to wages plus interest, plus rents, plus profits.
most common way to measure national income is through GDP
it is important for determining the country’s rate of economic growth and changes to the standard of living in the economy.
GDP includes what?
all the value of the output of foreign owned businesses operating within a country, such as the sales revenue from McDonalds restaurants operating outside of the USA.
Three different methods to calculate national income
The output method
The income method
The expenditure method
The output method/ national output (O)
measures economic activity by calculating the actual value of all final (finished) goods and services produced within the economy each year. This method of measuring the level of economic activity is also referred to as the national output (O)
The income method/ national income (Y)
measures economic activity by calculating the value of all factor incomes earned in the economy, that is, the sum of wages, rent, interest and profits. This is also referred to as the national income (Y)
The expenditure method
measures economic activity by calculating the value of total spending on newly produced goods and services during the year, comprising consumption (C), investment (I), government (G) and net exports (X - M)
Gross Domestic Product (GDP)
the value of all final output of goods and services within a country in a year
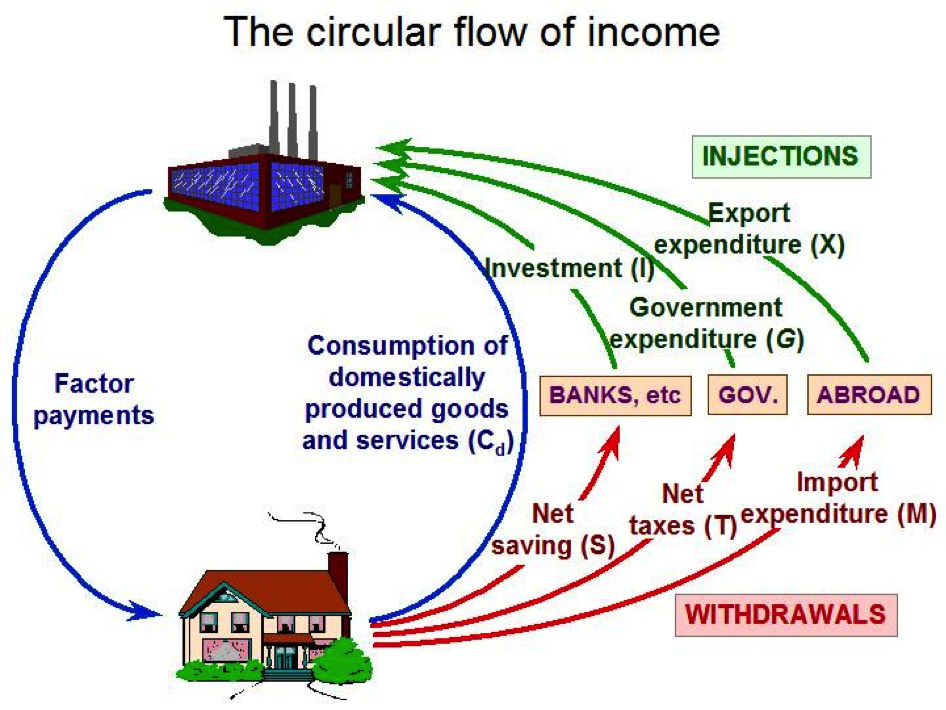
The circular flow of income
a macroeconomic tool used to explain how activity and national income are determined. It is generally represented in a diagram in which households provide firms with the factors of production and receive the factor payments. Firms provide products and services with these factors of production and consumers use these factor payments to buy these products and services.
Leakages (W)
Leakages remove money from the circular flow of income
Consist of three factors:
Savings (S)
Taxation (T)
Imports (M)
Injections (J)
put money into the circular flow of the income.
Consist of three factors:
Government spending (G)
Export earnings (X)
Investment expenditure (I)
Injections and Leakages and Economic activity
The economic activity depends on the relative size of injections (J) and withdrawals (W)
if W > J then economic activity decreases
if J > W then economic activity increases
National income equilibrium exists when W = J, that is, S + T + M = I + G + X
Nominal GDP
measures national output using current market prices, that is, the value of GDP at the time of the measurement. It measures the monetary value (or face value) of all goods and services produced within a country for a given period, usually a year.
it does not make any adjustment for the effects of inflation in the calculation of prices of goods and services
Using the expenditure method to calculate nominal GDP, you would add the totals of consumption expenditure (C), investment expenditure (I), government expenditure (G), and net export expenditure (X - M)
Nominal GDP= C + I + G + (X - M)
Current prices
the actual prices of goods and services at the time of collecting the data, which are used to report nominal GDP and nominal GNI (gross national income)
Gross National Income (GNI)
the value of a country’s final output of all goods and services plus net property income earned from abroad, which also subtracts all the foreign businesses in the country.
Nominal GNI
Nominal GDP + Net factor income from abroad
Real GDP & GNI
takes account of fluctuations in prices that affect the national output. Instead, the values are adjusted for inflation by using a GDP/GNI deflator
Real GDP = (Nominal GDP / GDP Deflator)
Constant prices
the values of real GDP and real GNI as they have been adjusted for inflation over time
Price deflator
a measure of the general level of inflation in the economy, showing the extent to which prices have changed over time. It is used to calculate real GDP
Real GDP per capita & Real GNI per capita
expressing the real GDP of a country in terms of its population size to determine the value of national income per person
Real GDP per capita= Real GDP / Population Size
Real GNI per capita= Real GNI / Population Size
Purchasing power parity (PPP)
the exchange rate that enables residents to purchase a common basket of good sand services in different countries
urchasing Power Parity (PPP) suggests that if a hamburger costs $5 in the United States and €4 in Germany, PPP would imply an exchange rate where $1 equals €0.80 to reflect the equivalent purchasing power.
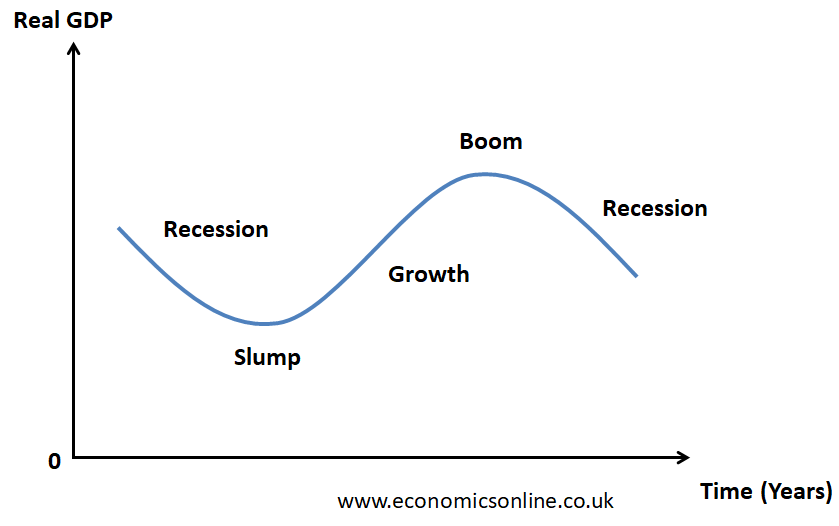
The business cycle
a model that describes the fluctuations in the level of economic activity of a country over time, thus creating a long-term trend in economic growth in the economy
shows booms, slumps, recessions and recoveries
shows the long-term growth trend by establishing the trend from actual data of economic activity
A boom
a phase in the business cycle when the level of economic activity rises, caused by an increase in aggregate demand
A peak
occurs when economic activity is at it’s highest level
A slump
occurs at the bottom of a recession in the buisness cycle when aggregate demand remains low
A recession
a phase in the business cycle that occurs when there is a fall in GDP for two consecutive quarters.
A recovery
occurs when the GDP starts to rise after the trough in the business cycle, eventually leading to economic growth
Economic growth occurs when..
An economy’s real GDP increases for two consecutive quarters
leads to less unemployment
causes inflation to rise
makes the average individual more prosperous
Potential output
the highest level of real GDP of an economy, as shown on its production possibility curve (PPC), if all resources are used efficiently. It is a long run phenomenon represented by an outwards shift on the PPC.
Y
Income
X
Export Expenditure
M
Import Expenditure
T
Taxes
I
Investments
G
Government Expenditure
S
Savings
Long-term growth trend
Refers to average growth over long periods of time shown in the business cycle diagram as the line that runs through short-term fluctuations, indicating changes in potential output
Growth in production possibilities
When the production possibilities of a country increase because of more/better resources and/or better technology becoming available; illustrated by a shift outwards of the PPC.
Short-term fluctuations of economic activity
Periods of growth of real GDP followed by periods of contraction, which are part of the business cycle.
Recession
Occurs when real GDP falls for at least two consecutive quarters.
Automatic stabilisers
Institutionally built-in features (like unemployment benefits and progressive income taxation) that tend to decrease the short-term fluctuations of the business cycle without the need for governments to intervene.
Long term in microeconomics vs Long run in macroeconomics
Long run in macroeconomics: The period when the prices of all factors of production, especially wages, change to match changes in the price level.
Short run in macroeconomics: The period when the prices of factors of production, especially wages, are considered fixed.
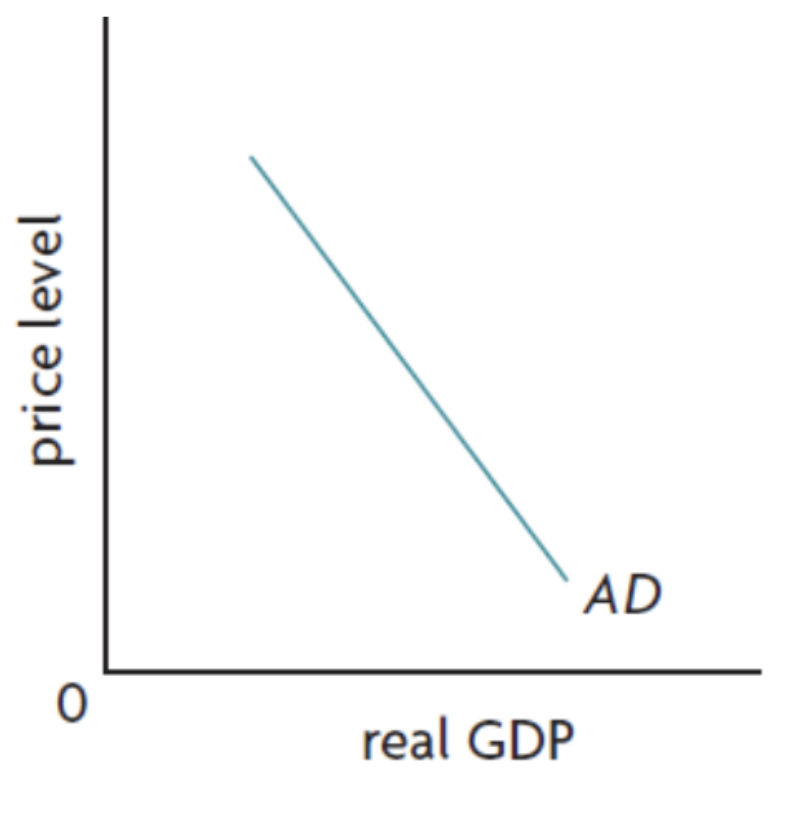
Aggregate Demand
Aggregate demand is the total amount of real GDP that consumers (C), firms (I), the government (G) and foreigners (X-M) want to buy at each possible price level, over a particular period of time
C + I + G + (X - M)
C= Consumption
I= Investments
G= Government Spending
X= Exports
M= Imports
Alternative measures of well-being
The OECD Better Life Index (BLI)
The Happiness Index
Happy Planet Index
The OECD Better Life Index (BLI)
alternative to national income as a measure of well-being, based on a set of 11 criteria identified by the OECD to be essential in terms of material living conditions & quality of life
narrow in it’s coverage, as it only covers 35 members which most are the worlds most economically developed countries. It limits the use of BLI when trying to make international comparisons of well-being
Better life index: 11 measures of well-being
Housing
Income
Jobs
Community
Education
Environment
Governance
Health
Life satisfaction
Safety
Work-life Balance
not ranked in any particular way
The Happiness Index
alternative to national income as a measure of well-being, by considering how information technology, governance and social norms influence communities and their level of well-being
has 14 indicators of well being
greater happiness leads to greater productivity, performance and profits, as well as peace, progress and purpose in life
Strengths | Weaknesses |
|---|---|
index is updated to reflect changes in what contributes to well-being | it can be difficult to make historical comparisons of well-being by using this measure |
The Happy Planet Index
a measure of sustainable human well-being, that is, how individuals and countries are able to achieve long, happy and sustainable lives
The HPI is calculated by combining four elements to show how efficiently individuals and countries use their environmental resources to achieve long, happy lives:
Well-being
Life expectancy
Inequality of outcomes (how long they live & how happy people feel in a country, turned into a percentage)
Ecological Footprint
HPI is calculated by:
(Well-being x Life expectancy x Inequality) / Ecological Footprint
It’s shown that high-income countries underperform in HPI rankings, while developing countries score higher. Yet, it doesn’t show other welfare crises, like abuse & violation of human rights.
Factor payments
what the firm pays for the use of the factors of production. From the firm’s perspective, factor payments are costs. From the owner of each factor’s perspective, factor payments are income. Factor payments include:
Raw materials prices for raw materials
Rent for land or buildings
Wages and salaries for labor
Interest and dividends for the use of financial capital (loans and equity investments)
Profit for entrepreneurship. Profit is the residual, what’s left over from revenues after the firm pays all the other costs. While it may seem odd to treat profit as a “cost”, it is what entrepreneurs earn for taking the risk of starting a business
Aggregate Demand Diagram
Downwards sloping curve due to:
Wealth effect
Interest rate effect
Net balance effect (exchange rate effect)
shows the relationship between the total amount of real output demanded by the four components and the economy’s price level over a particular time period:
consumption
investments
government spending
net exports
Aggregate demand: Consumption definition
the total spending on goods/services by households in an economy, at a given price level over a particular time period.
Contributes to 60% of aggregate demand
Aggregate demand: Investment definition
the expenditure of all firms in the economy in ordder to increase their capital stock and production capacity, at a given price level over a particular time period.
Contributes to 14% of aggregate demand
Aggregate demand: Government spending definition
the total spending by the public sector in the economy, at a given price level over a particular time period.
Contributes to 25% of aggregate demand
Aggregate demand: Net exports definition
difference between the revenue gained from selling goods/services abroad and the expenditure on goods/services from abroad, at a given price level over a particular time period.
Contributes to 1% of aggregate demand
Whats the difference between Aggregate Demand (AD) and Gross Domestic Product (GDP)?
GDP refers to the value of the actual expenditure in the economy over a year, whereas AD refers to the planned (or expected) expenditure in a year.
Aggregate demand diagram: shift vs movement
A change in the average price level will result in a movement along the AD curve, from one level of real output to another.
A change in any of the components of aggregate demand will cause a shift in the aggregate demand curve either left or right.
Determinants of AD components: Consumption
Consumer confidence: measure of consumer optimism about their future income and the economy
Interest rates: the cost of money. If rates rise, people spend less and vice versa. (Govt Monetary policy)
Wealth: An increase in assets makes people feel wealthier and so they will spend more
Personal Income tax: higher tax means people have less money to spend and vice versa (disposable income) (Gov’t Fiscal policy)
Household debt: High levels of household debt leads to lower spending
Expectations of future price levels: If there is an expectation that prices will fall, consumers will spend less and choose to wait
Determinants of AD components: Investments
Business confidence: measure of business optimism about their future sales (revenue & profits) and the economy
Interest rates: the cost of money. If they rise, businesses borrow and spend less and vice versa. (Govt Monetary policy)
Technology: improvements stimulate investment
Business tax: higher tax means businesses have less profits from their income so will invest less
Corporate debt: High levels of corporate debt leads to lower investment spending
Determinants of AD components: Government Spending
Political Priorities: political priorities change all the time depending on what is happening in a country and what the government wants to achieve. As a result a government might reduce or increase their spending
Economic priorities: Government spending (fiscal policy) can be used by governments to deliberately influence Aggregate Demand (and so GDP)
Determinants of AD components: Net Expenditure
National Income Abroad: If a country that imports our country’s goods has an increase in national income, they will import more goods and services from us. (and vice versa)
Exchange Rates: The price of one currency against another. If the price of a currency changes it changes both the level of imports and the level of exports as they become more or less expensive in relation to the other country. A weaker currency makes exports cheaper and imports more expensive.
Trade Protection: Any change in trade protection that restricts or opens up trade between two countries will affect Net exports.
Macroeconomics
The field of economics that studies the behaviour of the aggregate economy.
Households
Groups of individuals in the economy who share the same living accommodation, who pool their income and jointly decide the set of goods and services to consume.
Firms
Productive units that transform inputs (factors of production) into output (goods and services), usually aiming at earning profits
Foreign sector
In an open economy the term refers to exports and imports.
GDP and GNI are used because:
-they allow economic growth to be calculated - a key macro economic objective
-Economic forecasts can be made about the future which can be helpful to government policy makers and businesses
-Different countries can be compared
-They can be one part of an assessment of the standard of living in a country
-The economic performance of a country can be analysed and this analysis can be used to make future improvements
GDP and GNI do not include/take account of:
non-marketed output (eg home repairs)
output sold in underground (parallel/black) markets
negative externalities and depletion of natural resources
differing domestic price levels in different countries (so we use PPP)
output based on the amount of work put in to achieve the output (we can use hours worked measure to help with this)
distinctions in the type of output (eg military weapons or education)
achievements in education, health and life expectancy
distribution of income and output
other quality of life factors