Chapter 5: The Living World: Ecosystems
This chapter sets the foundation for all future chapters by showing the relationships and interactions with the living world.
Ecosystems are the result of biotic and abiotic interactions.
Energy can be converted from one form to another.
Key Terms
10 percent rule: 90 percent of energy is used by the organism and only 10 percent moves up the pyramid because the organism below it used up the energy to heat its body and move, etc. The shape is a pyramid because energy is “lost” as it goes up to each higher level.
Biome: Major communities of plants and animals.
Carbon cycle: How carbon cycles in the environment. It includes both photosynthesis and cellular respiration, which is how carbon is stored in the short term. Also included are dead organisms buried for millions of years, which is long-term storage of carbon.
Commensalism: One species benefits and the other is unaffected. Example: remora and shark.
Competition: Two species competing for the same resources.
Intraspecific: competition between members of the same species.
Interspecific: competition between members of different species.
Desert: Dry with little vegetation.
Ecosystem: Living and nonliving parts of an environment.
Food chains: Visual representation of how one organism is food source for another.
Food web: Visual representation that is more like real life with multiple food source options for each animal.
Freshwater biomes: Examples: rivers, lakes, streams, ponds.
Gross Productivity: The total rate of photosynthesis in an area, or the full amount of food produced by the producers.
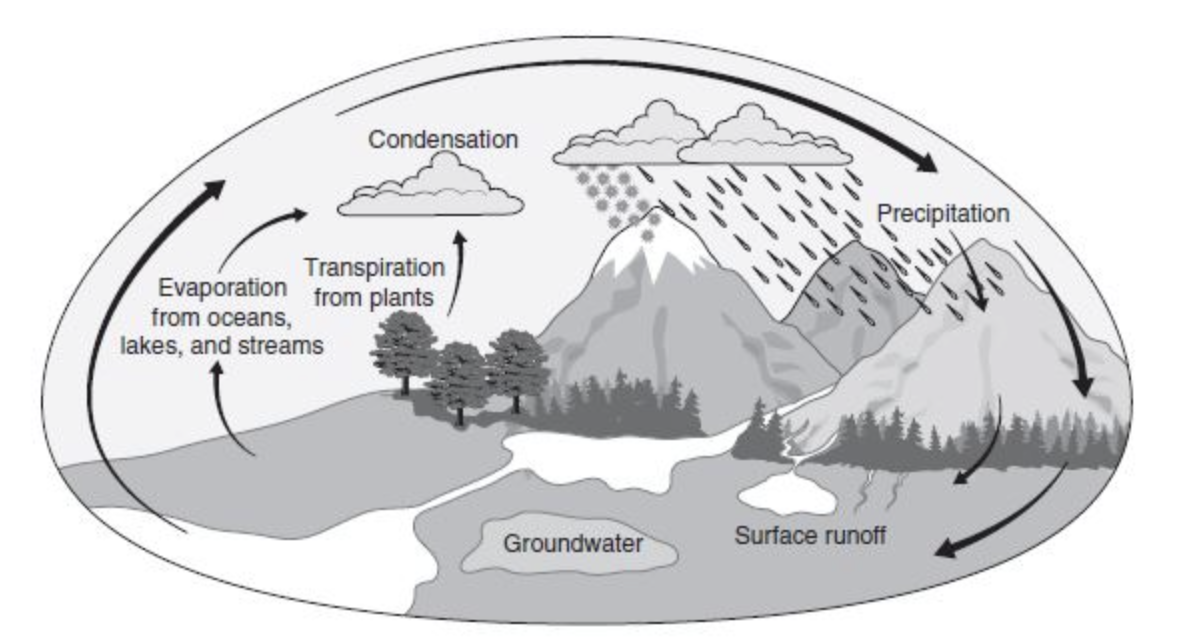
Hydrologic cycle: Otherwise known as the water cycle and includes evaporation, condensation, runoff, precipitation, and transpiration.
Mutualism: Both species benefit by being in the relationship. Example: clownfish and anemone.
Net Productivity: The difference between gross productivity and the energy lost by producers for respiration.
Nitrogen cycle: Nitrogen makes up 78 percent of our atmosphere. Bacteria are important in the nitrogen cycle.
Phosphorus cycle: Phosphorus cycles in the environment but it is a slow cycle with no atmospheric form. It is found in rocks and sediments.
Predator-prey: One eats, one gets eaten.
Primary productivity: The rate at which food energy is generated by photosynthesis. It is measured in units of energy per unit area per unit time.
Saltwater biomes: Examples: oceans, coral reefs, kelp forests, marshlands, estuaries, mangrove forests, tidepools.
Savanna: Grassland with a wet season and a dry season; wildfires are common.
Shrubland: Hot, dry summers and cool, moist winters; found near coasts with short trees and grasses.
Taiga: Lengthy cold, wet winters with lots of coniferous trees.
Temperate grassland: Lots of grasses, low rainfall.
Temperate rainforest: Coniferous and broadleaf trees with lots of rain.
Temperate seasonal forests: Four seasons with warm, wet summers and cold winters.
Trophic levels: Made up of producers, primary consumers, secondary consumers, and decomposers and shows that each level has less energy available.
Tropical rainforests: Greatest diversity of species with rain all year and warm all year.
Tundra: Extremely cold, no trees, little rain.
Introduction to Ecosystems
There are many types of relationships in environmental science.
Predator-prey relationships are when a predator, such as a lion, eats his prey, such as a gazelle.
These two organisms must exist together and each organism relies on the other.
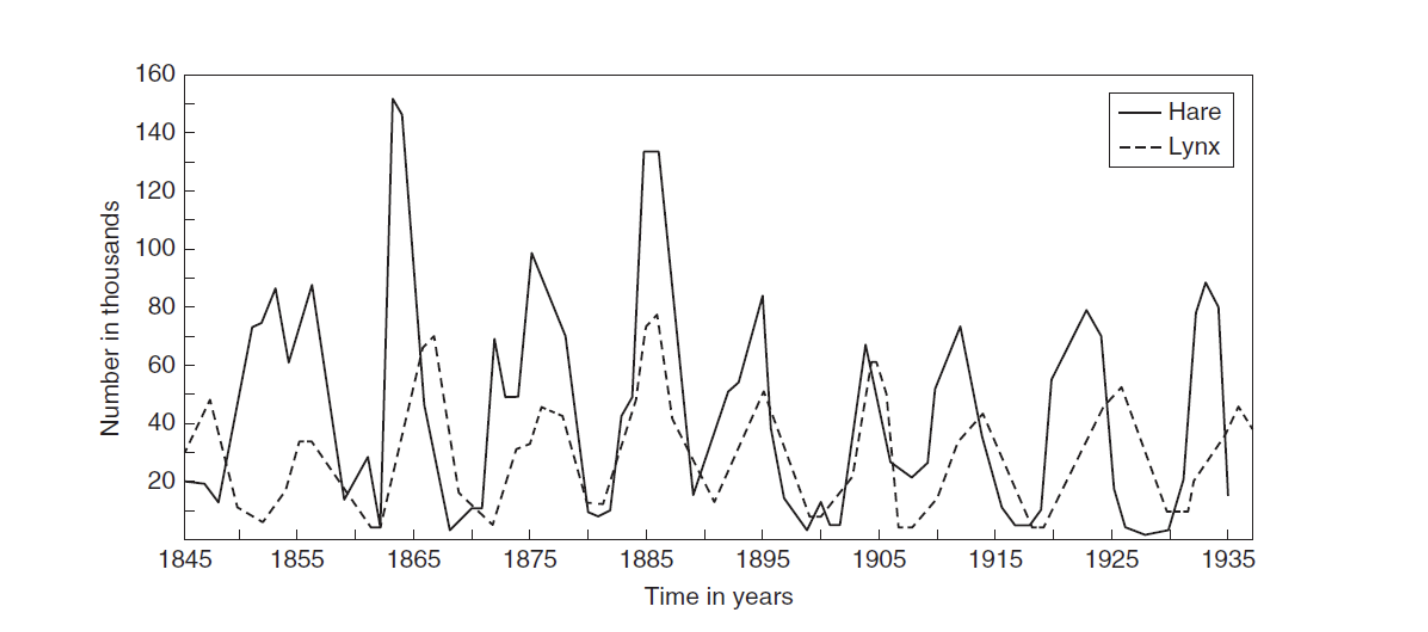
For example, Figure 5.1 shows the relationship between the lynx and the hare.
The lynx would not survive without his food source, the hare. However, the lynx keeps the hare numbers in check so they don’t reach high numbers and begin to starve for lack of food resources for the prey.
A healthy predator-prey relationship is important in the environment.
Symbiosis is the relationship between two species that have a close and long-term interaction with one another.
There are many types of symbiosis: mutualism, commensalism, and parasitism.
In mutualism both species benefit from the relationship.
For example, in the clownfish and anemone, the anemone has stinging tentacles that allow it to sting and eat its prey . . . usually small fish like the clownfish.
However, the clownfish has a slimy mucus that protects her from the anemone.
The clownfish benefits by eating the algae and left over fish from the anemone and the anemone benefits by getting more oxygen to its tentacles as the clownfish swims through it.
Commensalism is another relationship between species when one organism benefits and the other neither benefits nor is harmed.
For a remote and shark example, the remora uses the shark for both food and for transportation.
It eats food that is left over from the shark and also has a sucking disk that allows her to adhere to the body of the shark and get a free ride. The shark is not helped or harmed.
Another example is the cattle egrets and cattle. The cattle egrets eat the insects that the cattle disturb as the cattle forage. The cattle are not helped or harmed but the cattle egrets benefit.
Parasitism is the final example of symbiosis. In this relationship, one species benefits while the other is harmed.
The common examples here are fleas, mosquitoes, and tapeworms.
All of these organisms feed off a host and benefit while the host is harmed, some more than others.
Another type of relationship is competition, when two or more species (or between members of the same species) are all competing for the same, usually limited, resource.
These limited resources are often food, water, or territory.
Intraspecific competition is competition between members of the same species and interspecific competition is between members of different species.
Oftentimes species will learn to coexist by living in different parts of the same habitat, sharing food, or eating at different times of the day, which is known as resource partitioning.
Terrestrial Biomes
A biome is the world’s major communities of plants and animals and can be made up of many different ecosystems.
An ecosystem is the living and nonliving parts of an environment and many ecosystems may make up a biome.
Climate is the normal conditions of temperature, humidity, atmospheric pressure, wind, rainfall, etc. that define an area for a long period of time.
Biomes are defined by the type of climate that is found in the biome.
The main terrestrial (land) biomes and their characteristics are:
Taiga—A coniferous forest (pine trees), with permafrost soil, usually found between the tundra and temperate forests. This is the world’s largest land biome.
Temperate rainforest—Found on the coast and consists of both coniferous and broad-leaf trees. This biome is characterized by a lot of rain.
Temperate seasonal forests—These forests have all four seasons and are characterized by trees that are green in the spring and summer and turn bright colors of yellow, orange, and red in the fall, losing their leaves in the winter. This biome has warm, wet summers and cold winters.
Tropical rainforests—These forests are found near the equator and stay warm all year-long. They are characterized by extreme amounts of rainfall all year. More than half of the world’s species live in this biome.
Shrubland—This biome is typically found near coasts and have hot, dry summers and cool, moist winters. Shrubland consists of shrubs and short trees with grasses. Some plants are adapted to little rainfall, such as cacti.
Temperate grassland—This biome has many different types of grasses and very few trees due to the low levels of rainfall. The climate varies during the seasons from very cold to very warm.
Savanna—This biome is a grassland with widely scattered trees found in tropical regions usually between the desert and rainforest. Wildfires are common and there is a wet and dry season.
Desert—This biome covers about 20% of the land on our planet and is characterized by less than 50 cm a year of rain. Trees are usually absent and there is little vegetation.
Tundra—This is an extremely cold climate characterized by no trees, little precipitation, short growing seasons for plants and grasses, and poor nutrients.
Aquatic Biomes
Aquatic biomes can be broken down into freshwater and marine.
The types of resources found in these biomes depend on many things, including location, temperature, sunlight, and salinity.
Freshwater biomes—These include streams, rivers, lakes, and ponds. These provide humans with water and food and could be considered the most important of all the biomes.
Marine biomes—These include oceans, coral reefs, kelp forests, marshland (salt marshes), estuaries, mangrove forests, and tidepools. Marine biomes cover about 75% of Earth’s surface and are important in climate control, providing much of the world’s oxygen and also acting as a huge carbon dioxide sink.
Carbon Cycle
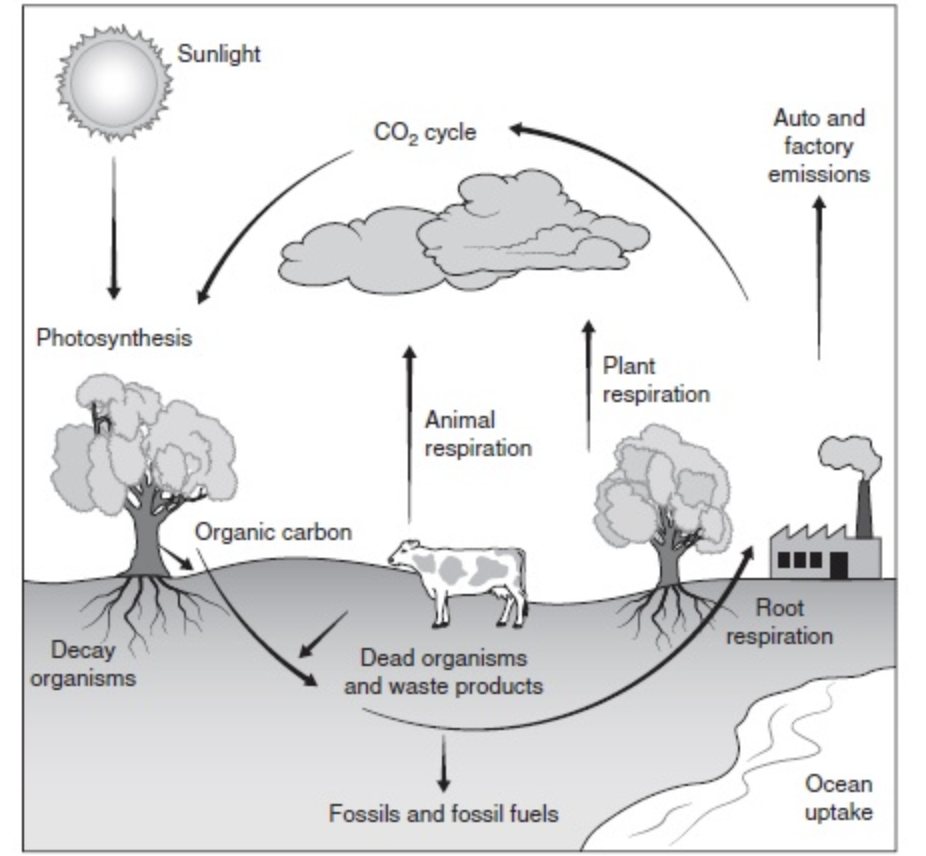
As seen in Figure 5.2, carbon is found in the land, water, and atmosphere.
A carbon sink is where carbon is stored, for example in plants, the ocean, and soil.
Carbon sources include forest fires, respiration, and burning of fossil fuels.
As carbon moves through the carbon cycle it moves between sources and sinks, which can take very long periods of time or be rather quick.
Photosynthesis and cellular respiration are how carbon cycles in living things and is known as short-term cycling.
When living organisms die and get buried deep underground, we see the long-term cycling and storage of carbon.
This long-term storage has been interrupted by humans with the burning of fossil fuels.
This takes carbon that has been stored for millions of years and puts it back into the atmosphere.
Nitrogen Cycle
Like carbon, nitrogen cycles between sources and sinks (Figure 5.3).
Seventy-eight percent of our atmosphere is composed of nitrogen, which makes it the primary sink, but other sinks include living organisms, sedimentary rocks, and sediments.
Denitrifying microorganisms are fixers of nitrogen, making them a major source of nitrogen because they push nitrogen back into the atmosphere.
This form of nitrogen is unusable by plants.
Another type of microorganism, known as nitrifying microorganisms, fix nitrogen into a useable form for plants.

The steps of the nitrogen cycle can be easily memorized by a mnemonic device known as FixNAAD ANPAN (Table 5.1).
As you can see from the chart, the nitrogen cycle relies heavily on bacteria to cycle it between land, water, and the atmosphere. It is a relatively fast cycle.
Table 5.1
Process | Product | Explanation |
|---|---|---|
Fix—Nitrogen Fixation | A—Ammonia | During nitrogen fixation, N2 from the atmosphere is converted by nitrogen-fixing microorganisms into ammonia. |
N—Nitrification | N—Nitrites/Nitrates | During nitrification, bacteria convert ammonia into nitrites and then nitrates. |
A—Assimilation | P—Proteins (DNA/Amino Acids) | During assimilation, nitrates are then converted into plant proteins, and nucleic acids that animals can then get from the plant tissues. |
A—Ammonification | A—Ammonia | Ammonification is the process where decomposers take plant and animal cells and return the nitrogen back to the soil in the form of ammonia. |
D—Denitrification | N—Nitrogen Gas | Bacteria convert nitrogen in the soil back to an atmospheric form. |
Phosphorus Cycle
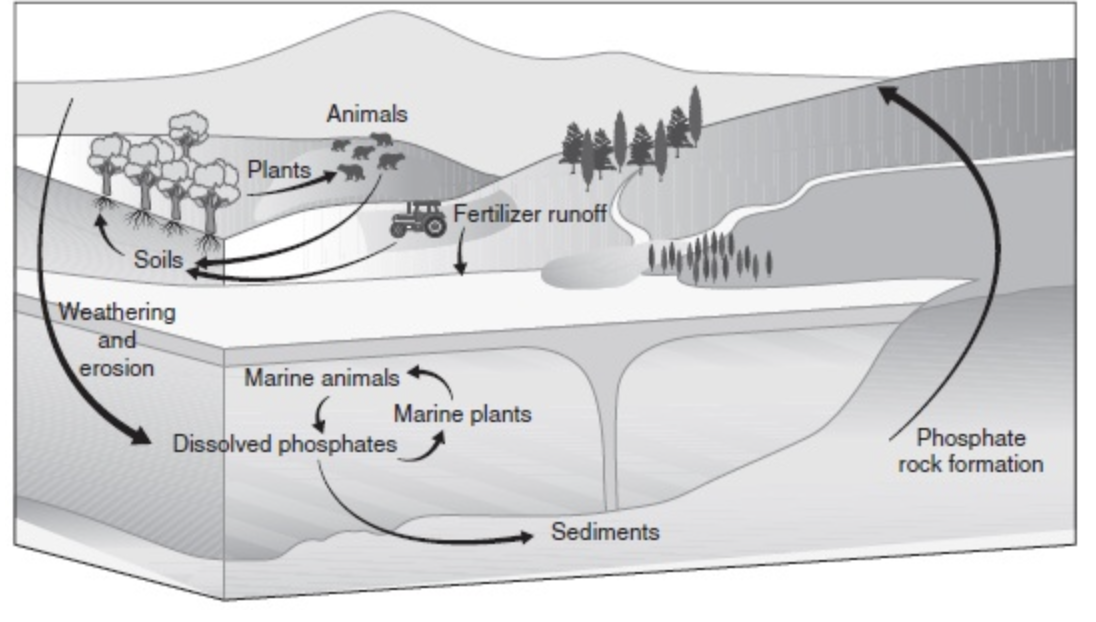
The phosphorus cycle is a slow cycle and it does not have an atmospheric form; phosphorus is only found on the land and in the water (Figure 5.4).
The major sinks for phosphorus are rocks and sediments that are weathered.
Once it is in the soil or water it can be easily taken up by plants, fungi, and microorganisms.
Animals obtain phosphorus by eating plants and it is returned to the soil or water when they die.
Phosphorus is used as a building block for DNA, RNA, and ATP.
Phosphorus is often considered a limiting factor in the environment because there is very little available and because it is not very water soluble.
Hydrologic Cycle (Water)
The water cycle is the process in which water moves from the atmosphere to the oceans/lakes/rivers to the land (Figure 5.5).
The major steps include evaporation, condensation, runoff, precipitation, transpiration, and infiltration.
Water on our planet is found in three phases: solid (ice or snow), liquid (rainfall or water in lakes), and gas (in the atmosphere).
The majority of water on our planet is found in the oceans, which cover approximately 70% of the Earth.
Primary Productivity
Primary productivity is the rate at which food energy is generated by photosynthesis.
It is measured in units of energy per unit area per unit time.
Since energy cannot be created or destroyed, and since the sun is the source of energy for our planet, we can study the two parts of primary productivity (gross productivity and net productivity) to see how productive a particular area is.
In some areas productivity changes with the seasons, like the wet and dry seasons of the tropics or the spring or fall seasons in the United States.
We also consider the primary productivity of bodies of water by looking at the photosynthesizers found there.
The primary productivity in water is dependent on how clear the water is and how deep the red and blue light can penetrate.
Primary productivity is important because it is the process that forms the foundation of food webs in most ecosystems.
Gross productivity is the total rate of photosynthesis in an area, or the full amount of food produced by the producers.
Net productivity is the difference between gross productivity and the energy lost by producers for respiration.
Trophic Levels
Once again, all energy comes from the sun but it can be converted from one form to another.
Plants take energy from the sun in the process of photosynthesis and convert that energy into usable forms (Figure 5.6).
Animals eat that plant or another animal and get their energy from the food they eat. T
he cycles we studied earlier are how matter moves around the planet.
These cycles demonstrate the law of conservation of matter.
The first trophic level are the plants, or primary producers. These are then eaten by primary consumers (the second trophic level) and so forth up the pyramid.
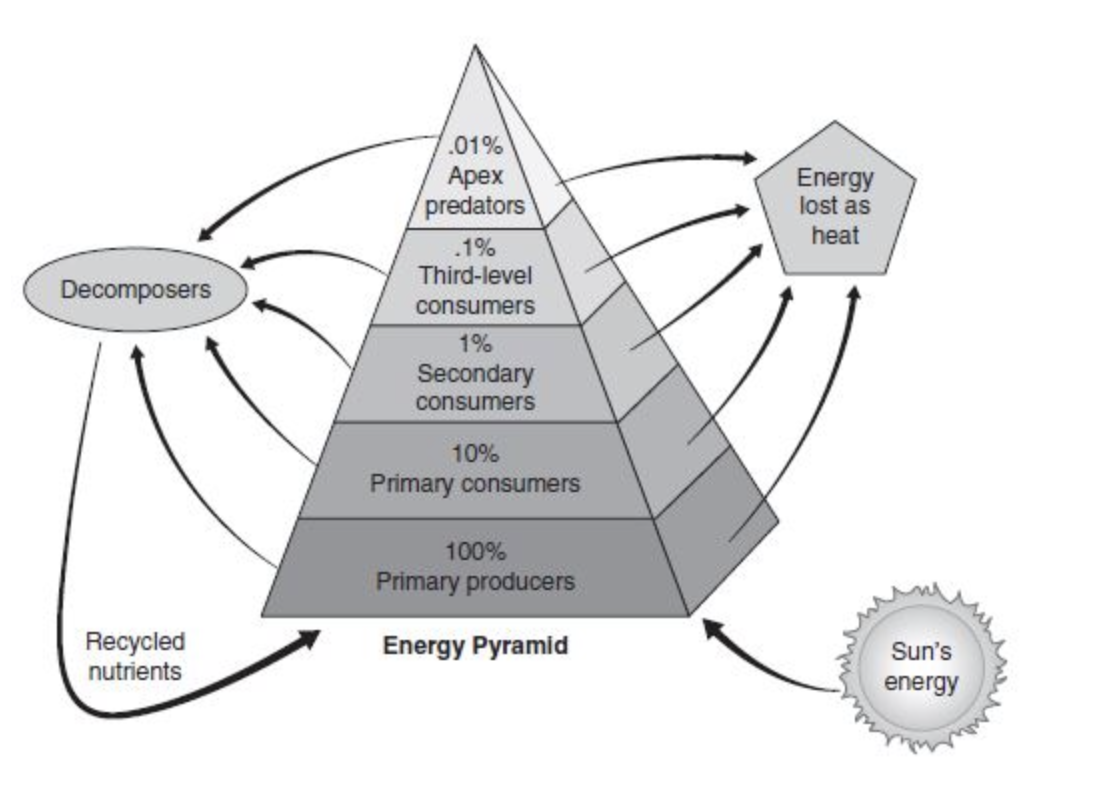
Energy Flow and the 10 Percent Rule
The 10 percent rule is the idea that as usable energy moves up the pyramid much of it is “lost.”
The first law of thermodynamics states that energy cannot be created or destroyed, but the second law states that it can be transferred or transformed.
So according to the 10 percent rule, a plant or primary producer will only transfer 10 percent of the energy to the primary consumer that eats it, for example a rabbit.
A rabbit uses up 90 percent of the energy he received from the plant in existing.
Next, when a coyote comes around and eats the rabbit, we assume the coyote only gets about 10 percent of the energy from the rabbit because the rabbit “used up” 90 percent doing what rabbits do.
This also explains why the shape is a pyramid because energy is “lost” as it goes up to each higher level.
Food Chains and Food Webs
A food chain is a visual representation of how organisms depend on one another for a source of food with arrows pointing from the organism that is being eaten to the organism that eats it and receives the energy from it (Figure 5.7).
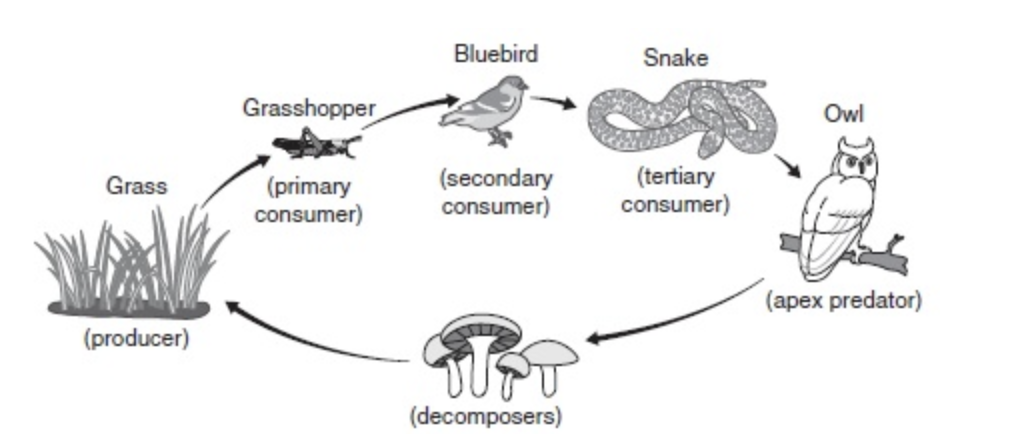
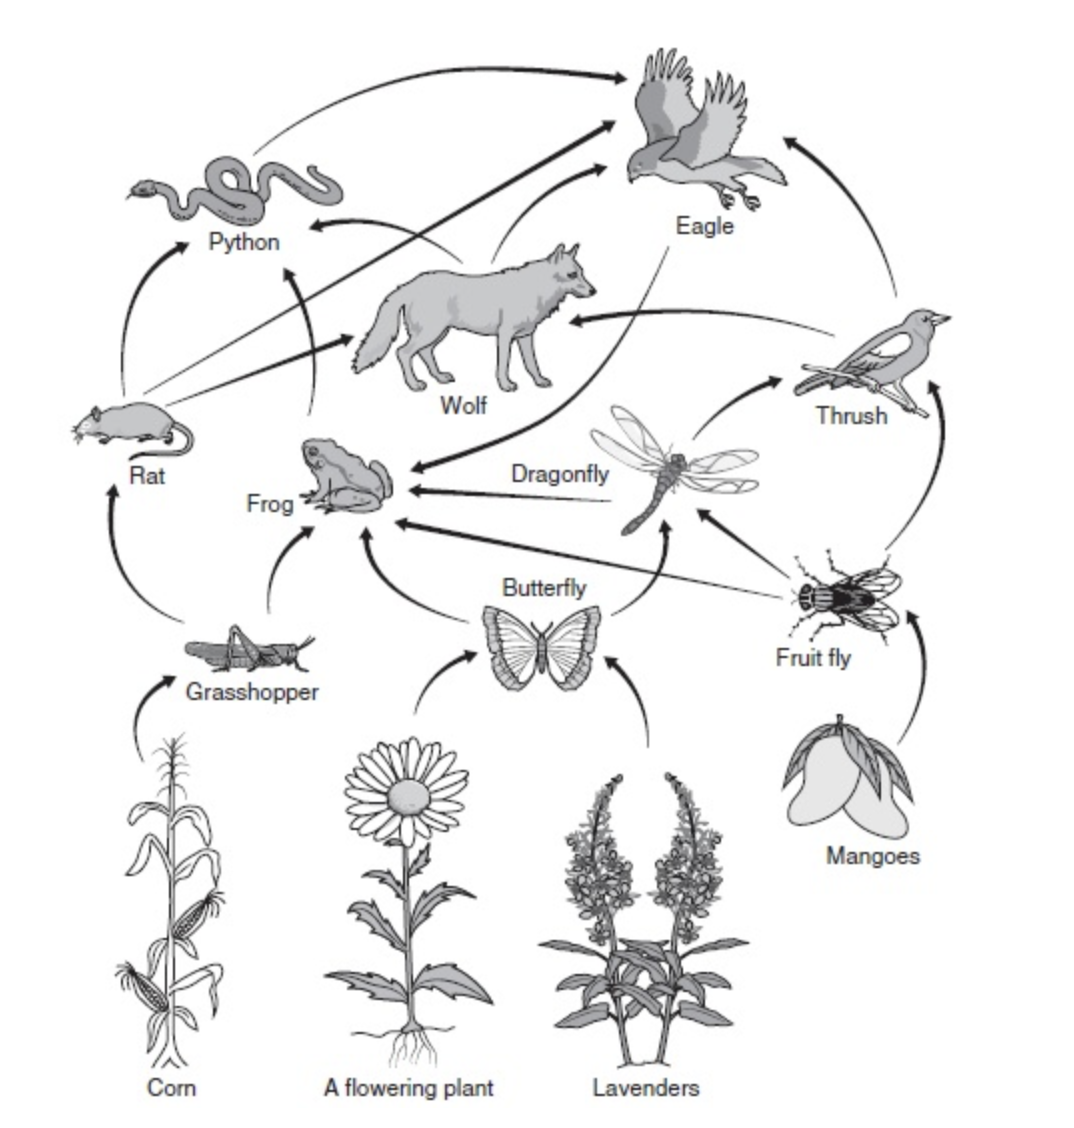
A food web is a visual representation of many food chains put together and is more like real life because it shows the complexity of feeding relationships in the system (Figure 5.8).
In other words, most animals don’t have just one thing they eat, but rather multiple options for any given meal.