


Free Response Question 6: The Investigative Task
The Investigative Task is worth 25%, of the free-response grade and ends up being 1/8th of the total test score.
Question
Example:
Taylor and Harper are twins who want to buy a used car to drive when they go to college. Together, they collect information on the age (in years), miles driven (in thousands of miles), and selling price (in thousands of dollars) of a group of 20 of the same model of a popular car currently offered for sale in their area. This information is provided in the table below:
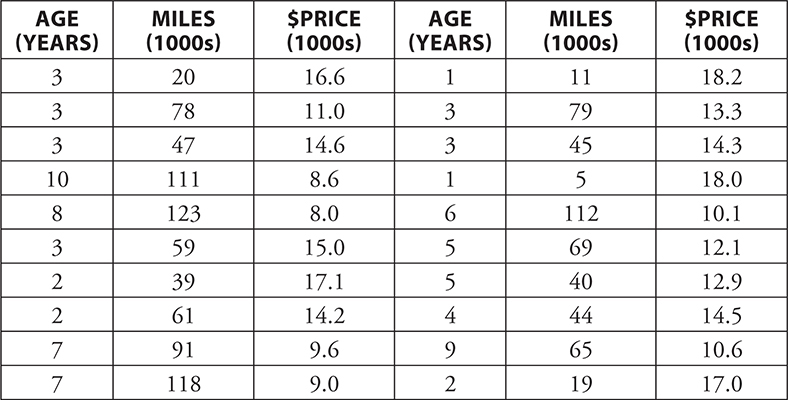
Taylor wants to use Age to predict the selling price of this car. Here are the summary statistics and appropriate plots for Taylor’s linear regression:
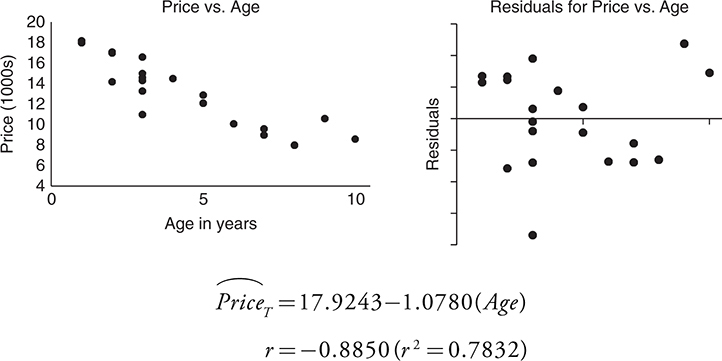
Harper wants to use Miles Driven to predict the selling price of this car. Here are the summary statistics and appropriate plots for Harper’s linear regression:
(a) Interpret the value of r 2 for Taylor’s regression results in the context of this problem. (b) Based on the information provided, which linear regression do you think does a better job predicting the price of this car? Explain your answer. Taylor believes that if they were to include BOTH Age and Miles, they could improve their ability to predict the price of this type of car. To that end, Taylor produces the equation:

(c) Use this new regression equation to predict the price of a car that is 4 years old and has 32,000 miles. Show your work.
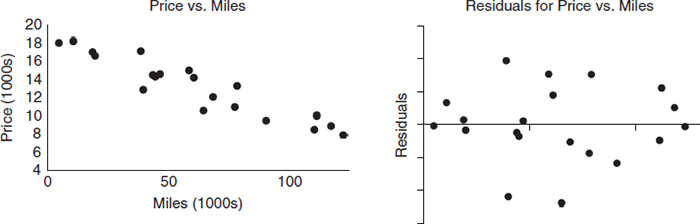
But Harper points out that to evaluate whether or not this new equation actually is more effective will require some new way to measure how well the model predicts the price of this model of car. So Harper consulted some sources and found a statistic that has the same interpretation as r^2 but can be used with more than one independent variable.
Let rT = correlation for the linear relationship between Age and Price
rH = correlation for the linear relationship between Miles and Price and
rA&M = correlation for the linear relationship between Age and Miles.
Harper finds the following formula for the coefficient of determination when you have two independent variables:
Taylor and Harper find that the relationship between Age and Miles appears to be a positive linear relationship with a correlation of 0.7687.
(d) Use this new formula as well as the information provided in the regression output at the beginning of the problem to find the value of R 2 for the twins’ sample of cars. Then interpret this value in the context of the problem.
Harper consults a large national database of all cars of this type currently offered for sale with information as to price, age, and miles driven. Harper is able to ask for 200 random samples of 20 cars each and calculate R^2 for predicting Price using both Age and Miles . The dotplot shown below represents the 200 values of R^2 that Harper collected from these samples.
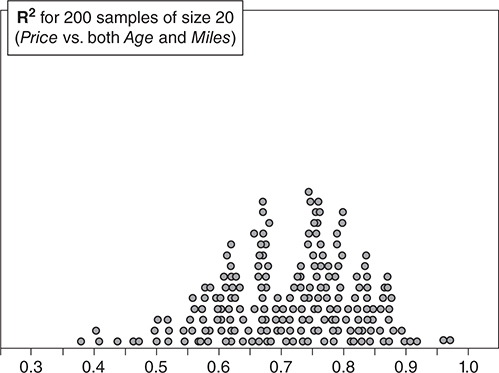
(e) Using Harper’s dotplot and the value of R^2 you obtained in part (d), comment on whether you believe the sample of 20 cars the twins used in their analysis is likely a representative sample of all cars of this model currently for sale nationwide.
Solution
Part (a):
The value of r^2 should be interpreted in context as follows: 78.32% of the variation in the price of the cars in this sample can be explained by the linear relationship with the miles driven.
Part (b): Harper’s model has a stronger correlation ( r = −0.9370 is closer to negative one than is Taylor’s r = −0.8850). And it would appear that the residual plot for Harper’s model is much more randomly scattered and with less variation in that scatter. Thus Harper’s model seems to do a better job at predicting the price of this car.
Part (c):
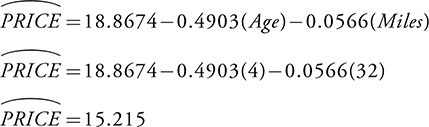
The price for a model of this car that is 4 years old and has 32,000 miles would be about $15,215.
Part (d):
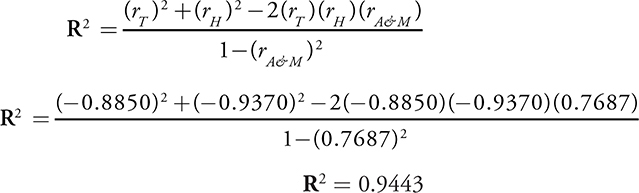
In the context of this problem, 94.43% of the variation in the price of the cars in this sample can be explained by the relationship with both age and miles driven.
Part (e):
Only 2 of the 200 samples produced values of R^2 larger than 0.9443, or only 1% of the samples. This is a very small probability and thus makes it unlikely that the sample the twins used in their analysis is a representative sample of all the cars of this model that are currently for sale nationwide.
General Tips
Relax. The first part of the question is usually familiar
The parts often tie together.
Consider doing a couple of the first five free-response questions and then starting the Investigative Task.
Get a couple of parts of the Investigative Task completed and then go back and finish the rest of the other free-response questions.
Finally, use your remaining time to work on the rest of the parts of the Investigative Task.