Chapter 9: Hypothesis Testing with One Sample
Introduction
Hypothesis: a statement (or claim) about a property/characteristic of a population.
Hypothesis testing: a procedure, based on sample evidence and probability, for testing claims about a property/characteristic of a population.
Steps to perform a hypothesis test
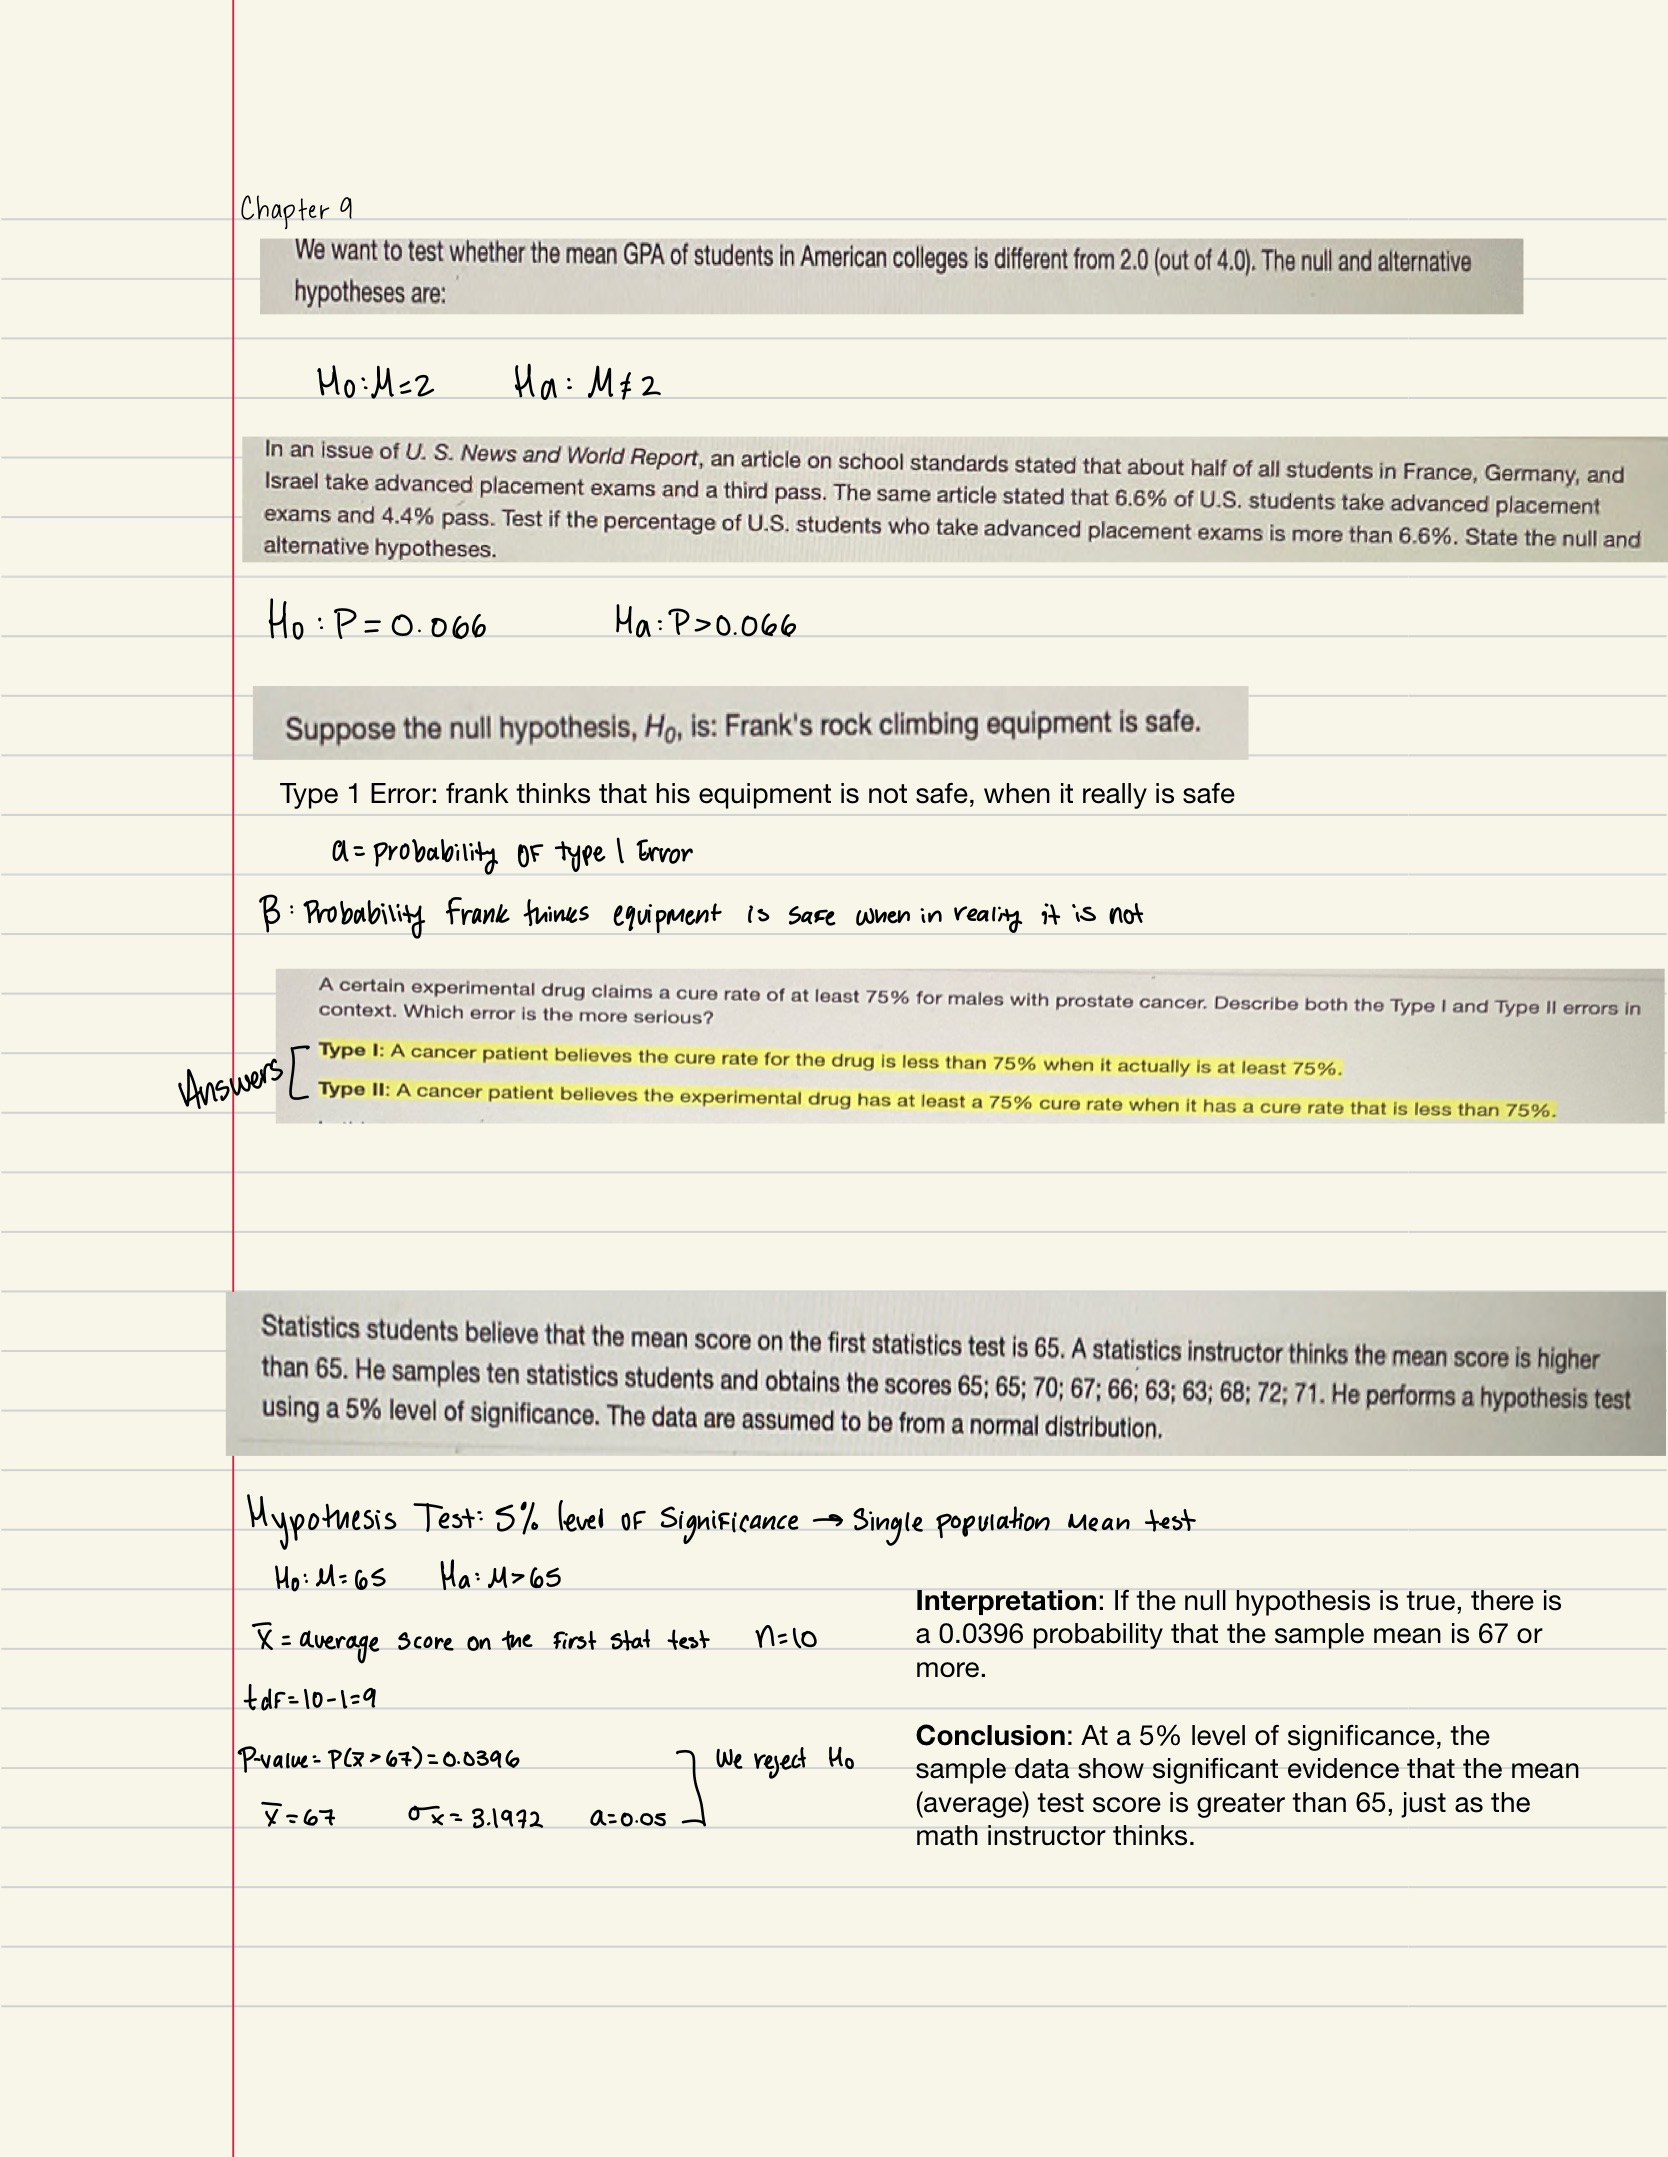
Step 1→ Determine the null and alternative hypotheses.
Step 2→ Verify all conditions have been met and state the level of significance.
Step 3→ Summarize the data into an appropriate test statistic.
Step 4→ Find the p-value by comparing the test statistic to the possibilities expected if the null hypothesis were true OR determine the critical value.
Step 5→ Decide whether the result is statistically significant based on the p-value.
Step 6→ Report the conclusion in the context of the situation.
9.1 Null and Alternative Hypotheses
Null Hypothesis (H0): A statement of no change, no effect, or no difference. Assumed true until evidence indicates otherwise. We either reject or fail to reject H0.
Alternative Hypothesis (Ha): A statement that we are trying to find evidence to support; contradictory to H0.
One-tailed tests: Left- and right-tailed tests. Alternative hypothesis changes; the null hypothesis remains the same in all three tests.
Three ways to set up the null and alternative hypotheses are:
Equal hypothesis versus not equal hypothesis (two-tailed test)
H0: parameter = null value
H1: parameter ≠ null value
Equal versus less than (left-tailed test)
H0: parameter = null value
H1: parameter < null value
Equal versus greater than (right-tailed test)
H0: parameter = null value
H1: parameter > null value
9.2: Outcomes and the Type I and Type II Errors
α: P(Type I Error) = P(Rejecting H0 when H0 is true)
β: P(Type II Error) = P(Failing to Reject H0 when H0 is false)
Power: probability we correctly reject the null hypothesis, which occurs with probability 1 − β.
Four Outcomes from Hypothesis Testing
We reject the null hypothesis when the alternative hypothesis is true. This decision would be correct.
We do not reject the null hypothesis when the null hypothesis is true. This decision would be correct.
Type I error: We reject the null hypothesis when the null hypothesis is true. This decision would be incorrect.
Type II error: We do not reject the null hypothesis when the alternative hypothesis is true. This decision would be incorrect.
Power of a Hypothesis Test
There are two features of power that apply to all hypothesis tests and that researchers should keep in mind when they plan a study:
The power increases when the sample size is increased.
The power increases when the difference between the true population value and the null hypothesis value increases.
9.3: Distribution Needed for Hypothesis Testing
If you are testing a single population mean, the distribution for the test is for means: X ∼ tdf
The population parameter is µ. The estimated value (point estimate) for µ is x¯, the sample mean.
The population parameter is p. The estimated value (point estimate) for p is pˆ. pˆ = x/n where x is the number of successes and n is the sample size.
Step 2: Conditions
Means
X ∼ N if X ∼ N
X ∼ N if the Central Limit Theorem holds
Check sample size, n ≥ 30
For proportions
X must follow a binomial distribution
np and nq must both be at least 5
9.4: Rare Events, the Sample, Decision, and Conclusion
Step 3: Test Statistic
The test statistic: Measures the difference between the sample result and the null value.
p-value: the probability that, if the null hypothesis is true, the results from another randomly selected sample will be as extreme or more extreme as the results obtained from the given sample.
Large p-value: calculated from the data indicates that we should not reject the null hypothesis.
Smaller the p-value: the more unlikely the outcome, and the stronger the evidence is against the null hypothesis. We would reject the null hypothesis if the evidence is strongly against it.
Test statistic for a single proportion: z = pˆ- p/√ (p(1 − p)) / n
Test statistic for a single mean: t = x¯− µ / s/ √n
Step 4: Computing the p-Value for the Test
Level of significance: We do this by comparing the p-value to a designated standard
For a less than an alternative hypothesis: find the probability that the test statistic z could have been equal to or less than what it is.
For a greater than alternative hypothesis: find the probability that the test statistic z could have been equal to or greater than what it is.
For a two-tailed alternative hypothesis: the p-value includes the probability areas in both extremes of the distribution of the test statistic z.
Critical region, or rejection region: is the region of possible values for the test statistic that would lead to rejection of the null hypothesis
Critical value: A boundary of a rejection region. Is denoted as z∗ or t∗.
Step 5: Make a decision based on the p-value
p-value ≤ α: we reject the null hypothesis. (“If the P is low, the null must go!”)
p-value > α: we fail to reject the null hypothesis.
Statistically significant: used to describe the results when the researcher has decided that the p-value is small enough to decide in favor of the alternative hypothesis
If the test statistic is in the shaded region (rejection region), reject H0
If the test statistic is NOT in the shaded region (rejection region), fail to reject H0
Step 6: State your conclusion in terms of the problem
If you Reject H0: There is sufficient evidence to conclude [statement in Ha].
If you Fail to Reject H0: There is not sufficient evidence to conclude [statement in Ha].
9.5: Additional Information and Full Hypothesis Test
The p-value is NOT the probability that the null hypothesis is true. Rather, it is the probability of obtaining such an extreme sample result (or one even more extreme) if the null hypothesis were true.
Remember we do NOT accept the null hypothesis, we fail to reject the null.
Examples