Chapter 10: Hypothesis Testing with Two Samples
Introduction
Independent groups (samples are independent)
Test of two population means.
Test of two population proportions.
Matched or paired samples (samples are dependent)
Test of the population mean of differences of measures for paired individuals or objects.
10.1 Two Population Means with Unknown Standard Deviations
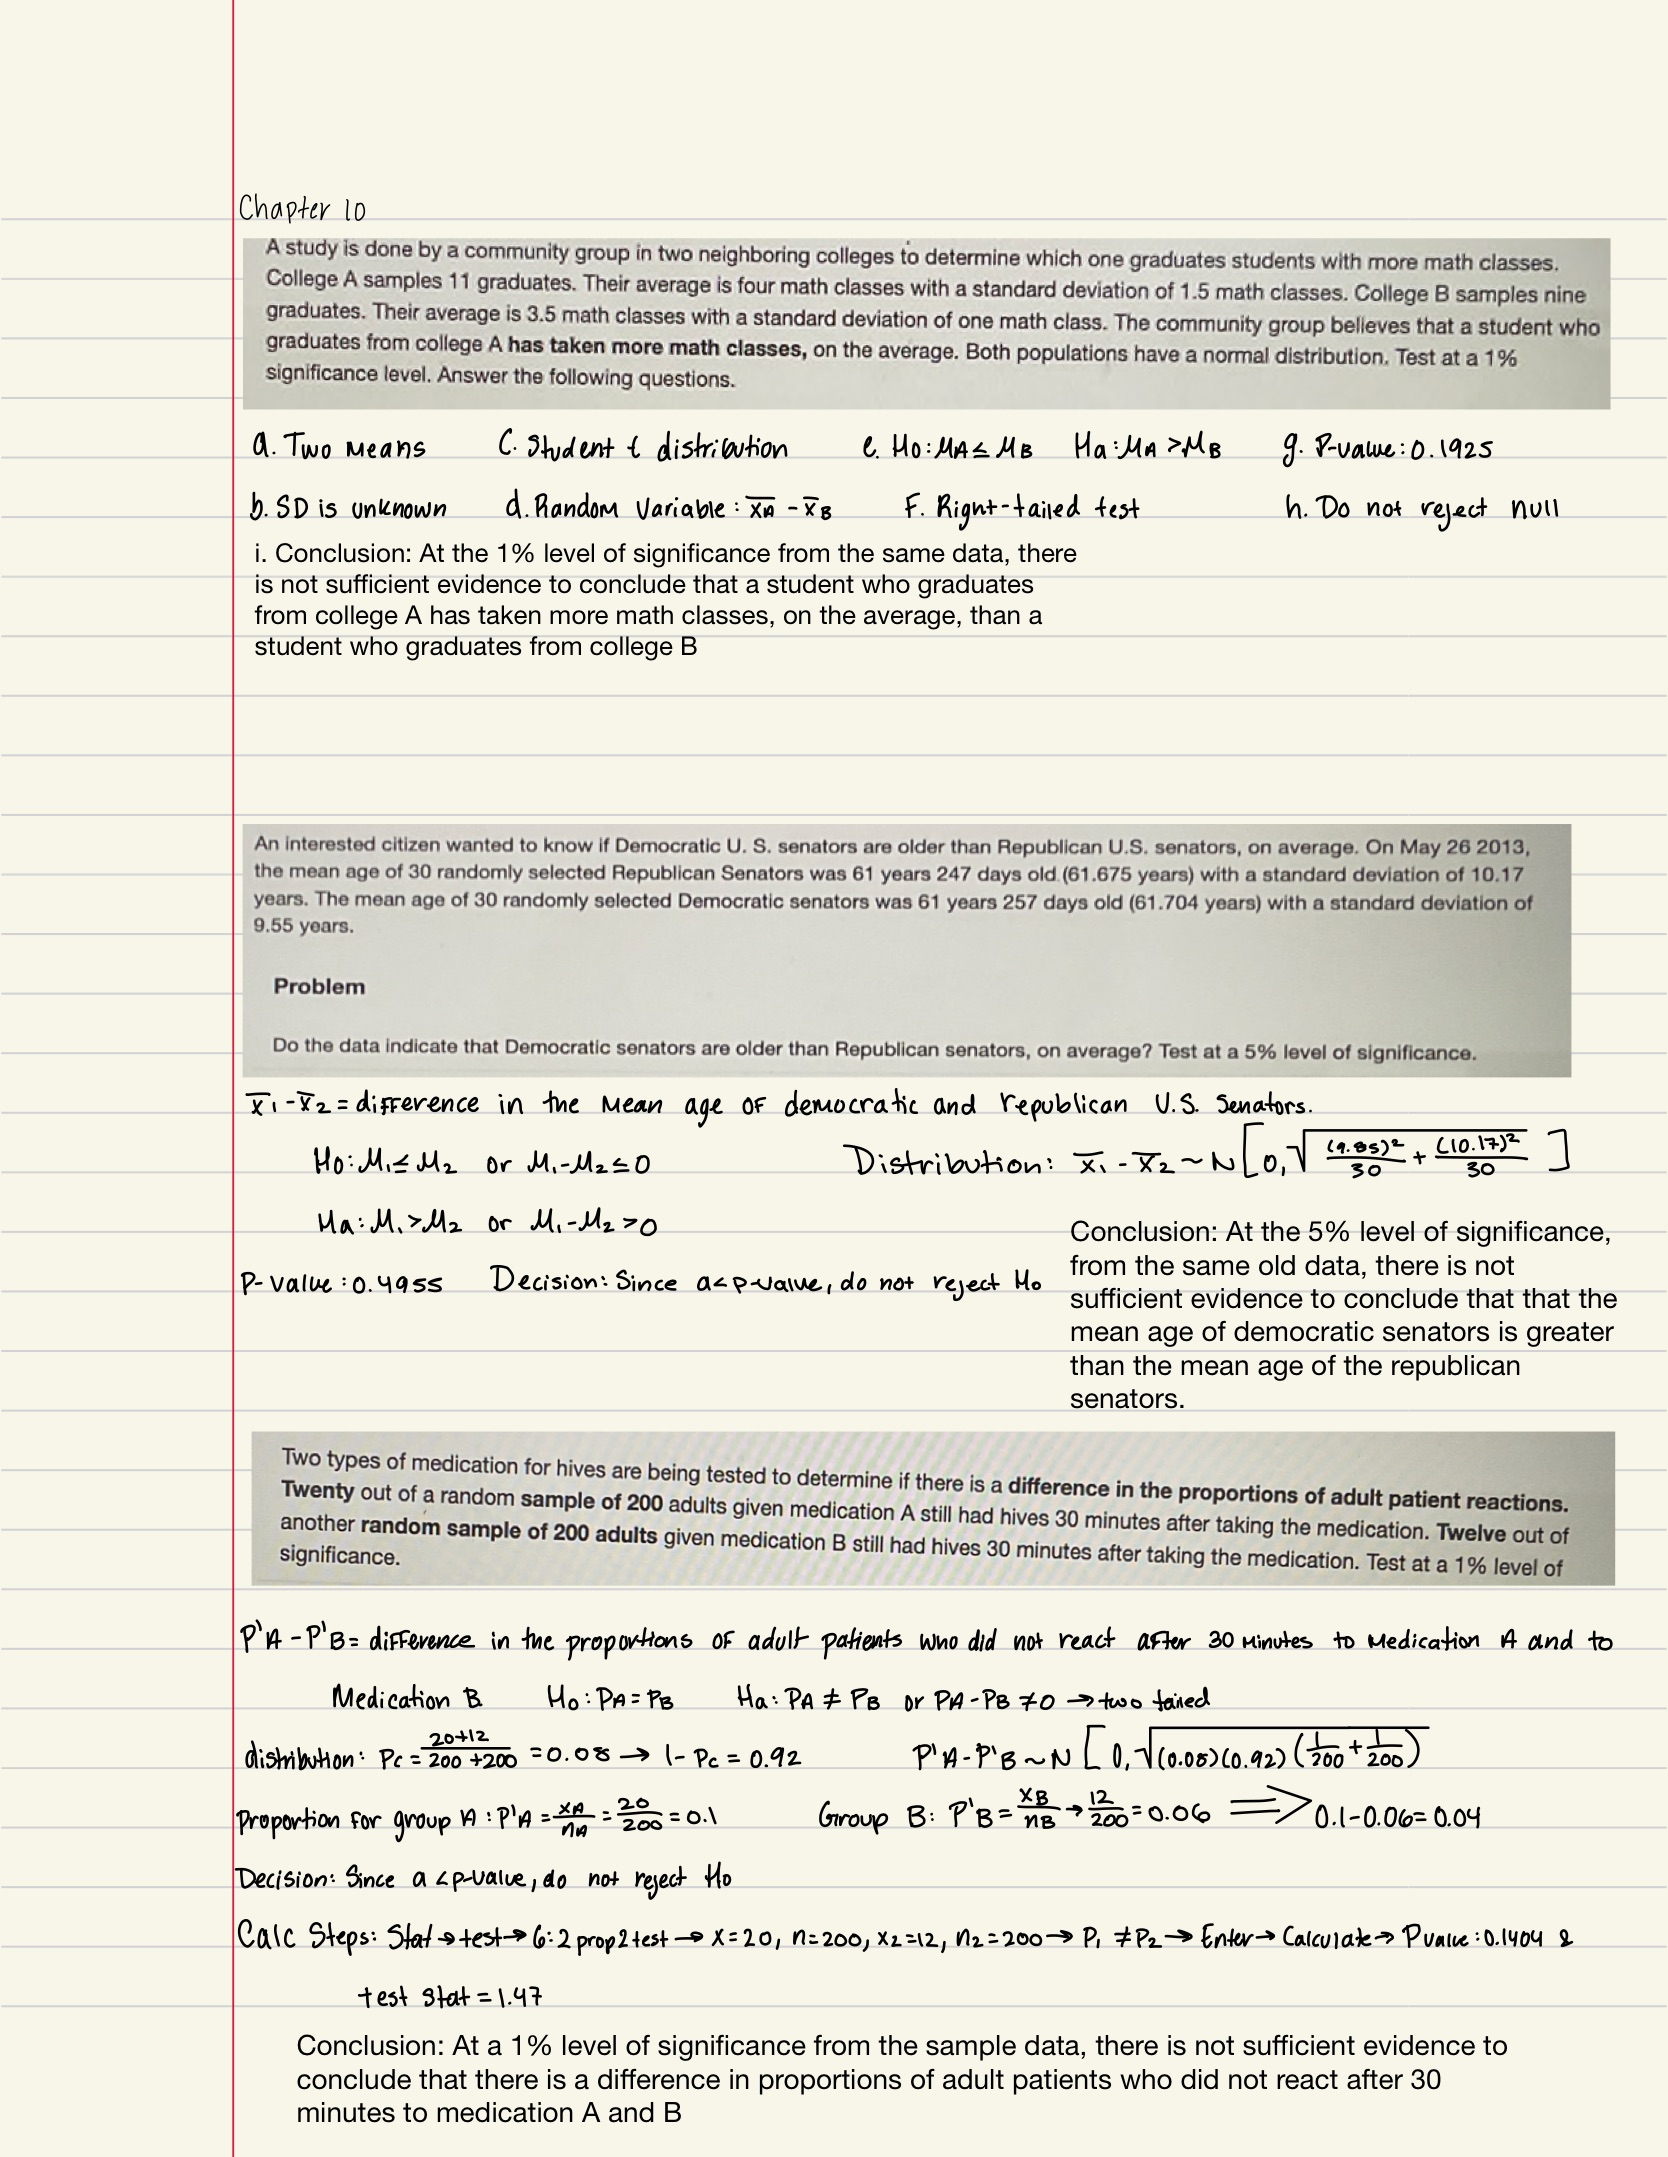
Random Variable: X¯1−X¯2 = the difference of the sampling means
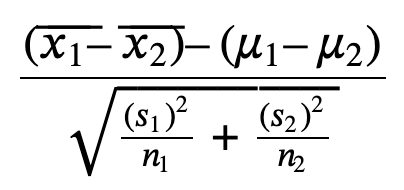
Distribution: Student's t-distribution with degrees of freedom (variances not pooled)
Standard deviation: A number that is equal to the square root of the variance and measures how far data values are from their mean
s: sample standard deviation
σ: population standard deviation.
The two independent samples are simple random samples from two distinct populations.
For the two distinct populations:
if the sample sizes are small, the distributions are important (should be normal)
if the sample sizes are large, the distributions are not important (need not be normal)
Aspin-Welch t-test: The test comparing two independent population means with unknown and possibly unequal population standard deviations
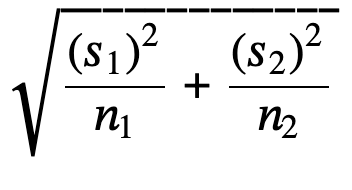
s1 and s2: the sample standard deviations, are estimates of σ1 and σ2, respectively.
σ1 and σ2: the unknown population standard deviations.
𝑥⎯⎯1x¯1 and 𝑥⎯⎯2x¯2: the sample means.
μ1 and μ2: the population means.
When both sample sizes n1 and n2 are five or larger, the Student's t approximation is very good.
n1 + n2 > 30: you can use the normal distribution to approximate the Student's t.
Cohen's Standards for Small, Medium, and Large Effect SizesCohen's d: measure of effect size based on the differences between two means. measure of the difference between two means divided by the pooled standard deviation
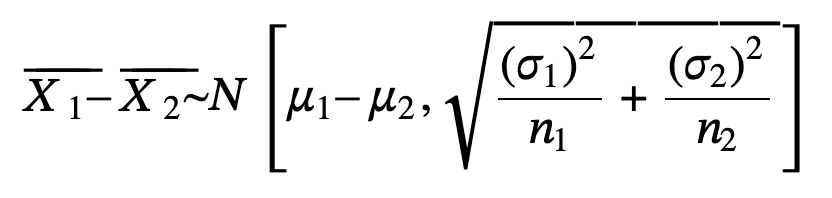
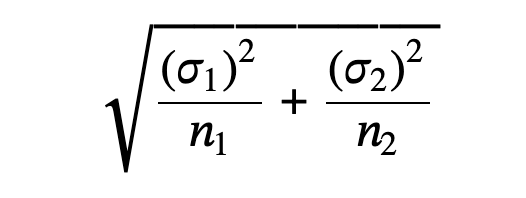
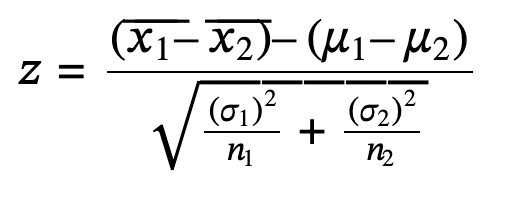
10.2 Two Population Means with Known Standard Deviations
The sampling distribution for the difference between the means is normal and both populations must be normal
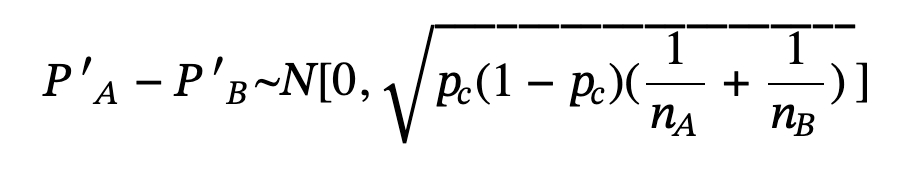
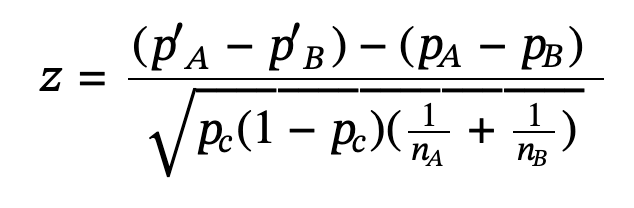
10.3 Comparing Two Independent Population Proportions
Conducting a hypothesis test that compares two independent population proportions
The two independent samples are simple random samples that are independent.
The number of successes is at least five, and the number of failures is at least five, for each of the samples.
Growing literature states that the population must be at least ten or 20 times the size of the sample.
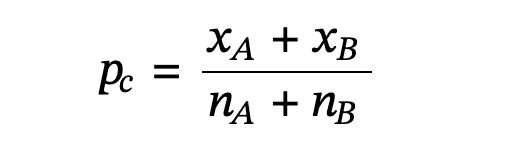
Pc or Pooled proportion: estimate of the common value of p1 and p2.
Null hypothesis: Pa = Pb
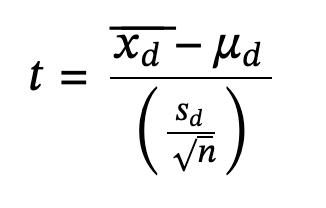
10.4 Matched or Paired Samples
When using a hypothesis test for matched or paired samples, the following characteristics should be present:
Simple random sampling is used.
Sample sizes are often small.
Two measurements (samples) are drawn from the same pair of individuals or objects.
Differences are calculated from the matched or paired samples.
The differences form the sample that is used for the hypothesis test.
Differences that come from a population that is normal or the number of differences is sufficiently large so that distribution of the sample mean of differences is approximately normal.
Hypothesis test for matched or paired samples: subjects are matched in pairs and differences are calculated.
Degrees of freedom: n-1
Examples