
2.2: Data Transformations and Z-Scores
Data Transformations
Measures of center include the mean, median, quartiles, minimum, and maximum of a set of data
Measures of spread include the IQR, range, and standard deviation
When a constant is added to every number in a list,
The measures of center increase by that amount and the measures of spread remain the same
When every number in a list is multiplied by a constant,
The measures of center are multiplied by that amount and the measures of spread also get multiplied by that amount
Comparing Unalike Figures
Suppose we have two values that we want to compare, but they don’t come from the same distribution
Eg. getting a 610 on SAT math vs. a 24 on ACT math
Eg. being a 80” guy vs. a 76.5” girl
We can compare these figures by getting a standardized score called a z-score
z = (x-μ)/σ
z: z-score
x: value
μ: population mean
σ: population standard deviation
A z-score shows exactly how many standard deviations above or below the mean a value is
Even if two data points come from different distributions, they can be directly compared if converted to z-scores
When comparing two z-scores, the higher z-score is the better relative score
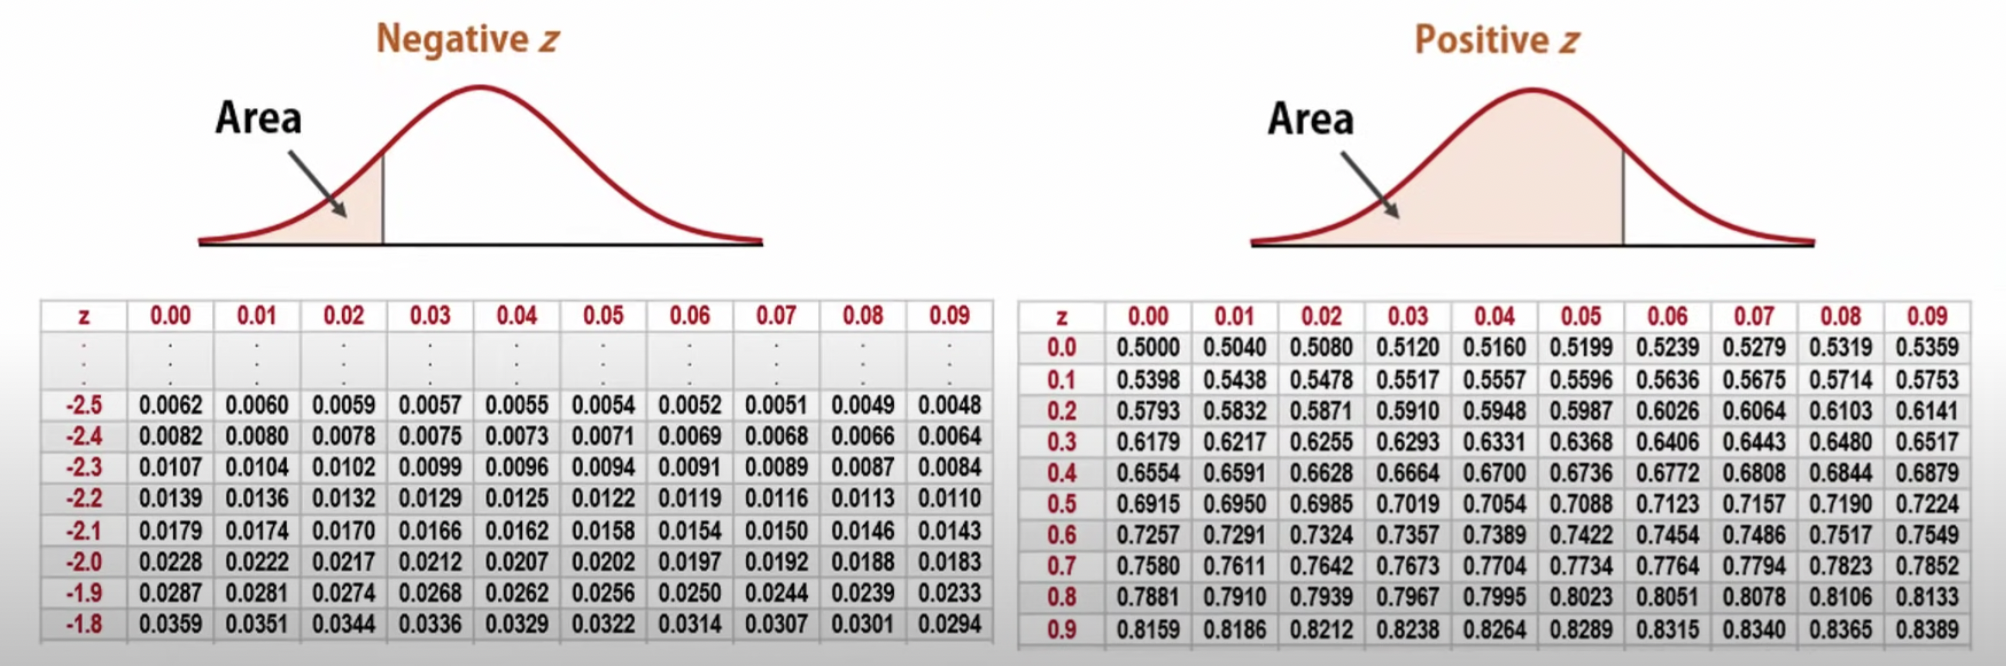
Z-Charts
A chart which can be used to convert proportions to z-scores and vise-versa
Available on the “cheat sheet” during the AP exam
Example Problem
Find percent of values less than 54
μ = 65
σ = 9
X~N (μ,σ) → Z~N (65,9)
Finding P(x<54) → x = 54, put into equation z = (x-μ)/σ
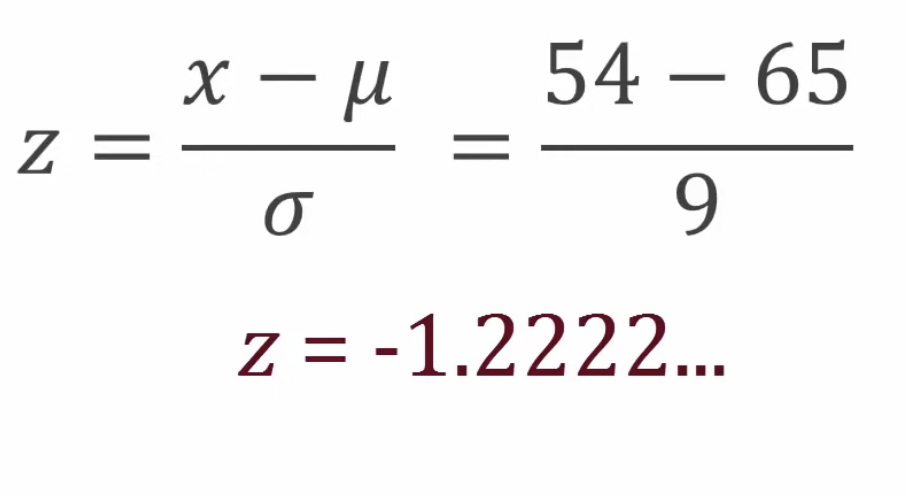
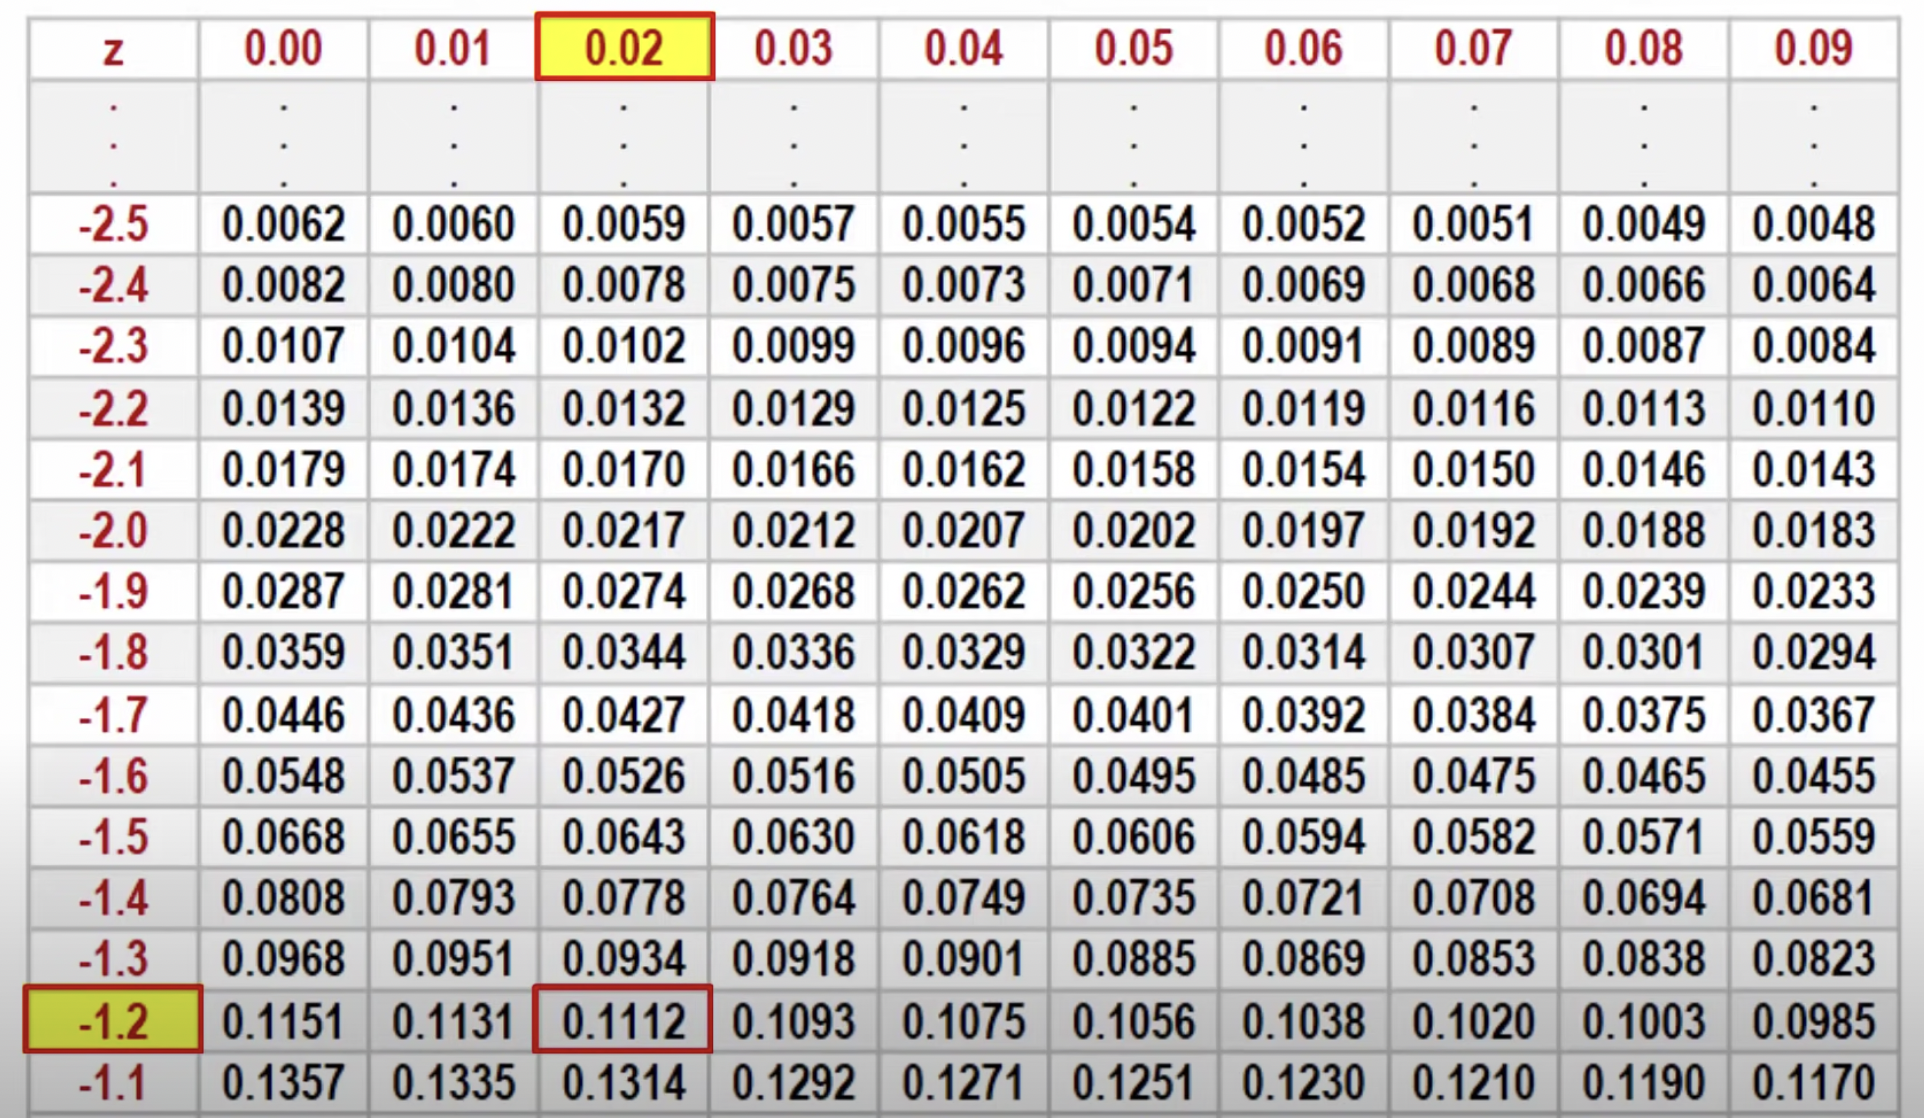
Locate z = -1.2222 on z-chart
P(x < 54) = P(z < -1.22) = 0.1112 (11.12%)