Chapter 6: The Normal Distribution
6.1 The Standard Normal Distribution
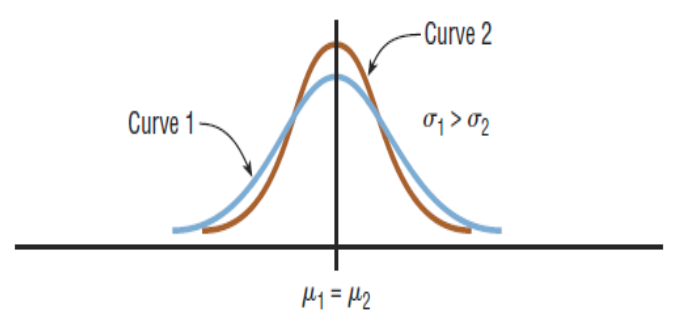
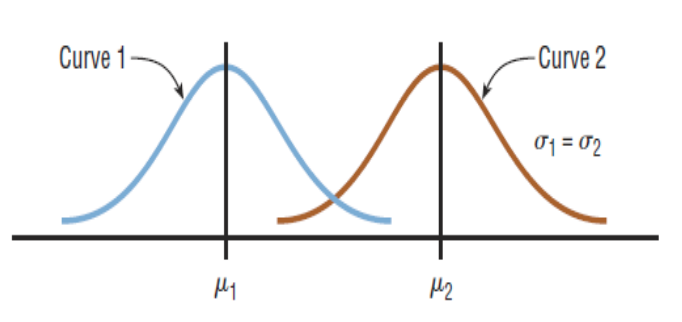
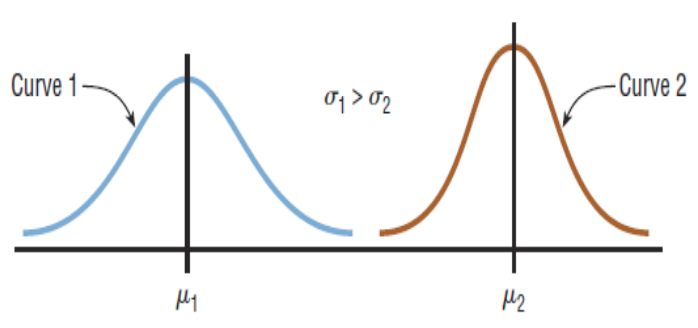
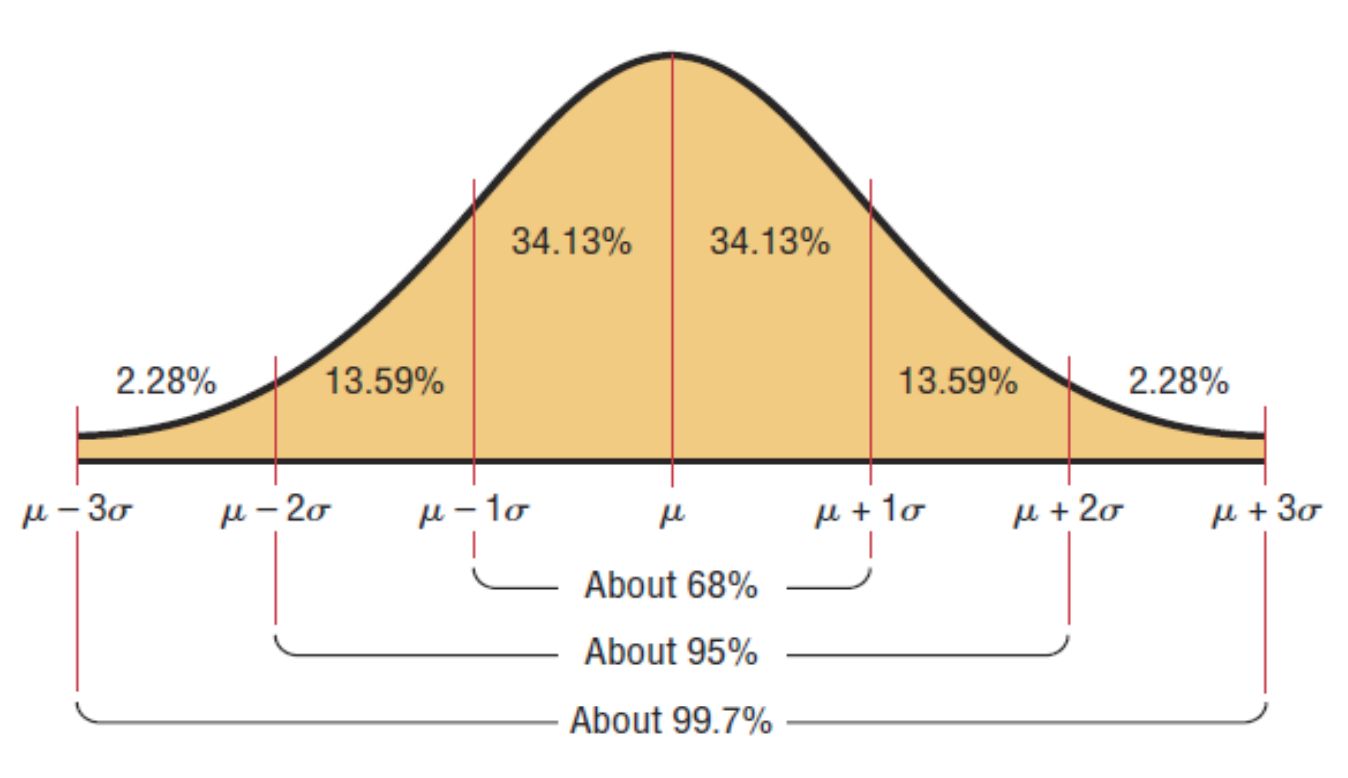
Normal distribution: A bell curve or a Gaussian distribution curve. If a random variable has a probability distribution whose graph is continuous, symmetric, and bell-shaped.
Approximately normally distributed variables: Many continuous variables (e.g. weights, heights) have distributions that are bell-shaped
Standard normal distribution: a normal distribution with a mean of µ = 0 and a standard deviation of σ = 1.
Z-score formula: 𝑿 − 𝝁 / σ
Summary of the Properties of the Theoretical Normal Distribution
Mean = Median = Mode
A normal distribution curve is unimodal.
The curve never touches the x-axis.
The total area under a normal distribution curve is equal to 1.00
6.2 Using the Normal Distribution
Normal Distribution: X ~ N(µ, σ) where µ is the mean and σ is the standard deviation.
(P → X): 𝑿 = 𝝁 + 𝝈Z
Number of units (individual/items) satisfying a condition→ Total number of units given in the problem × are calculated based on condition
Calculator function for probability: normalcdf (lower x value of the area, upper x value of the area, mean, standard deviation)
Calculator function for the kth percentile: k = invNorm (area to the left of k, mean, standard deviation)
6.3 The Central Limit Theorem
Sampling distribution of sample means: a distribution using the means computed from all possible random samples of a specific size taken from a population.
Sampling error: the difference between the sample measure and the corresponding population measure because the sample is not a perfect representation of the population.
Properties of the Distribution of Sample Means
The mean of the sample means = population mean.
The standard deviation of the sample means < standard deviation of the population
The standard deviation of the sample means will be equal to the population standard deviation divided by the square root of the sample size.
The Central Limit Theorem: sample size n, mean µ, and standard deviation σ are given
Standard error of the sample mean: 𝝈/ √𝑛
Examples