Chapter 11: The Chi-Square Distribution
Introductory
Three major applications of the chi-square distribution:
The goodness-of-fit test, which determines if data fit a particular distribution, such as in the lottery example
The test of independence, which determines if events are independent, such as in the movie example
The test of a single variance, which tests variability, such as in the coffee example
11.1 Facts About the Chi-Square Distribution
Degrees of freedom: which depends on how chi-square is being used.
The population standard deviation is 𝜎=√2(df).
Population mean: μ = df
Random variable: X^2
Squared standard normal variables: χ2 = (Z1)^2 + (Z2)^2 + ... + (Zk)^2
The curve is nonsymmetrical and skewed to the right.
There is a different chi-square curve for each df.
The test statistic for any test is always greater than or equal to zero.
When df > 90, the chi-square curve approximates the normal distribution.
The mean, μ, is located just to the right of the peak
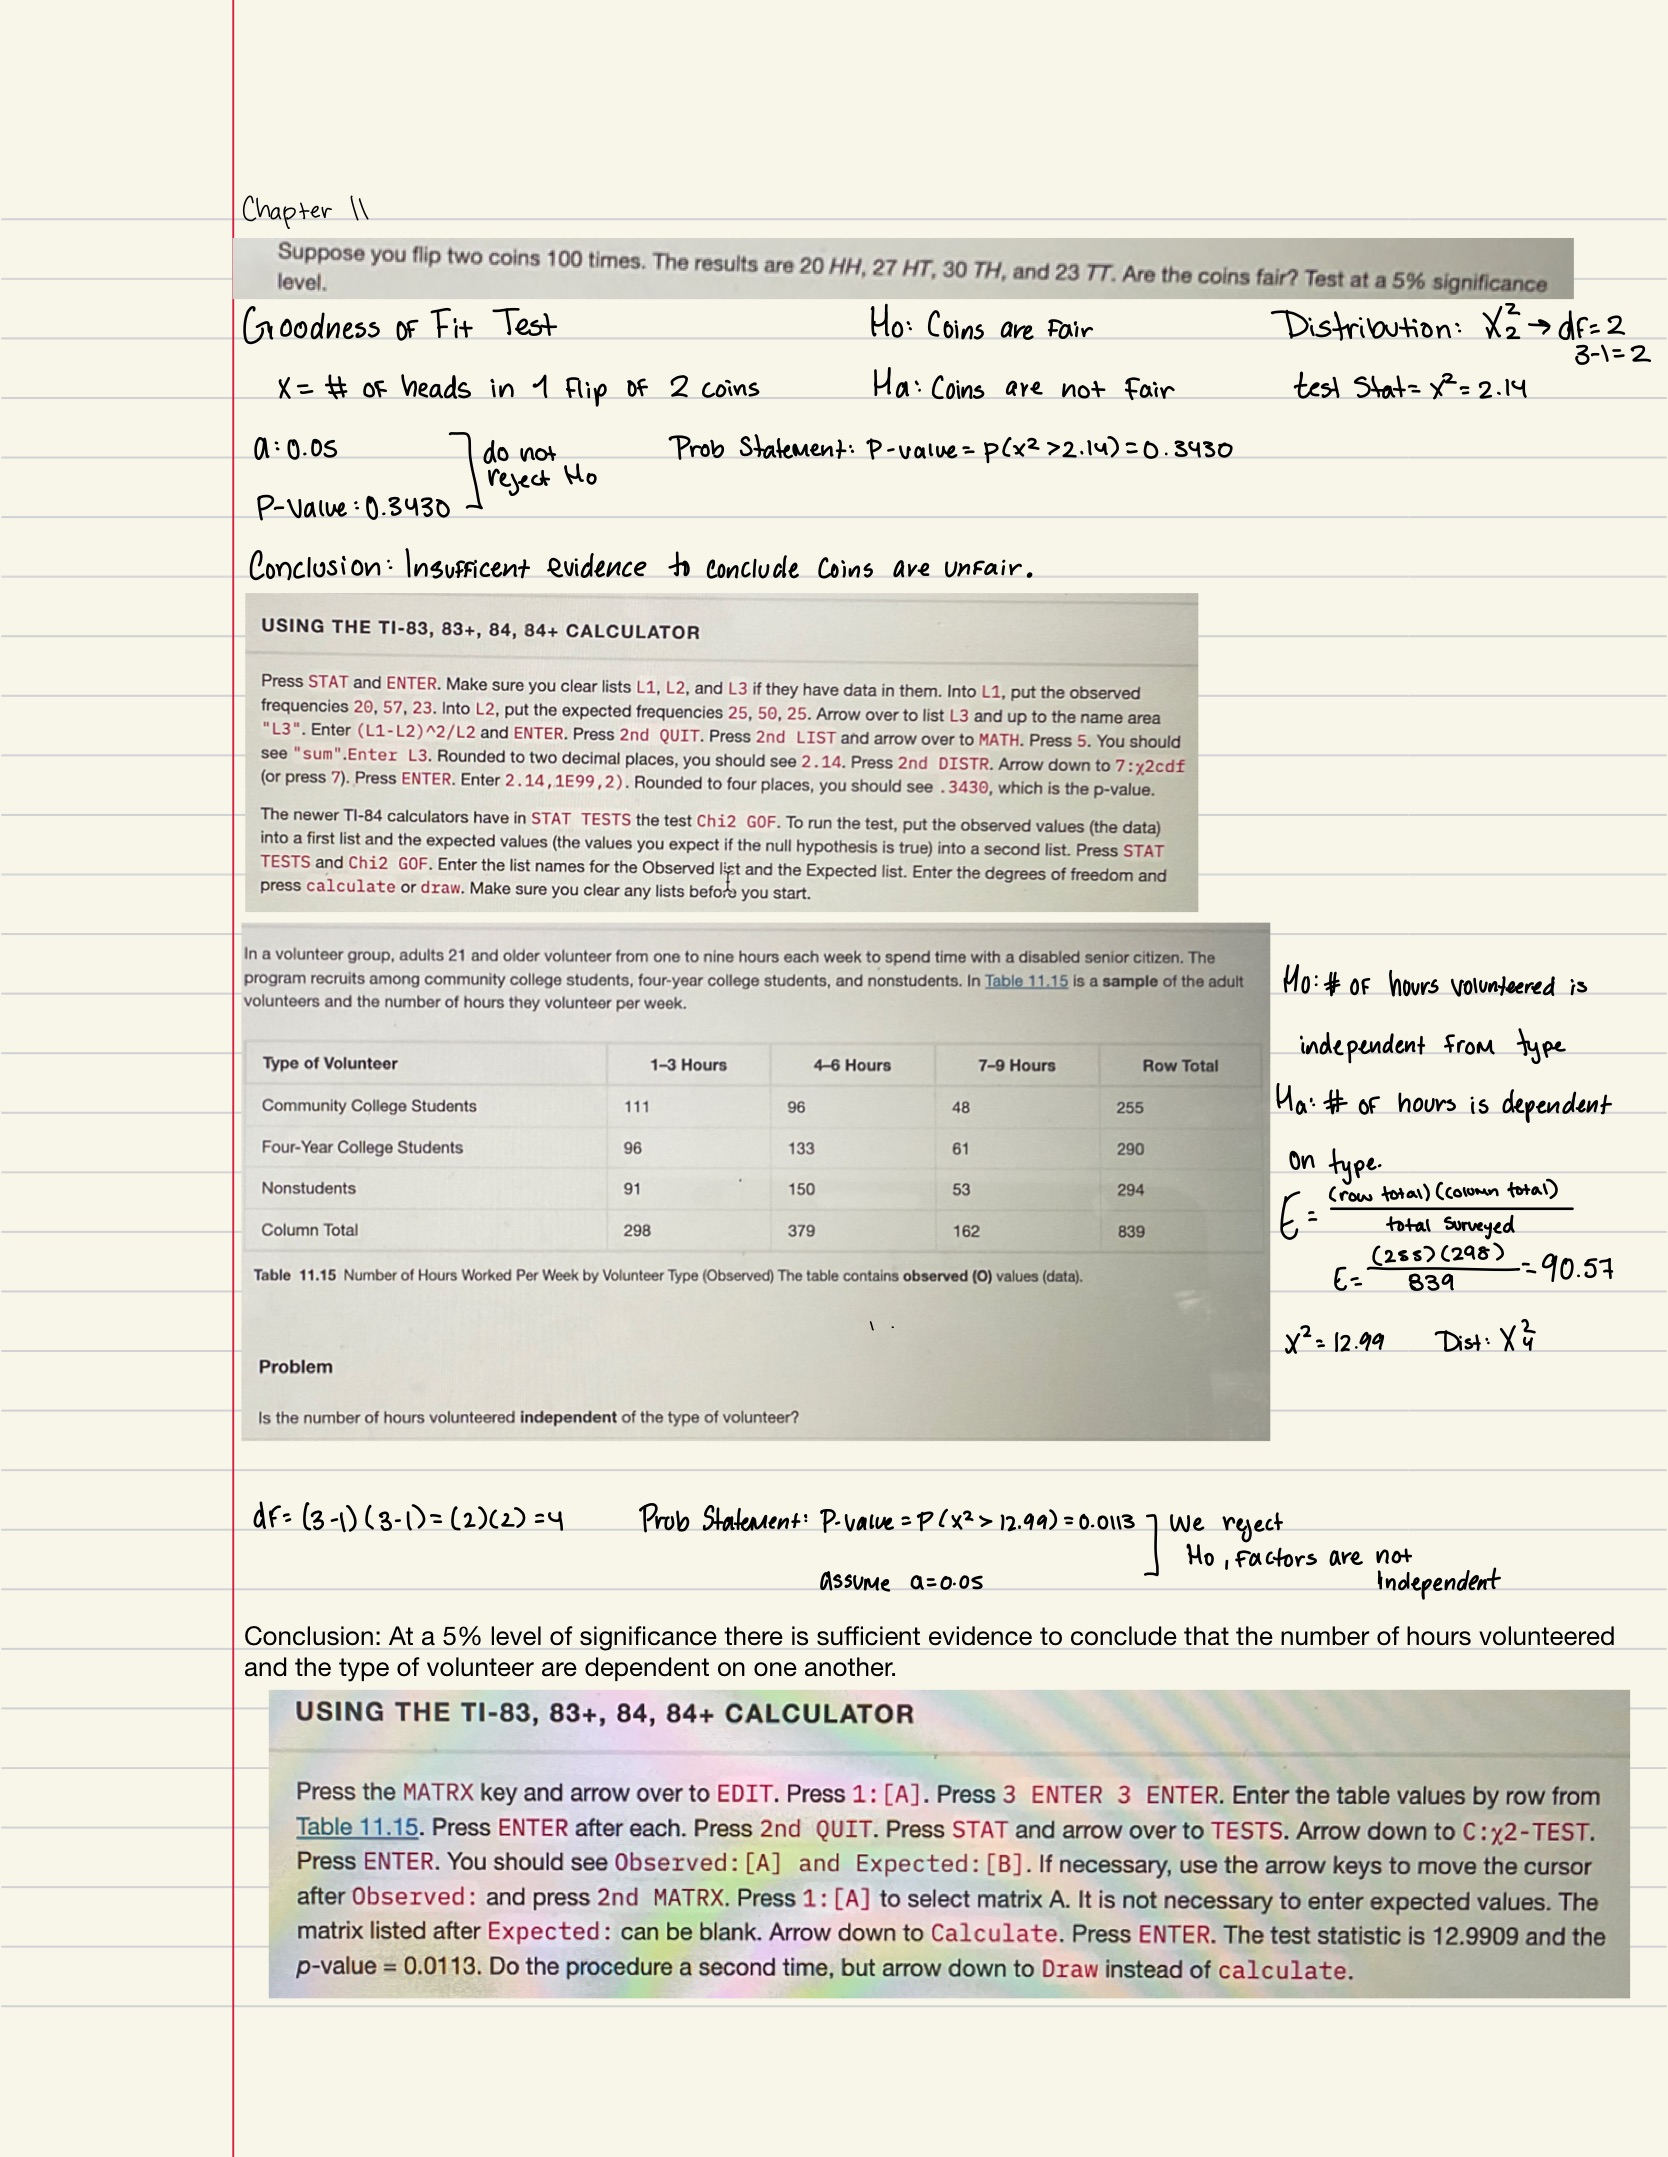
11.2 Goodness-of-Fit Test
The null and alternative hypotheses for GOF: may be written in sentences or may be stated as equations or inequalities.
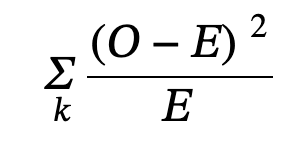
where
O = observed values (data)
E = expected values (from theory)
k = the number of different data cells or categories
Null hypothesis: The observed values of the data values and expected values are values you would expect to get.
Degrees of freedom GOF: Number of categories - 1
The goodness of fit is usually right-tailed
Large test statistic: Observed values and corresponding expected values are not close to each other.
Expected value rule: Needs to be above 5 to be able to use the test
11.3 Test of Independence
Tests of independence use a contingency table of observed data values
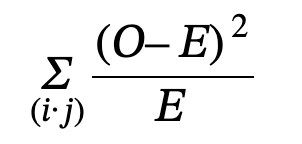
where
O = observed values
E = expected values
i = the number of rows in the table
j = the number of columns in the table
Test of independence: Determines whether two factors are independent or not
The null hypothesis for independence: states that the factors are independent
The alternative hypothesis for independence: states that they are not independent (dependent).
Independence degrees of freedom: (number of columns -1)(number of rows - 1)
Expected value formula: (row total)(column total) / total number surveyed
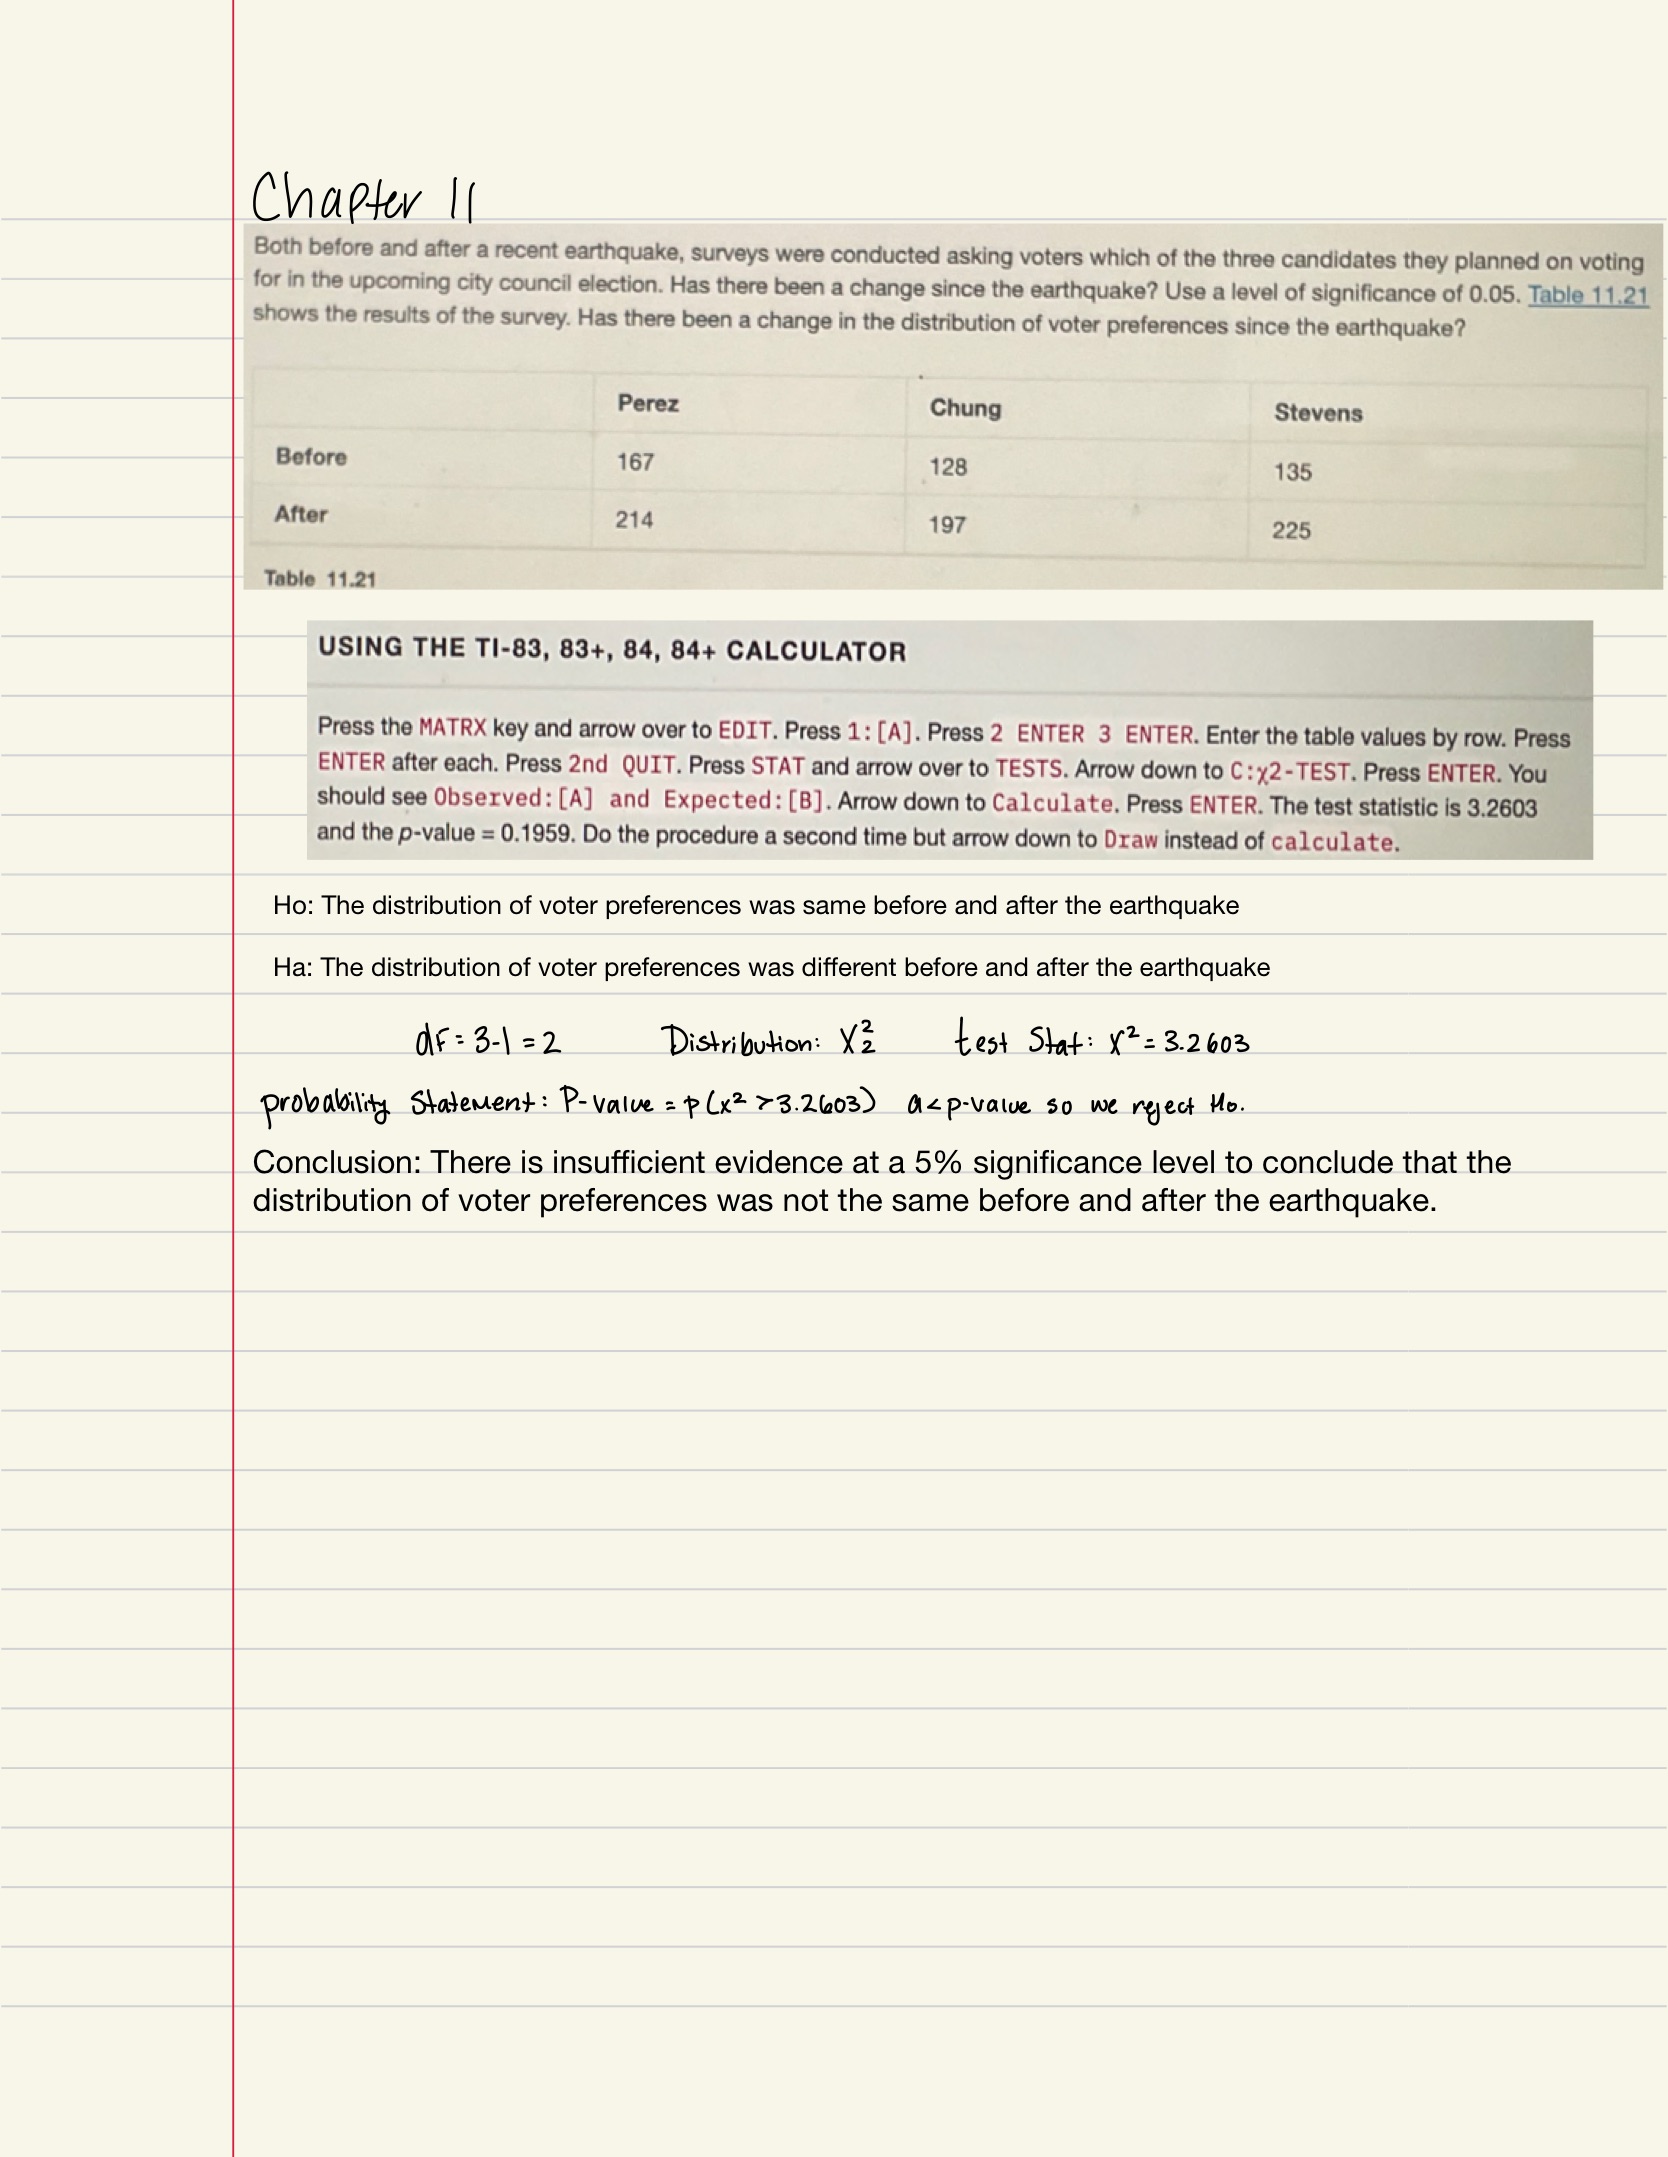
11.4 Test for Homogeneity
Test for Homogeneity: used to draw a conclusion about whether two populations have the same distribution
Ho: The distributions of the two populations are the same.
Ha: The distributions of the two populations are not the same.
The test statistic for Homogeneity: Use a χ2 test statistic. It is computed in the same way as the test for independence.
11.5 Comparison of the Chi-Square Test
Goodness-of-Fit: decides whether a population with an unknown distribution "fits" a known distribution.
Ho for GOF: The population fits the given distribution
Ha for GOF: The population does not fit the given distribution.
Independence: decides whether two variables are independent or dependent. There will be two qualitative variables and a contingency table will be constructed.
Ho for Independence: The two variables (factors) are independent.
Ha for Independence: The two variables (factors) are dependent.
Homogeneity: decides if two populations with unknown distributions have the same distribution as each other. There will be a single qualitative survey variable given to two different populations.
Ho of Homogeneity: The two populations follow the same distribution.
Ha of Homogeneity*:* The two populations have different distributions.
11.6 Test of a Single Variance
Test of a single variance: assumes that the underlying distribution is normal
Hypotheses: stated in terms of the population variance
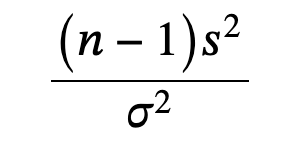
where
n = the total number of data
s2 = sample variance
σ2 = population variance
A test of a single variance may be right-tailed, left-tailed, or two-tailed
Examples