


Microeconomics Chapter 1
Scarcity
All resources are limited, some more than other - have to manage these while fulfilling as many economic wants
Examples:
Having to add a minimal amount of armor to fighter jets so they don’t get shot down.
Increasing minimum wage pays some people more, but also forces businesses to hire less people
Economists must see possible consequences - can’t just analyze what is there, have to predict what is not
Scarcity - limited resources, unlimited economic wants
Capital goods vs. consumer goods
Capital goods: government spending, more money spent on capital goods -→ future economic growth
Consumer goods: providing resources to people - helpful to people in short term, but doesn’t encourage long term growth
Resources: Land, Labor, Capital, and Entrepreneurial ability
Economics focuses on how to deal with scarcity - macroeconomics deals with entire economy, micro deals with specific markets
Cannot do economic experiments, way too many variables in the environment; Make assumptions to explain some things
Production Possibilities Curve
PPC - Used to see the maximum amount of products that can be created with scarce resources
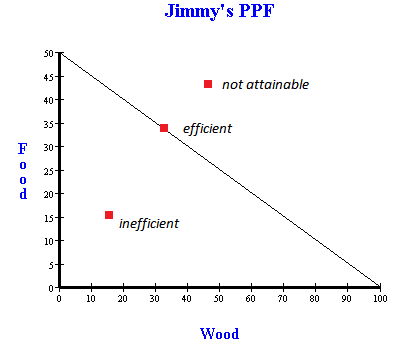
Anything on the line is and efficient use of resources - Inside is inefficient, outside is not attainable
Model makes assumptions as mentioned before - full employment, fixed resources, fixed technology
Opportunity Cost - Basically the cost of choosing one option over another
Example: If you make 10 dollars in a day and decide to go on vacation for 4 days, the opportunity cost is 40 dollars
Example: Opportunity cost per unit of wood is 5 units of food/20 units of wood: 1/4 unit of food per unit of wood
Minimal opportunity cost = maximum utility
Opportunity cost per unit = give up/get
Opportunity cost of food = reciprocal of opportunity cost of wood: 4 units of wood per unit of food
Marginal Analysis - Analyzing benefits vs. costs of economic decisions
MR = MC (Marginal Revenue >= Marginal Cost; Otherwise, Opportunity cost is too high)
Graph shows constant opportunity cost - As you make more wood, you are losing a fixed amount of food, and vice versa

This graph shows increasing opportunity cost: Basically, as you give up more resources for making one thing to make another thing, those resources are less suited to make the new thing, so the opportunity cost is higher
Economic Growth = growing the curve so it reaches farther out;
More resources, or improved resources
Better Education
Better technology
Also possible with international trade
Some pitfalls in Economics:
Bias - “First rule of economics → scarcity, first rule of politics → forget rule one of economics.”