
Chapter 3: Collecting Data
Retrospective Versus Prospective Observational Studies
Observational studies aim to gather information about a population without disturbing the population.
Retrospective studies look backward, examining existing data.
Prospective studies watch for outcomes, tracking individuals into the future.
➥ Example 3.1
Retrospective studies of the 2014–2016 Ebola epidemic in West Africa have looked at the timing, numbers, and locations of reported cases and have tried to understand how the outbreak spread. There is now much better understanding of transmission through contact with bodily fluids of infected people. Several prospective studies involve ongoing surveillance to see how experience and tools to rapidly identify cases will now limit future epidemics.
Advantages and Disadvantages
Retrospective studies tend to be smaller scale, quicker to complete, and less expensive. In cases such as addressing diseases with low incidence, the study begins right from the start with people who have already been identified. However, researchers have much less control, usually having to rely on past record keeping of others. Furthermore, the existing data will often have been gathered for other purposes than the topic of interest. Then there is the problem of subjects' inaccurate memories and possible biases.
Prospective studies usually have greater accuracy in data collection and are less susceptible to recall error from subjects. Researchers do their own record keeping and can monitor exactly what variables they are interested in. However, these studies can be very expensive and time consuming, as they often follow large numbers of subjects for a long time.
Bias
The one thing that most quickly invalidates a sample and makes obtaining useful information and drawing meaningful conclusions impossible.
Sampling method - is biased if in some critical way it consistently results in samples that do not represent the population**.** This typically leads to certain responses being repeatedly favored over others.
Sampling bias - is a property of the sampling method, not of any one sample generated by the method.
Voluntary response surveys - are based on individuals who choose to participate, typically give too much emphasis to people with strong opinions, and undersample people who don’t care much about a topic.
Although a voluntary response survey may be easy and inexpensive to conduct, the sample is likely to be composed of strongly opinionated people, especially those with negative opinions on a subject.
Convenience surveys - are based on choosing individuals who are easy to reach. These surveys tend to produce data highly unrepresentative of the entire population.
Although convenience samples may allow a researcher to conduct a survey quickly and inexpensively, generalizing from the sample to a population is almost impossible.
Undercoverage bias - happens when there is inadequate representation, and thus some groups in the population are left out of the process of choosing the sample.
Response bias - occurs when the question itself can lead to misleading results because people don’t want to be perceived as having unpopular or unsavory views or don’t want to admit to having committed crimes.
Nonresponse bias - where there are low response rates, occurs when individuals chosen for the sample can’t be contacted or refuse to participate, and it is often unclear which part of the population is responding.
Quota sampling bias - where interviewers are given free choice in picking people in the (problematic, if not impossible) attempt to pick representatively with no randomization, is a recipe for disaster.
Question wording bias - can occur when nonneutral or poorly worded questions lead to very unrepresentative responses or even when the order in which questions are asked makes a difference.
➥Example 3.2
The Military Times, in collaboration with the Institute for Veterans and Military Families at Syracuse University, conducted a voluntary and confidential online survey of U.S. service members who were readers of the Military Times. Their military status was verified through official Defense Department email addresses. What were possible sources of bias?
Solution: First, voluntary online surveys are very suspect because they typically overcount strongly opinionated people. Second, undercoverage bias is likely because only readers of the Military Times took part in the survey. Note that response bias was probably not a problem because the survey was confidential.
Sampling Methods
Census - Collecting data from every individual in a population.
How can we increase our chance of choosing a representative sample?
One technique is to write the name of each member of the population on a card, mix the cards thoroughly in a large box, and pull out a specified number of cards. This method gives everyone in the population an equal chance of being selected as part of the sample. Unfortunately, this method is usually too time-consuming, and bias might still creep in if the mixing is not thorough.
A simple random sample (SRS), one in which every possible sample of the desired size has an equal chance of being selected, can be more easily obtained by assigning a number to everyone in the population and using a random digit table or having a computer generate random numbers to indicate choices.
➥ Example 3.3
Suppose 80 students are taking an AP Statistics course and the teacher wants to pick a sample of 10 students randomly to try out a practice exam. She can make use of a random number generator on a computer. Assign the students numbers 1, 2, 3, …, 80. Use a computer to generate 10 random integers between 1 and 80 without replacement, that is, throw out repeats. The sample consists of the students with assigned numbers corresponding to the 10 unique computer-generated numbers.
An alternative solution:
is to first assign the students numbers 01, 02, 03, . . ., 80. While reading off two digits at a time from a random digit table, she ignores any numbers over 80, ignores 00, and ignores repeats, stopping when she has a set of 10. If the table began 75425 56573 90420 48642 27537 61036 15074 84675, she would choose the students numbered 75, 42, 55, 65, 73, 04, 27, 53, 76, and 10. Note that 90 and 86 are ignored because they are over 80. Note that the second and third occurrences of 42 are ignored because they are repeats.
Advantages of simple random sampling include the following:
The simplicity of simple random sampling makes it relatively easy to interpret data collected.
This method requires minimal advance knowledge of the population other than knowing the complete sampling frame.
Simple random sampling allows us to make generalizations (i.e., statistical inferences) from the sample to the population.
Among the major parameters with which we will work, simple random sampling tends to be unbiased, that is, when repeated many times, it gives sample statistics that are centered around the true parameter value.
Disadvantages of simple random sampling include the following:
The need for a list of all potential subjects can be a formidable task.
Although simple random sampling is a straightforward procedure to understand, it can be difficult to execute, especially if the population is large. For example, how would you obtain a simple random sample of students from the population of all high school students in the United States?
The need to repeatedly contact nonrespondents can be very time-consuming.
Important groups may be left out of the sample when using this method.
Other sampling methods available:
Stratified sampling - involves dividing the population into homogeneous groups called strata, then picking random samples from each of the strata, and finally combining these individual samples into what is called a stratified random sample. (For example, we can stratify by age, gender, income level, or race; pick a sample of people from each stratum; and combine to form the final sample.)
Advantages of stratified sampling include the following:
Samples taken within a stratum have reduced variability, which means the resulting estimates are more precise than when using other sampling methods.
Important differences among groups can become more apparent.
Disadvantages of stratified sampling include the following:
Like an SRS, this method might be difficult to implement with large populations.
Forcing subdivisions when none really exist is meaningless.
Cluster sampling - involves dividing the population into heterogeneous groups called clusters and then picking everyone or everything in a random selection of one or more of the clusters. (For example, to survey high school seniors, we could randomly pick several senior class homerooms in which to conduct our study and sample all students in those selected homerooms.)
Advantages of cluster sampling include the following:
Clusters are often chosen for ease, convenience, and quickness.
With limited fixed funds, cluster sampling usually allows for a larger sample size than do other sampling methods.
Disadvantages of cluster sampling include the following:
With a given sample size, cluster sampling usually provides less precision than either an SRS or a stratified sample provides.
If the population doesn’t have natural clusters and the designated clusters are not representative of the population, selection could easily result in a biased sample.
Systematic sampling - is a relatively simple and quick method. It involves listing the population in some order (for example, alphabetically), choosing a random point to start, and then picking every tenth (or hundredth, or thousandth, or kth) person from the list. This gives a reasonable sample as long as the original order of the list is not in any way related to the variables under consideration.
An advantage of systematic sampling is that if similar members in the list are grouped together, we can end up with a kind of stratified sample, only more easily implemented.
A disadvantage of systematic sampling is that if the list happens to have a periodic structure similar to the period of the sampling, a very biased sample could result.
➥ Example 3.4
Suppose a sample of 100 high school students from a Chicago school of size 5000 is to be chosen to determine their views on whether they think the Cubs will win another World Series this century. One method would be to have each student write his or her name on a card, put the cards into a box, have the principal reach in and pull out 100 cards, and then choose the names on those cards to be the sample. However, questions could arise regarding how well the cards are mixed. For example, how might the outcome be affected if all students in one PE class toss their names in at the same time so that their cards are clumped together? A second method would be to number the students 1 through 5000, and use a random number generator to pick 100 unique (throw out repeats) numbers between 1 and 5000. The sample is then the students whose numbers correspond to the 100 generated numbers. A third method would be to assign each student a number from 0001 to 5000 and use a random digit table, picking out four digits at a time, ignoring repeats, 0000, and numbers over 5000, until a unique set of 100 numbers are picked. Then choose the students corresponding to the selected 100 numbers. What are alternative procedures?
Solution: From a list of the students, the surveyor could choose a random starting name and then simply note every 50th name (systematic sampling). Since students in each class have certain characteristics in common, the surveyor could use a random selection method to pick 25 students from each of the separate lists of freshmen, sophomores, juniors, and seniors (stratified sampling). If each homeroom has a random mix of 20 students from across all grade levels, the surveyor could randomly pick five homerooms with the sample consisting of all the students in these five rooms (cluster sampling).
Sampling Variability
Sampling variability - also called sampling error, is naturally present. This variability can be described using probability; that is, we can say how likely we are to have a certain size error. Generally, the associated probabilities are smaller when the sample size is larger.
➥ Example 3.5
Suppose we are trying to estimate the mean age of high school teachers and have four methods of choosing samples. We choose 10 samples using each method. Later we find the true mean, μ = 42. Plots of the results of each sampling method are given below.
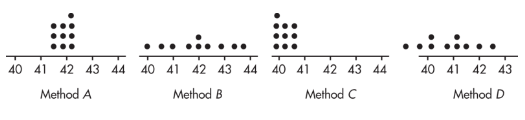
Method A exhibits high accuracy and high precision.
Method B exhibits high accuracy and low precision.
Method C exhibits low accuracy and high precision.
Method D exhibits low accuracy and low precision. Low accuracy (not centered at the right place) indicates probable bias in the selection method.
Note that shape and variability in distributions are completely irrelevant to the issue of sampling bias. Sampling bias is focused on the center of the distribution.
Experiments Versus Observational Studies
Observational Studies | Experiments |
|---|---|
Observe and measure without influencing | Impose treatments and measure responses |
Can only show associations | Can suggest cause-and-effect relationships |
Use of random sampling in order to be able to generalize to a population | Use of random assignment to minimize the effect of confounding variables |
Usually less expensive and less time-consuming | Can be expensive and time-consuming |
Use of strata, and randomization within strata, for greater accuracy and to reduce variability | Use of blocks, and randomization within blocks, to control for certain variables |
Possible ethical concerns over imposing certain treatments | |
Use of blinding and double-blinding |
➥ Example 3.6
A study is to be designed to determine whether a particular commercial review course actually helps raise SAT scores among students attending a particular high school. How could an observational study be performed? An experiment? Which is more appropriate here?
Solution:
An observational study would interview students at the school who have taken the SAT exam, asking whether or not they took the review course, and then the SAT results of those who have and have not taken the review course would be compared.
An experiment performed on students at the school who are planning to take the SAT exam would use chance to randomly assign some students to take the review course while others to not take the course and would then compare the SAT results of those who have and have not taken the review course.
The experimental approach is more appropriate here. With the observational study, there could be many explanations for any SAT score difference noted between those who took the course and those who didn’t. For example, students who took the course might be the more serious high school students. Higher score results might be due to their more serious outlook and have nothing to do with taking the course. The experiment tries to control for confounding variables by using random assignment to make the groups taking and not taking the course as similar as possible except for whether or not the individuals take the course.
The Language of Experiments
Experimental units - An experiment is performed on objects.
Subjects - If the units are people.
Experiments involve explanatory variables, called factors, that are believed to have an effect on response variables. A group is intentionally treated with some level of the explanatory variable, and the outcome of the response variable is measured.
➥ Example 3.7
In an experiment to test exercise and blood pressure reduction, volunteers are randomly assigned to participate in either 0, 1, or 2 hours of exercise per day for 5 days over the next 6 months. What is the explanatory variable with the corresponding levels, and what is the response variable?
Solution: The explanatory variable, hours of exercise, is being implemented at three levels: 0, 1, and 2 hours a day. The response variable is not specified but could be the measured change in either systolic or diastolic blood pressure readings after 6 months.
Suppose the volunteers were further randomly assigned to follow either the DASH (Dietary Approaches to Stop Hypertension) or the TLC (Therapeutic Lifestyle Changes) diet for the 6 months. There would then be two factors, hours of exercise with three levels and diet plan with two levels, and a total of six treatments (DASH diet with 0 hours daily exercise, DASH with 1 hour exercise, DASH with 2 hours exercise, TLC diet with 0 hours daily exercise, TLC with 1 hour exercise, and TLC with 2 hours exercise).
In an experiment, there is often a control group to determine if the treatment of interest has an effect. There are several types of control groups.
A control group can be a collection of experimental units not given any treatment, or g__iven the current treatment__, or given a treatment with an inactive substance (a placebo). When a control group receives the current treatment or a placebo, these count as treatments if asked to enumerate the treatments.
➥ Example 3.8
Sixty patients, ages 5 to 12, all with common warts are enrolled in a study to determine if application of duct tape is as effective as cryotherapy in the treatment of warts. Subjects will receive either cryotherapy (liquid nitrogen applied to each wart for 10 seconds every 2 weeks) for 6 treatments or duct tape occlusion (applied directly to the wart) for 2 months. Describe a completely randomized design.
Solution: Assign each patient a number from 1 to 60. Use a random integer generator on a calculator to pick integers between 1 and 60, throwing away repeats, until 30 unique integers have been selected. (Or numbering the patients with two-digit numbers from 01 to 60, use a random number table, reading off two digits at a time, ignoring repeats, 00, and numbers over 60, until 30 unique numbers have been selected.) The 30 patients corresponding to the 30 selected integers will be given the cryotherapy treatment. (A third design would be to put the 60 names on identical slips of paper, put the slips in a hat, mix them well, and then pick out 30 slips, without replacement, with the corresponding names given cryotherapy.) The remaining 30 patients will receive the duct tape treatment. At the end of the treatment schedules, compare the proportion of each group that had complete resolution of the warts being studied.
Placebo Effect - It is a fact that many people respond to any kind of perceived treatment. (For example, when given a sugar pill after surgery but told that it is a strong pain reliever, many people feel immediate relief from their pain.)
Blinding - occurs when the subjects don’t know which of the different treatments (such as placebos) they are receiving.
Double-blinding - is when neither the subjects nor the response evaluators know who is receiving which treatment.
➥ Example 3.9
There is a pressure point on the wrist that some doctors believe can be used to help control the nausea experienced following certain medical procedures. The idea is to place a band containing a small marble firmly on a patient’s wrist so that the marble is located directly over the pressure point. Describe how a double-blind experiment might be run on 50 postoperative patients.
Solution: Assign each patient a number from 1 to 50. Use a random integer generator on a calculator to pick integers between 1 and 50, ignoring repeats, until 25 unique integers have been selected. (Or numbering the patients with two-digit numbers from 01 to 50, from a random number table read off two digits at a time, throwing away repeats, 00, and numbers over 50, until 25 unique numbers have been selected.) Put wristbands with marbles over the pressure point on the patients with these assigned numbers. (A third experimental design would be to put the 50 names on identical slips of paper, put the slips in a hat, mix them well, and then pick out 25 slips, without replacement, with the corresponding names given wristbands with marbles over the pressure point.) Put wristbands with marbles on the remaining patients also, but not over the pressure point. Have a researcher check by telephone with all 50 patients at designated time intervals to determine the degree of nausea being experienced. Neither the patients nor the researcher on the telephone should know which patients have the marbles over the correct pressure point.
A matched pairs design (also called a paired comparison design) - is when two treatments are compared based on the responses of paired subjects, one of whom receives one treatment while the other receives the second treatment. Often the paired subjects are really single subjects who are given both treatments, one at a time in random order.
Replication and Generalizability of Results
One important consideration is the size of the sample: the larger the sample, the more significant the observation. This is the principle of replication. In other words, the treatment should be repeated on a sufficient number of subjects so that real response differences are more apparent.
Replication - refers to having more than one experimental unit in each treatment group, not multiple trials of the same experiment.
Randomization - is critical to minimize the effect of confounding variables. However, in order to generalize experimental results to a larger population (as we try to do in sample surveys), it would also be necessary that the group of subjects used in the experiment be randomly selected from the population.
Inference and Experiments
If the treatments make no difference, just by chance there probably will be some variation.
Something is statistically significant if the probability of it happening just by chance is so small that you’re convinced there must be another explanation.
➥ Example 3.10
Sixty students volunteered to participate in an experiment comparing the effects of coffee, caffeinated cola, and herbal tea on pulse rates. Twenty students are randomly assigned to each of the three treatments. For each student, the change in pulse rate was measured after consuming eight ounces of the treatment beverage. The results are summarized with the parallel boxplots below.
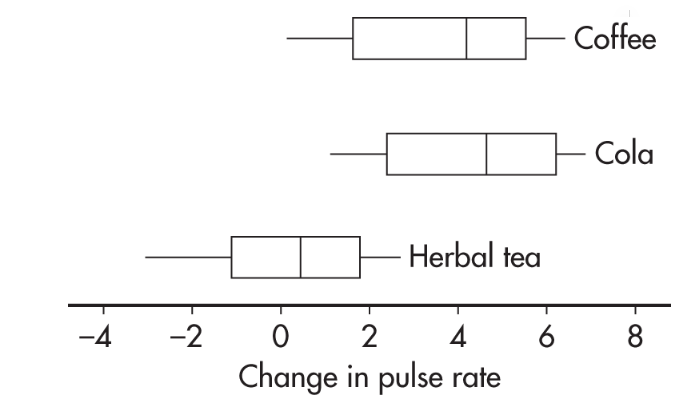
What are reasonable conclusions?
Answer: The median change in pulse rate for the cola drinkers was higher than that for the coffee drinkers; however, looking at the overall spreads, that observed difference does not seem significant. The difference between the coffee and caffeinated cola drinkers with respect to change in pulse rate is likely due to random chance. Now compare the coffee and caffeinated cola drinkers’ results to that of the herbal tea drinkers. While there is some overlap, there is not much. It seems reasonable to conclude the difference is statistically significant; that is, drinking coffee or caffeinated cola results in a greater rise in pulse rate than drinking herbal tea.