Many species of corals are threatened by the increasing temperatures and decreasing pH of ocean waters. One species, Stylophora pistillata, has been found to thrive in water that is warmer and has a lower pH than the water that corals typically thrive in. Additionally, researchers have found that the tolerance for the new water conditions is heritable.
Which of the following statements best explains the changes seen in S. pistillata in response to the changing water conditions?
A: The corals’ adaptation is an example of natural selection because the tolerance is in response to a changing environment and has a genetic basis.
B: The corals’ adaptation is an example of the founder effect because the majority of corals do not have a tolerance for warmer water.
C: The corals’ adaptation is an example of genetic drift because the change was a chance event and not the result of selection in response to environmental change.
D: The corals’ adaptation is an example of adaptive radiation because it has resulted in a wide range of species adapting to the new ocean conditions.
A: The corals’ adaptation is an example of natural selection because the tolerance is in response to a changing environment and has a genetic basis.
A researcher measured the temperature at which two different samples of double-stranded DNA denature (separate into single strands). Sample 1 denatured at a significantly lower temperature than sample 2 did. Based on the data, the researcher claims that the DNA in sample 2 is composed of a higher percentage of guanine and cytosine than the DNA in sample 1 is.
Which of the following best supports the researcher’s claim?
A: The bonds between guanine and cytosine are covalent bonds, which require more energy to disrupt than those between adenine and thymine.
B: Guanine-cytosine pairs denature at a higher temperature because they have more hydrogen bonds between them than adenine-thymine pairs do.
C: Adenine-thymine pairs require less energy to separate because adenine and thymine are both single-ring bases.
D: Guanine-cytosine pairs require more energy to separate because one is a purine and one is a pyrimidine.
B: Guanine-cytosine pairs denature at a higher temperature because they have more hydrogen bonds between them than adenine-thymine pairs do.
Researchers studying the bacterium Escherichia coli split a population of the bacteria into two samples. Sample 1 was transformed with a plasmid containing a gene that makes the bacteria resistant to the antibiotic kanamycin. Sample 2 was transformed with a plasmid lacking the antibiotic resistance gene. A portion of each sample was then added to growth plates containing just nutrients or growth plates containing nutrients and kanamycin.
After being allowed to grow for 24 hours at 37∘C, the number of colonies on each growth plate was counted (Table 1).
TABLE 1. BACTERIAL GROWTH FOLLOWING TRANSFORMATION WITH ORWITHOUT THE KANAMYCIN RESISTANCE GENE |
Plate # | Transforming Plasmid Contains Kanamycin Resistance Gene | Growth Media | Results |
1 | No | Nutrient only | Too many colonies to count (lawn) |
2 | Yes | Nutrient only | Too many colonies to count (lawn) |
3 | No | Nutrient with antibiotic | No colonies observed |
4 | Yes | Nutrient with antibiotic | 7 colonies observed |
Which of the following claims is best supported by the data in Table 1 ?
A: The transformation procedure killed all the bacteria that were added to plate 3.
B: More bacteria on plates 1 and 2 were successfully transformed than on any other plate.
C: None of the bacteria on plate 2 were successfully transformed with the kanamycin resistance gene.
D: Only the bacteria that were successfully transformed with the kanamycin resistance gene grew on plate 4.
D: Only the bacteria that were successfully transformed with the kanamycin resistance gene grew on plate 4.
he fertilization of ovules from plant Q by pollen from plant R results in the production of seeds. What percent of the genes in each offspring’s chloroplasts will have been inherited from plant R?
Responses
A: 0%
B: 25%
C: 50%
D: 100%
A: 0%
High levels of certain plant nutrients in runoff can lead to rapid growth of algae (an algal bloom) in aquatic ecosystems. These algal blooms are generally followed by algal death and decomposition, which consumes large amounts of dissolved oxygen in the water and results in oxygen levels insufficient to support aerobic respiration. This process is known as eutrophication. The amount of algae present in a body of water can be estimated from the amount of chlorophyll a in a sample of the water. A researcher studying eutrophication collected samples at different times of the year in a freshwater ecosystem. The samples were analyzed for total nitrogen and chlorophyll a concentration (Figure 1) as well as total phosphorus and chlorophyll a concentration (Figure 2).
|
|
Figure 1. Amount of chlorophyll a in relation to the amount of total nitrogen | Figure 2. Amount of chlorophyll a in relation to the amount of total phosphorous |
Which of the following best explains how higher concentrations of nitrogen and phosphorus contribute to eutrophication?
A: An increase in the population of algae results in more nitrogen and phosphorus in the water, causing severe eutrophication.
B: Both bacteria and algae require nitrogen and phosphorus, so the algae must grow faster to compete with bacteria.
C: Nitrogen and phosphorus stimulate oxidative phosphorylation, which consumes the available oxygen in the water.
D: Algae require nitrogen and phosphorus to build macromolecules, so higher concentrations of these nutrients can result in algal blooms.
D: Algae require nitrogen and phosphorus to build macromolecules, so higher concentrations of these nutrients can result in algal blooms.
High levels of certain plant nutrients in runoff can lead to rapid growth of algae (an algal bloom) in aquatic ecosystems. These algal blooms are generally followed by algal death and decomposition, which consumes large amounts of dissolved oxygen in the water and results in oxygen levels insufficient to support aerobic respiration. This process is known as eutrophication. The amount of algae present in a body of water can be estimated from the amount of chlorophyll a in a sample of the water. A researcher studying eutrophication collected samples at different times of the year in a freshwater ecosystem. The samples were analyzed for total nitrogen and chlorophyll a concentration (Figure 1) as well as total phosphorus and chlorophyll a concentration (Figure 2).
|
|
Figure 1. Amount of chlorophyll a in relation to the amount of total nitrogen | Figure 2. Amount of chlorophyll a in relation to the amount of total phosphorous |
Which of the following was the dependent variable in the researcher’s study?
A: The concentration of chlorophyll a
B: The concentration of total nitrogen and phosphorus
C: The slope of the trend line showing the rate of change
D: The variance of the data points from the trend line
A: The concentration of chlorophyll a
High levels of certain plant nutrients in runoff can lead to rapid growth of algae (an algal bloom) in aquatic ecosystems. These algal blooms are generally followed by algal death and decomposition, which consumes large amounts of dissolved oxygen in the water and results in oxygen levels insufficient to support aerobic respiration. This process is known as eutrophication. The amount of algae present in a body of water can be estimated from the amount of chlorophyll a in a sample of the water. A researcher studying eutrophication collected samples at different times of the year in a freshwater ecosystem. The samples were analyzed for total nitrogen and chlorophyll a concentration (Figure 1) as well as total phosphorus and chlorophyll a concentration (Figure 2).
|
|
Figure 1. Amount of chlorophyll a in relation to the amount of total nitrogen | Figure 2. Amount of chlorophyll a in relation to the amount of total phosphorous |
Which of the following describes the relationship between the amount of chlorophyll a in a water sample and the concentration of nitrogen in that sample?
A: As the concentration of chlorophyll a increases, the concentration of nitrogen decreases.
B: The concentrations of nitrogen and chlorophyll a are directly correlated.
C: The concentrations of chlorophyll a and nitrogen increase throughout the year.
D: There is no relationship between the concentrations of chlorophyll a and nitrogen.
B: The concentrations of nitrogen and chlorophyll a are directly correlated.
High levels of certain plant nutrients in runoff can lead to rapid growth of algae (an algal bloom) in aquatic ecosystems. These algal blooms are generally followed by algal death and decomposition, which consumes large amounts of dissolved oxygen in the water and results in oxygen levels insufficient to support aerobic respiration. This process is known as eutrophication. The amount of algae present in a body of water can be estimated from the amount of chlorophyll a in a sample of the water. A researcher studying eutrophication collected samples at different times of the year in a freshwater ecosystem. The samples were analyzed for total nitrogen and chlorophyll a concentration (Figure 1) as well as total phosphorus and chlorophyll a concentration (Figure 2).
|
|
Figure 1. Amount of chlorophyll a in relation to the amount of total nitrogen | Figure 2. Amount of chlorophyll a in relation to the amount of total phosphorous |
Which of the following investigations would enable researchers to test the claim that an increased concentration of algae has a negative effect on the number of aquatic invertebrates in the ecosystem?
A: Examining the contents of the digestive tracts of aquatic invertebrates and looking for the presence of algae
B: Examining the growth rate of algae in the absence of aquatic invertebrates
C: Counting the number of aquatic invertebrates at different concentrations of chlorophyll a in the water
D: Counting the number of aquatic invertebrates at different concentrations of nitrogen and phosphorus in the water
C: Counting the number of aquatic invertebrates at different concentrations of chlorophyll a in the water
Amylase is an enzyme that converts carbohydrate polymers into monomers. Glycogen synthase is one of the enzymes involved in converting carbohydrate monomers into polymers.
Which of the following best explains the reactions of these enzymes?
A: Amylase aids in the removal of a water molecule to break covalent bonds whereas glycogen synthase aids in the addition of a water molecule to form covalent bonds.
B: Amylase aids in the addition of a water molecule to break covalent bonds whereas glycogen synthase aids in the removal of a water molecule to form covalent bonds.
C: Amylase aids in the addition of a water molecule to form covalent bonds whereas glycogen synthase aids in the removal of a water molecule to break covalent bonds.
D: Amylase aids in the removal of a water molecule to form covalent bonds whereas glycogen synthase aids in the addition of a water molecule to break covalent bonds.
B: Amylase aids in the addition of a water molecule to break covalent bonds whereas glycogen synthase aids in the removal of a water molecule to form covalent bonds.
Which of the following describes the most likely location of cholesterol in an animal cell?
A: Embedded in the plasma membrane
B: Dissolved in the cytosol
C: Suspended in the stroma of the chloroplast
D: Bound to free ribosomes
A: Embedded in the plasma membrane
Lactase is the enzyme needed to digest lactose, the sugar found in milk. Most mammals produce lactase when they are young but stop once nursing ends. In humans however, many people continue to produce lactase into adulthood and are referred to as lactase-persistent.
Which of the following mutations is most likely to cause lactase persistence in humans?
A: A nucleotide substitution in the coding region of the lactase gene that interferes with the interaction between lactase and lactose
B: A mutation that turns off the expression of transcription factors that activate the expression of lactase
C: A mutation that increases the binding of transcription factors to the promoter of the lactase gene
D: The insertion of a single nucleotide into the lactase gene that results in the formation of a stop codon
C: A mutation that increases the binding of transcription factors to the promoter of the lactase gene
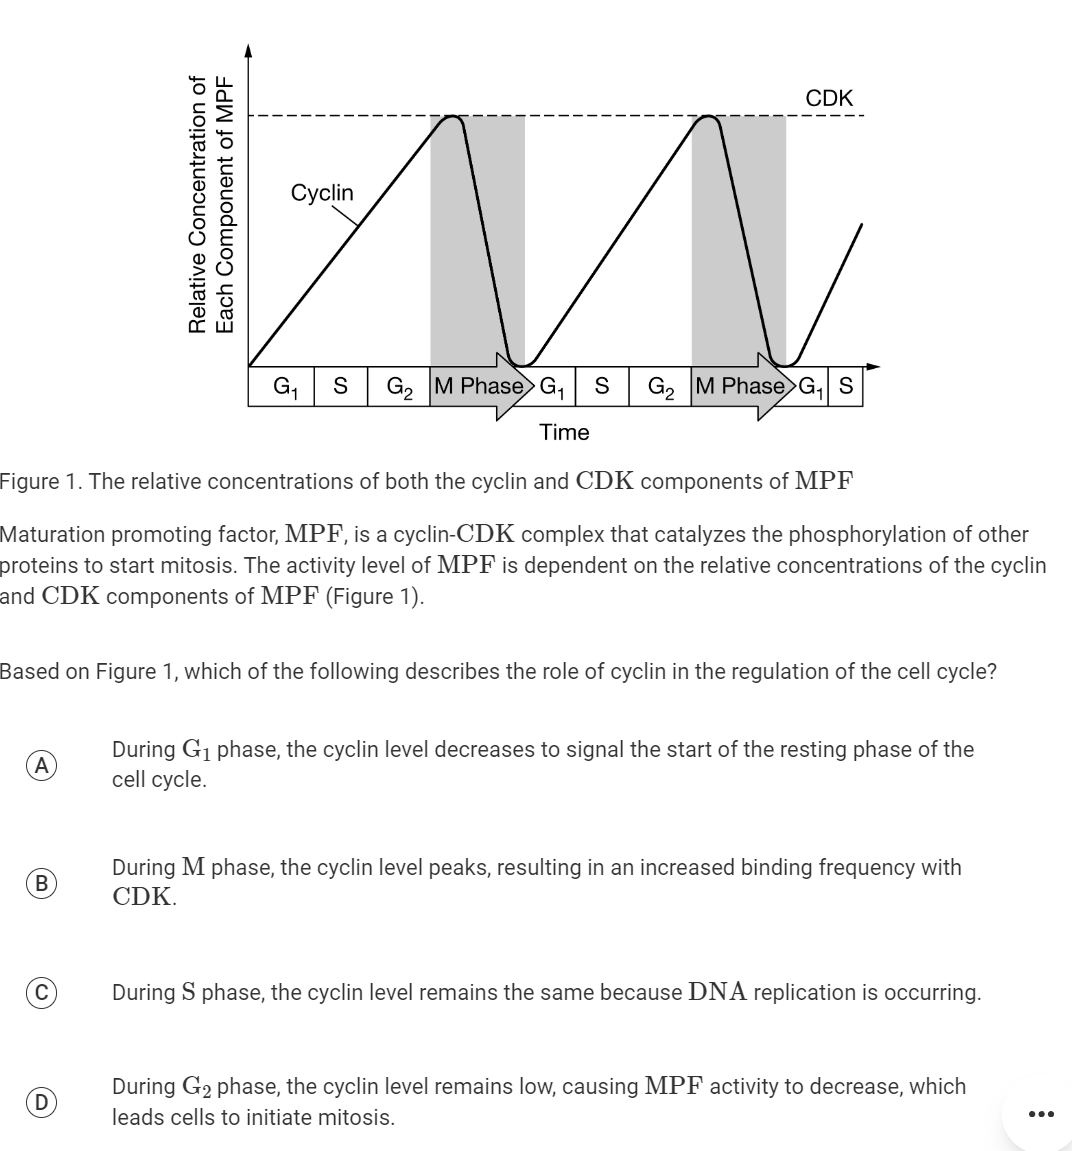
B: During M phase, the cyclin level peaks, resulting in an increased binding frequency with CDK.
Modern bananas originated from a cross between a tetraploid banana species and a diploid banana species. The product of this cross was the triploid Cavendish banana strain, a sterile hybrid that is only grown asexually. Recently, the Panama fungus has been observed more frequently parasitizing the Cavendish banana, and scientists claim that this type of banana is on the brink of extinction.
Which of the following provides the best explanation of the scientists’ claim regarding the threat to the Cavendish banana?
A: The triploid genome of the Cavendish banana makes it susceptible to the negative impact of recessive alleles.
B: Having three of each chromosome interferes with normal function of the cells and increases the likelihood of contracting a disease.
C: The lack of genetic diversity of the Cavendish banana decreases the chance that a variation exists in the population that is immune to the fungus.
D: sexual reproduction increases the mutation rate during replication, resulting in a greater chance that the offspring have a dysfunctional immune system.
C: The lack of genetic diversity of the Cavendish banana decreases the chance that a variation exists in the population that is immune to the fungus.
Belding’s ground squirrels (Spermophilus beldingi) live in closely related groups. When they feed in the open, certain individuals (guard squirrels) watch for predators instead of feeding. The guard squirrels give an alarm call when a predator is sighted, allowing the rest of the group to run to safety. Researchers have noted that, because the alarm call draws attention to the guard, the guard is more likely to be caught by the predator and therefore has a lower survival rate in comparison with the other squirrels.
Which of the following best explains the behavior of the guard squirrels?
A: The behavior of the guard squirrels increases the survival of close relatives that share the genes of the guard squirrels.
B: The guard squirrels confuse the predator, lowering the predator’s success rate because the predator cannot tell which squirrel is producing the sound.
C: Guard squirrels typically have recessive alleles, and by sacrificing themselves, they lessen the chance that recessive alleles will get passed on.
D: Guard squirrels are typically females who have already reproduced, so they are no longer needed by the group.
A: The behavior of the guard squirrels increases the survival of close relatives that share the genes of the guard squirrels.
If 30% of the nucleotides in a single-stranded RNA molecule are adenine, then what percent are expected to be thymine?
A: 0%
B: 20%
C: 30%
D: 70%
A: 0%
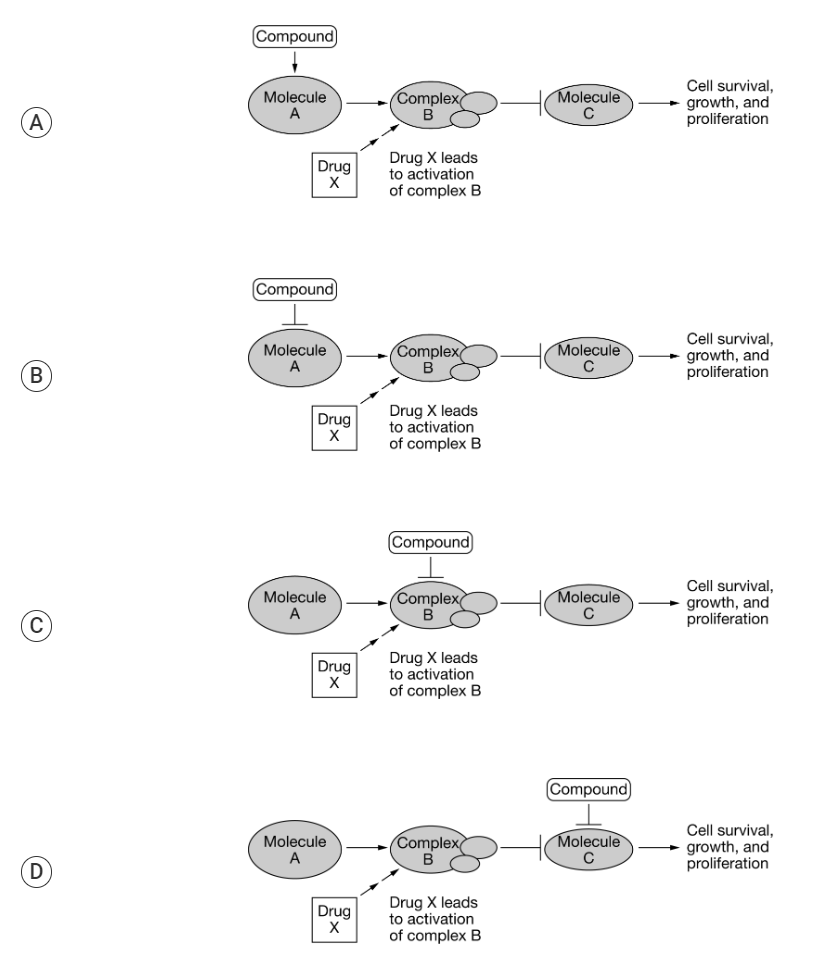
Melanocytes are skin cells that can become cancerous and develop into a cancer known as melanoma. Some cancerous melanocytes have developed resistance to the drugs currently used to treat melanoma. As a result, researchers are investigating the effects of a new compound (drug X) on four different melanoma cell lines. Researchers analyzed cell survival in two cell lines (Figure 1) and oxygen consumption in the presence of drug X in all four cell lines (Figure 2). Figure 3 shows the proposed mechanism by which drug X affects cells.

Figure 1. Percent survival of normal melanocytes and cancerous melanocyte (melanoma) lines 1 and 2 after treatment with different concentrations of drug X

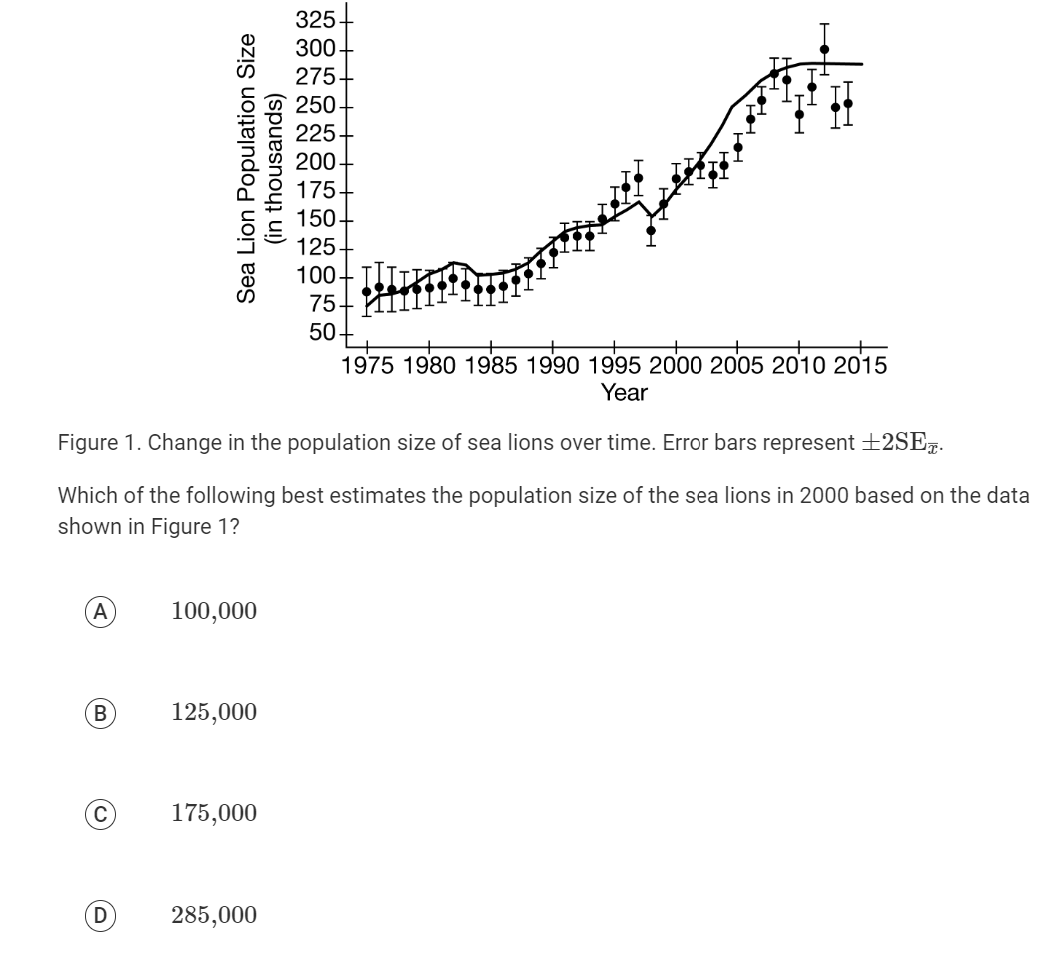
Figure 2. Oxygen consumption per cell in four melanoma lines after treatment with either solvent alone or solvent containing drug X. Error bars represent ±2SE𝑥¯.

Figure 3. Pathway leading to cell survival, growth, and proliferation and the likely effect of drug X
Which of the following best describes the data in Figure 1 ?
A: As the concentration of drug X increases, there is an increase in melanoma cell survival.
B: At a concentration above μ10 𝜇M, drug X reduces melanoma cell survival.
C: At a concentration below μ25 𝜇M, drug X increases survival in all melanoma cell lines.
D: At a concentration of μ25 𝜇M, drug X has a greater effect on melanoma line 1 than on melanoma line 2.
B: At a concentration above μ10 𝜇M, drug X reduces melanoma cell survival.
Melanocytes are skin cells that can become cancerous and develop into a cancer known as melanoma. Some cancerous melanocytes have developed resistance to the drugs currently used to treat melanoma. As a result, researchers are investigating the effects of a new compound (drug X) on four different melanoma cell lines. Researchers analyzed cell survival in two cell lines (Figure 1) and oxygen consumption in the presence of drug X in all four cell lines (Figure 2). Figure 3 shows the proposed mechanism by which drug X affects cells.
Figure 1. Percent survival of normal melanocytes and cancerous melanocyte (melanoma) lines 1 and 2 after treatment with different concentrations of drug X
Figure 2. Oxygen consumption per cell in four melanoma lines after treatment with either solvent alone or solvent containing drug X. Error bars represent ±2SE𝑥¯.
Figure 3. Pathway leading to cell survival, growth, and proliferation and the likely effect of drug X
Based on Figure 2, which of the following best supports the claim that drug X inhibits oxygen consumption?
A: n the absence of drug X, melanoma lines 1 and 4 consume similar amounts of oxygen.
B: In the presence of drug X, melanoma line 2 consumes statistically more oxygen per cell than does melanoma line 3.
C: Melanoma line 3 consumes statistically less oxygen per cell in the presence of drug X than it does in the presence of the solvent alone.
D: Melanoma line 2 in the presence of drug X consumes statistically less oxygen than does melanoma line 4 in the absence of drug X.
C: Melanoma line 3 consumes statistically less oxygen per cell in the presence of drug X than it does in the presence of the solvent alone.
Melanocytes are skin cells that can become cancerous and develop into a cancer known as melanoma. Some cancerous melanocytes have developed resistance to the drugs currently used to treat melanoma. As a result, researchers are investigating the effects of a new compound (drug X) on four different melanoma cell lines. Researchers analyzed cell survival in two cell lines (Figure 1) and oxygen consumption in the presence of drug X in all four cell lines (Figure 2). Figure 3 shows the proposed mechanism by which drug X affects cells.
Figure 1. Percent survival of normal melanocytes and cancerous melanocyte (melanoma) lines 1 and 2 after treatment with different concentrations of drug X
Figure 2. Oxygen consumption per cell in four melanoma lines after treatment with either solvent alone or solvent containing drug X. Error bars represent ±2SE𝑥¯.
Figure 3. Pathway leading to cell survival, growth, and proliferation and the likely effect of drug X
Based on the information presented, which of the following best explains why the researchers measured oxygen consumption as an indicator of the effectiveness of drug X?
A: Oxygen provides the source of electrons for cellular respiration and is necessary for energy production.
B: Oxygen consumption increases the mutation rate and causes cells to become cancerous.
C: Oxygen activates apoptosis, which results in the death of melanoma cells.
D: Oxygen accepts electrons in oxidative phosphorylation, a process necessary for melanoma cell survival.
D: Oxygen accepts electrons in oxidative phosphorylation, a process necessary for melanoma cell survival.
Melanocytes are skin cells that can become cancerous and develop into a cancer known as melanoma. Some cancerous melanocytes have developed resistance to the drugs currently used to treat melanoma. As a result, researchers are investigating the effects of a new compound (drug X) on four different melanoma cell lines. Researchers analyzed cell survival in two cell lines (Figure 1) and oxygen consumption in the presence of drug X in all four cell lines (Figure 2). Figure 3 shows the proposed mechanism by which drug X affects cells.
Figure 1. Percent survival of normal melanocytes and cancerous melanocyte (melanoma) lines 1 and 2 after treatment with different concentrations of drug X
Figure 2. Oxygen consumption per cell in four melanoma lines after treatment with either solvent alone or solvent containing drug X. Error bars represent ±2SE𝑥¯.
Figure 3. Pathway leading to cell survival, growth, and proliferation and the likely effect of drug X
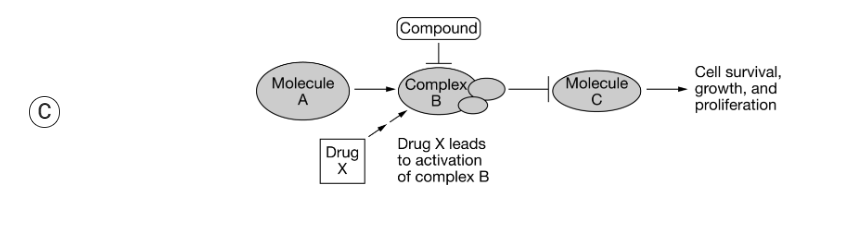
A researcher has identified a compound that reverses the effect of drug X. Based on Figure 3, which of the following best explains how the compound acts in the pathway to reverse the effects of drug X?
Which of the following best explains how molecules such as O2 and CO2 can move across the membrane of a cell?
A: The majority of the cell membrane contains protein channels that allow this type of molecule into the cell.
B: The majority of the cell membrane is nonpolar, which allows small, nonpolar molecules to freely cross.
C: The phospholipids of the membrane are tightly packed, so only small molecules and ions can fit between phospholipids.
D: ATP is hydrolyzed to provide energy to help O2 and CO2 move against their concentration gradient and across the membrane.
B: The majority of the cell membrane is nonpolar, which allows small, nonpolar molecules to freely cross.
Scientists investigated the effect of oxygen levels on the net rate of carbon fixation in two types of plants. The plants were grown in either well-watered soil (control) or dry soil and then exposed to either 21% or 1% O2. The net rate of CO2 fixation for both types of plants was measured. Data are shown in Figure 1 and Figure 2.
|
|
Figure 1. Net rate of CO2 fixation in two typesof plants grown in wet (control) or dry soilat 21% O2 | Figure 2. Net rate of CO2 fixation in two typesof plants grown in wet (control) or dry soil at1% O2 |
Which of the following statements about the rate of CO2 fixation in the two types of plants is supported by the data shown in the figures?
A: At 21% O2, plant type 2 has a lower rate of CO2 fixation than plant type 1 does in both types of soil.
B: At 1% 𝑂2, plant type 2 has a higher rate of CO2 fixation than plant type 1 does in the dry soil but not in the control soil.
C: Plant types 1 and 2 have a statistically different rate of CO2 fixation in both soil types at both oxygen levels.
D: The rate of CO2 fixation is the same in both types of plants in the control soil at both oxygen levels.
A: At 21% O2, plant type 2 has a lower rate of CO2 fixation than plant type 1 does in both types of soil.
A researcher is conducting an experiment in which cells in different phases of the cell cycle are fused together. The researcher then records what happens to the nuclei of the resulting cell (Table 1).
TABLE 1. COMBINATIONS OF CELLS THAT WERE FUSED AND THE PHASE OF NUCLEI IN THE RESULTING CELL
Phase of Cell 1 | Phase of Cell 2 | Phase of Nuclei in Resulting Cell |
S phase | G1 phase | Two S-phase nuclei |
S phase | G2 phase | One S-phase nucleus and one G2-phase nucleus |
G1 phase | G2 phase | One G1-phase nucleus and one G2-phase nucleus |
Interphase | M phase | Two M-phase nuclei |
Which of the following research questions is best addressed by the experiment?
A: How do chemical messengers affect a cell’s transition between the phases of the cell cycle?
B: How does the number of chromosomes affect when a cell transitions to the next phase of the cell cycle?
C: How does the amount of genetic information change throughout the cell cycle?
D: How does the checkpoint at G2 serve to prevent the transmission of mutations?
A: How do chemical messengers affect a cell’s transition between the phases of the cell cycle?
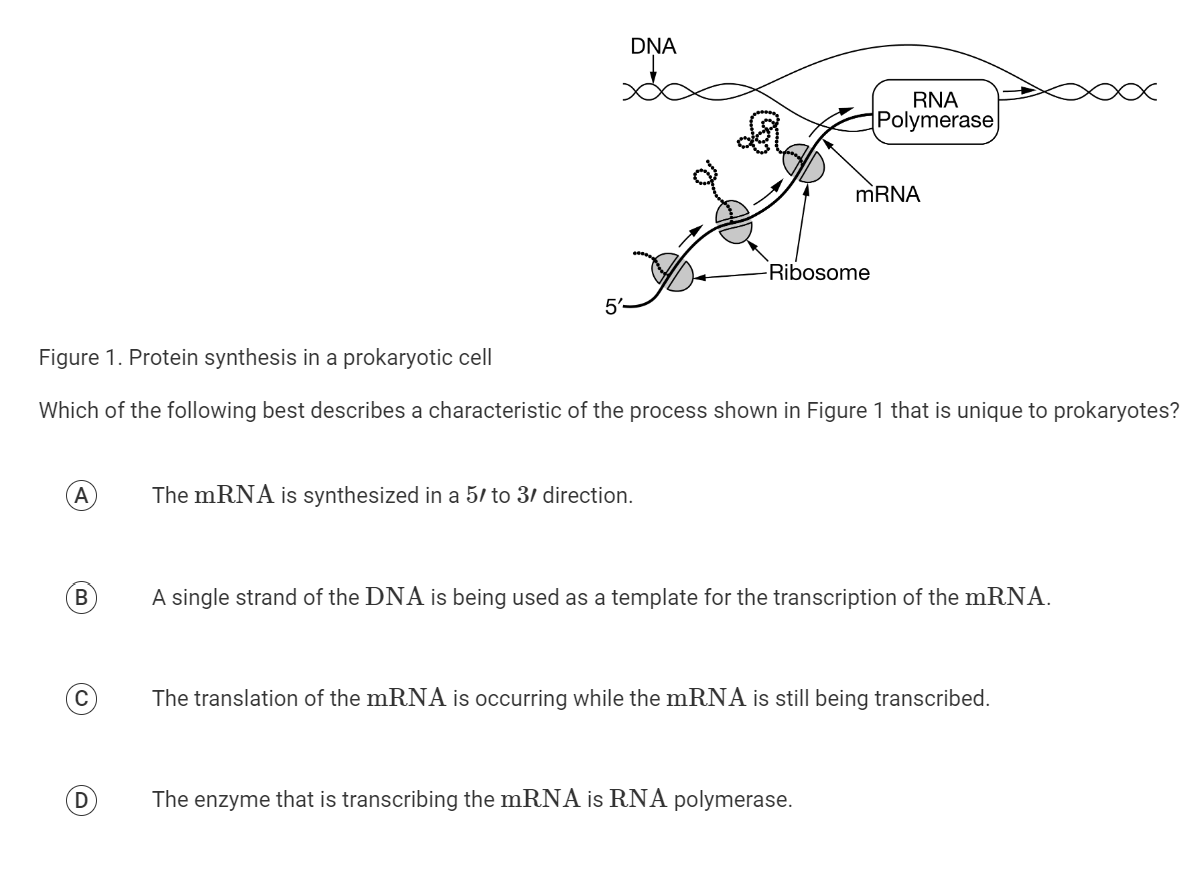
C: The translation of the mRNA is occurring while the mRNA is still being transcribed.
A scientist is investigating the possibility that two traits in a particular plant are determined by genes that are on the same chromosome. The scientist crossed a plant that is homozygous dominant for both traits with a plant that is homozygous recessive for both traits. The heterozygous offspring in the F1 generation were then crossed with a plant that is homozygous recessive for both traits. The results expected if the genes independently assort and the observed results are presented in the table.
Phenotype | Expected Number in 𝐹2 | Observed Number in 𝐹2 |
Long stems, white flowers | 25 | 17 |
Short stems, red flowers | 25 | 19 |
Long stems, red flowers | 25 | 31 |
Short stems, white flowers | 25 | 33 |
Total number of plants | 100 | 100 |
Which of the following critical values should the scientist use for the chi-square analysis of the data?
A: 3.00
B: 3.84
C: 7.81
D: 8,00
C: 7.81
Sugar gliders and Northern flying squirrels are mammals that have many morphological similarities despite being genetically different. Both are nocturnal and have large eyes to help them see in the dark. Both live in trees and have flaps of skin connecting their front and back legs, and when their front and back legs are extended, the flaps allow the animals to glide from one tree branch to another. Sugar gliders are native to Australia, and Northern flying squirrels are native to North America.
Which of the following best explains the morphological similarities between these two species?
A: The similarities in traits indicate the species are the result of divergent evolution from a common ancestor that had the same traits that these two species share.
B: The traits evolved through sympatric speciation, which often results in species being highly similar because they evolve in the same area.
C: The two species evolved as the result of two separate bottleneck events that reduced the existing populations to a few individuals who happened to have the same traits.
D: The similarities between the species evolved independently as a result of similar selective pressures in each species’ environment.
D: The similarities between the species evolved independently as a result of similar selective pressures in each species’ environment.
C: 175,000
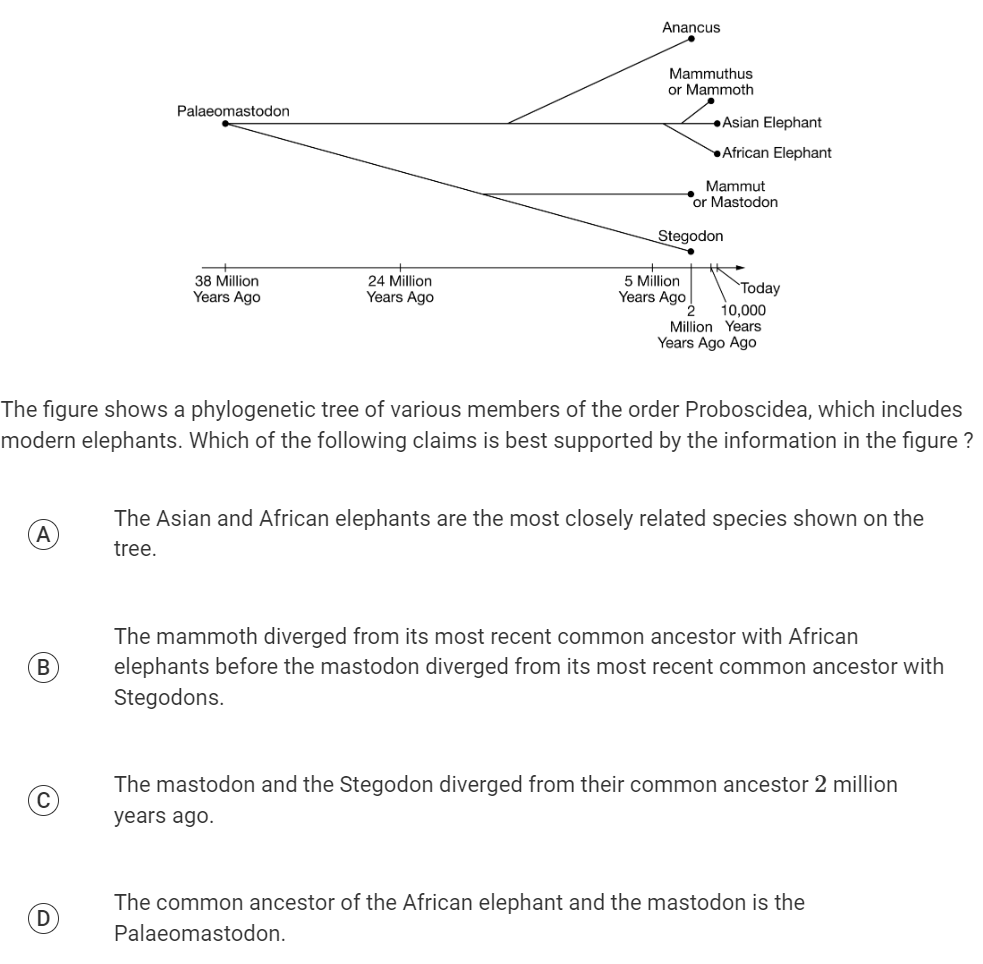
D: The common ancestor of the African elephant and the mastodon is the Palaeomastodon.
Which of the following describes the most direct effect of a mutation in the DNA that encodes a cell’s rRNA?
A: The cell’s ability to transport the amino acids needed for translation will be reduced.
B: The cell’s ability to transcribe RNA transcripts that will be translated will be reduced.
C: The cell’s ability to properly assemble ribosomes and initiate translation will be reduced.
D: The cell’s ability to modify proteins after they have been assembled will be reduced.
C: The cell’s ability to properly assemble ribosomes and initiate translation will be reduced.
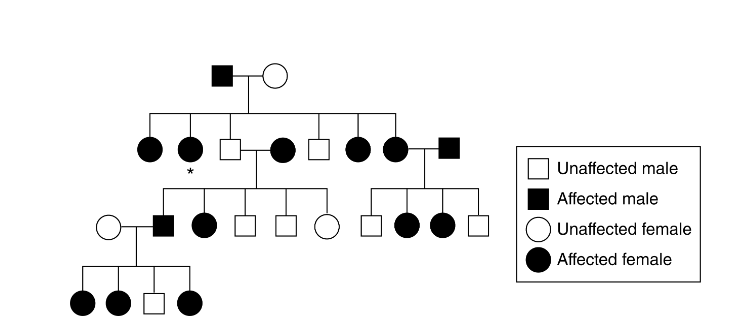
Figure 1. Incidence of protoporphyria in a particular family
Protoporphyria is a genetic disorder characterized by an extreme sensitivity to sunlight. One form of protoporphyria is caused by a mutation in the 𝐴𝐿𝐴𝑆2 gene that results in the accumulation of protoporphyrin, an organic compound, in the blood, liver, and skin. The pedigree in Figure 1 shows the incidence of protoporphyria in a particular family.
Which of the following best describes the genotype of the individual identified with an asterisk in the pedigree in Figure 1 ?
A: Two dominant 𝐴𝐿𝐴𝑆2 alleles
B: Two recessive 𝐴𝐿𝐴𝑆2 alleles
C: One dominant 𝐴𝐿𝐴𝑆2 allele and one recessive 𝐴𝐿𝐴𝑆2 allele
D: One recessive 𝐴𝐿𝐴𝑆2 allele and no second allele for the 𝐴𝐿𝐴𝑆2 gene
C: One dominant 𝐴𝐿𝐴𝑆2 allele and one recessive 𝐴𝐿𝐴𝑆2 allele
Figure 1. Incidence of protoporphyria in a particular family
Protoporphyria is a genetic disorder characterized by an extreme sensitivity to sunlight. One form of protoporphyria is caused by a mutation in the 𝐴𝐿𝐴𝑆2 gene that results in the accumulation of protoporphyrin, an organic compound, in the blood, liver, and skin. The pedigree in Figure 1 shows the incidence of protoporphyria in a particular family.
Which of the following best describes the inheritance pattern illustrated in Figure 1 ?
A: Protoporphyria has an autosomal recessive inheritance pattern.
B: Protoporphyria has an X-linked dominant inheritance pattern.
C: Protoporphyria has an X-linked recessive inheritance pattern.
D: Protoporphyria has a mitochondrial inheritance pattern.
B: Protoporphyria has an X-linked dominant inheritance pattern.
Figure 1. Incidence of protoporphyria in a particular family
Protoporphyria is a genetic disorder characterized by an extreme sensitivity to sunlight. One form of protoporphyria is caused by a mutation in the 𝐴𝐿𝐴𝑆2 gene that results in the accumulation of protoporphyrin, an organic compound, in the blood, liver, and skin. The pedigree in Figure 1 shows the incidence of protoporphyria in a particular family.
One mutation in 𝐴𝐿𝐴𝑆2 that is associated with protoporphyria is a four-nucleotide deletion. The protein expressed from the mutant allele is 20 amino acids shorter than the wild-type protein.
Which of the following best explains why a shortened protein is produced?
A: The mutation disrupts the start codon, preventing the ribosome from beginning translation.
B: The mutation introduces a premature stop codon, causing translation to end early.
C: The mutation changes the gene’s regulatory region, causing unregulated gene expression.
D: The mutation affects posttranscriptional modifications by preventing the removal of introns.
B: The mutation introduces a premature stop codon, causing translation to end early.
Figure 1. Incidence of protoporphyria in a particular family
Protoporphyria is a genetic disorder characterized by an extreme sensitivity to sunlight. One form of protoporphyria is caused by a mutation in the 𝐴𝐿𝐴𝑆2 gene that results in the accumulation of protoporphyrin, an organic compound, in the blood, liver, and skin. The pedigree in Figure 1 shows the incidence of protoporphyria in a particular family.
A researcher claims that an individual has protoporphyria, based on a physical exam. Which of the following techniques would most likely confirm the researcher’s claim?
A: Transforming bacteria with the mutant variation of 𝐴𝐿𝐴𝑆2 to measure gene expression
B: Culturing cells from the individual in the lab and measuring the cells’ growth rate
C: Using light microscopy to examine the individual’s chromosomes during metaphase
D: Determining the nucleotide sequence of the individual’s 𝐴𝐿𝐴𝑆2 alleles
D: Determining the nucleotide sequence of the individual’s 𝐴𝐿𝐴𝑆2 alleles
Which of the following is evidence that eukaryotes and prokaryotes share a common ancestor?
A: All eukaryotes and prokaryotes contain linear DNA.
B: All eukaryotes and prokaryotes contain ribosomes.
C: All eukaryotes and prokaryotes use organic molecules as an energy source.
D: All eukaryotes and prokaryotes are capable of mitosis.
B: All eukaryotes and prokaryotes contain ribosomes.
Wolves, once native to Yellowstone National Park, were hunted to the point of complete extinction in the park. As a result, the elk population in the park flourished, putting extra demands on the carrying capacity of the park. Many other species, such as certain trees and beavers, were negatively affected by the increase in elk.
Years later, wolves were reintroduced into the park. While the elk population decreased after the wolves returned, the beaver and songbird populations began to increase as did the populations of various plant species.
Which of the following best explains how wolves are a keystone species in this ecosystem?
A: Wolves help balance the population sizes of other species, allowing more species to thrive in the wolves’ presence than in their absence.
B: Wolves prey on certain species, increasing competition among other species, which results in a decrease in biodiversity in the ecosystem.
C: Wolves are not affected by factors that typically limit the population size; therefore their population can grow exponentially, increasing the demand on the parks’ resources.
D: Wolves prey on other species without having any natural predators themselves; therefore their presence significantly decreases many populations within the community.
A: Wolves help balance the population sizes of other species, allowing more species to thrive in the wolves’ presence than in their absence.
Figure 1. A model of epinephrine signaling
Two types of cells, alpha and beta cells, produce signaling molecules that affect blood sugar levels in opposite ways (Figure 1). Epinephrine is a chemical, often released during periods of exercise, that ultimately causes an increase in blood sugar levels in the body.
Based on Figure 1, which of the following best explains how exercise causes blood glucose levels to rise?
A: Epinephrine inhibits alpha cells, causing the release of glucagon, and activates beta cells, blocking the release of insulin.
B: Epinephrine activates alpha cells, blocking the release of glucagon, and inhibits beta cells, causing the release of insulin.
C: Epinephrine activates alpha cells, causing the release of glucagon, and inhibits beta cells, blocking the release of insulin.
D: Epinephrine activates alpha cells, causing the release of glucagon, and inhibits beta cells, blocking the release of insulin.
C: Epinephrine activates alpha cells, causing the release of glucagon, and inhibits beta cells, blocking the release of insulin.
Pesticides are chemicals that are often sprayed on crops to kill plant-eating insects, preventing damage to the crops. While pesticides are effective initially, many researchers claim that any single pesticide will see reduced effectiveness in as little as ten to fifteen years.
Which of the following best supports the claim by scientists that the pesticides will eventually lose their effectiveness?
A: Insects will evolve to avoid any plant sprayed with pesticides to increase their chances of survival.
B: Insects that are naturally resistant to the pesticide will survive and reproduce more than the insects that are sensitive to the pesticide.
C: The insects will build up a tolerance to the pesticides, and eventually the pesticide will not affect them.
D: The pesticides will increase the mutation rate in the insects, resulting in higher genetic diversity and higher survival rate.
B: Insects that are naturally resistant to the pesticide will survive and reproduce more than the insects that are sensitive to the pesticide.
Newborn babies and hibernating animals contain a large amount of brown adipose (fat) tissue (BAT). Certain proteins in the BAT cells increase the permeability of the inner mitochondrial membrane to protons, disrupting the proton gradient.
Which of the following best predicts the effect of disrupting the proton gradient in BAT?
A: The pH of the matrix will increase, allowing the production of more ATP per gram of substrate.
B: The pH of the intermembrane space will decrease, allowing a steeper proton gradient to form.
C: Electron transport and oxidative phosphorylation will be decoupled, generating more heat but less ATP.
D: The number of protons available to pass through ATP synthase will increase, resulting in more ATP.
C: : Electron transport and oxidative phosphorylation will be decoupled, generating more heat but less ATP.
In pea plants, flower color and the length of the flower’s pollen grains are genetically determined. Researchers studying pea plants crossed homozygous dominant pea plants with homozygous recessive pea plants. The 𝐹1 plants were then crossed, and the number of offspring with each phenotype was recorded. The researchers’ observed data, however, differed from the expected data. The researchers did a chi-square analysis and calculated the chi-square value to be 5.5.
Based on their calculation, the researchers would most likely conclude which of the following?
A: The genes that determine these two traits are likely on the same chromosome.
B: The differences between observed data and expected data are due to chance.
C: The genes mutated since the researchers began the experiment and now have a different inheritance pattern.
D: The allele frequencies of the offspring have changed, suggesting the population is evolving.
B: The differences between observed data and expected data are due to chance.
A massive increase in the growth of a specific species of algae resulted in record-breaking levels of a potentially dangerous toxin being released into the water. A researcher hypothesizes that the unusual growth of this algal species was caused by an increase in water temperature. The researcher designs an experiment to test the hypothesis.
Which of the following is the dependent variable in the researcher’s experiment?
A: The growth of the algae
B: The temperature of the water
C: The concentration of toxin in the water
D: The different species of algae growing in the water
A: The growth of the algae
Which of the following is the most likely effect of a mutation in the gene coding for a DNA repair enzyme?
A: The cell containing the mutation will divide more frequently because the cell cycle checkpoints will not function properly.
B: Mutations will accumulate more quickly because the cell will not be able to fix errors in replication.
C: The mutated gene will not be transcribed because RNA polymerase cannot transcribe mutated DNA.
D: The cell will immediately undergo apoptosis so that mutated DNA is not replicated in future rounds of cell division.
B: Mutations will accumulate more quickly because the cell will not be able to fix errors in replication.
Certain chemicals, including sodium fluoride (NaF), are capable of inhibiting specific steps of glycolysis. Figure 1 shows the steps of the glycolysis pathway, indicating where various macromolecules enter the pathway as well as the specific reaction inhibited by NaF.

Figure 1. Key steps in the metabolic pathway of glucose
If NaF is added to cells undergoing cellular respiration, which of the following will most likely accumulate in the cells?
A: Glucose Transporter
B: Pyruvate
C: Phosphoenolpyruvate (PEP)
D: 2-phosphoglycerate
D: 2-phosphoglycerate
Certain chemicals, including sodium fluoride (NaF), are capable of inhibiting specific steps of glycolysis. Figure 1 shows the steps of the glycolysis pathway, indicating where various macromolecules enter the pathway as well as the specific reaction inhibited by NaF.
Figure 1. Key steps in the metabolic pathway of glucose
Based on Figure 1, the net number of ATP molecules produced during glycolysis from the metabolism of a single glucose molecule is closest to which of the following?
A: 0
B: 2
C: 4
D: 8
B: 2
Certain chemicals, including sodium fluoride (NaF), are capable of inhibiting specific steps of glycolysis. Figure 1 shows the steps of the glycolysis pathway, indicating where various macromolecules enter the pathway as well as the specific reaction inhibited by NaF.
Figure 1. Key steps in the metabolic pathway of glucose
An increase in the concentration of protons in the cytosol will most likely have which of the following effects on glycolysis?
A: Glycolytic enzymes will denature as a result of the increased H+ concentration.
B: Reaction rate will increase as a result of the increased H+ concentration.
C: H+ will replace phosphorous and inhibit ATP formation from ADP.
D: The water potential will increase, resulting in a decrease in the rate of glycolysis.
A: Glycolytic enzymes will denature as a result of the increased H+ concentration.
Certain chemicals, including sodium fluoride (NaF), are capable of inhibiting specific steps of glycolysis. Figure 1 shows the steps of the glycolysis pathway, indicating where various macromolecules enter the pathway as well as the specific reaction inhibited by NaF.
Figure 1. Key steps in the metabolic pathway of glucose
Which of the following describes why a glucose transporter is needed to move glucose into the cell?
A: Glucose is nonpolar and requires ATP to move across the membrane.
B: Glucose molecules are polar and need to move from low concentration to high concentration.
C: Glucose molecules are charged, and charged molecules are only ever actively transported.
D: Glucose is large and polar and cannot pass through the phospholipid bilayer.
D: Glucose is large and polar and cannot pass through the phospholipid bilayer.
Certain chemicals, including sodium fluoride (NaF), are capable of inhibiting specific steps of glycolysis. Figure 1 shows the steps of the glycolysis pathway, indicating where various macromolecules enter the pathway as well as the specific reaction inhibited by NaF.
Figure 1. Key steps in the metabolic pathway of glucose
Tarui disease is an inherited disorder that is caused by mutations in 𝑃𝐹𝐾𝑀, the gene that encodes a subunit of phosphofructokinase, an enzyme in the glycolysis pathway. Individuals with Tarui disease produce little or no functional phosphofructokinase in skeletal muscle cells. Based on Figure 1, which of the following best explains why a low carbohydrate diet is recommended for those with Tarui disease?
A: Carbohydrates are capable of undergoing lactic acid fermentation, and amino acids and fatty acids are not.
B: Carbohydrate metabolism requires all the reactions of glycolysis, and amino acids and fatty acids do not.
C: Carbohydrates cannot be used to synthesize important metabolic enzymes like amino acids and fatty acids can be.
D: Carbohydrates cannot be stored, while amino acids and fatty acids can be.
B: Carbohydrate metabolism requires all the reactions of glycolysis, and amino acids and fatty acids do not.
A mutation in the upland cotton plant causes the development of chloroplasts with a single outer membrane and no internal membranes. Which of the following would most likely be observed in chloroplasts of cotton plants with this mutation?
A: They would be unable to remove waste products, because internal transport proteins would not be present.
B: They would be unable to generate the ATP and NADPH needed to make sugars, because these processes occur on membranes within the chloroplast.
C: They would be unable to take up carbon dioxide, because CO2 is transported into the chloroplast in membrane-bound vesicles.
D: They would be unable to move within the cell, because only organelles with double membranes are mobile.
B: They would be unable to generate the ATP and NADPH needed to make sugars, because these processes occur on membranes within the chloroplast.
A researcher is crossing two organisms that are heterozygous for three Mendelian, unlinked traits (XxYyZz). Which of the following is the fraction of offspring that are predicted to have the genotype xxyyzz?
A: 1/64`
B: 1/32
C: 1/16
D: 1/8
A: 1/64
Mosquitoes are frequently a target of insect control strategies because of their ability to spread disease. One strategy is to introduce guppies, a type of freshwater fish, into areas where mosquitoes are a problem. Guppies can consume large numbers of mosquito larvae, which cuts down on the number of mosquitoes living to adulthood.
Researchers assessing the effectiveness of the guppy solution are concerned that the introduction of guppies might cause more problems than it is fixing. Guppies are hardy, tolerant of a wide range of environmental conditions, and fast-reproducing.
Which of the following predicts the most likely ecological problem that would occur if guppies are introduced into new areas to control the mosquito population?
A: The guppies might have no natural predators, which will result in a dramatic increase in the guppy population and an increase in competition for other native species.
B: The guppy population will likely evolve to consume another food source instead of the mosquito larvae.
C: The larvae will evolve a mechanism that will enable them to avoid predation from the guppies.
D: Predators in the area will consume the guppies, requiring the addition of more guppies on a regular basis.
A: The guppies might have no natural predators, which will result in a dramatic increase in the guppy population and an increase in competition for other native species.
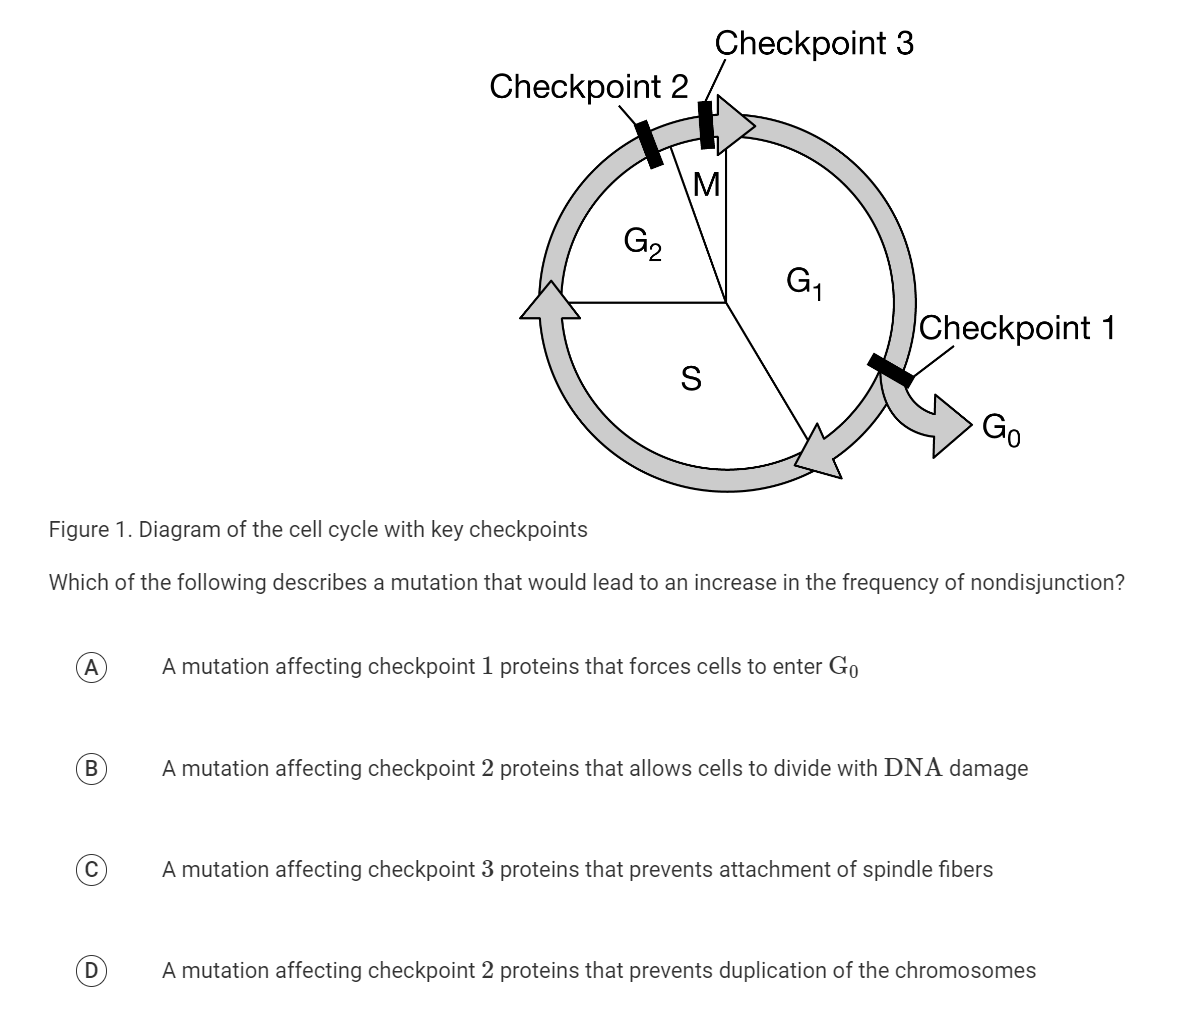
C: A mutation affecting checkpoint 3 proteins that prevents attachment of spindle fibers
Scientists studying a wild population of mantled howler monkeys found the average birth rate to be 0.22 and the average death rate to be 0.12. At the start of the study, the population consisted of 13 monkeys.
Assuming no immigration or emigration, which of the following best describes the change in population size that will occur over the next year?
A: The population size will decrease because a population of 13 is too small to sustain itself.
B: The population will decrease because more monkeys are dying each year than are being born.
C: The population will increase exponentially because it is so small that there are likely few competitors and abundant resources.
D: The population will increase because more monkeys are being born each year than are dying.
D: The population will increase because more monkeys are being born each year than are dyin
Which of the following best explains how the prokaryotic expression of a metabolic protein can be regulated when the protein is already present at a high concentration?
A: Repressor proteins can be activated and bind to regulatory sequences to block transcription.
B: Transcription factors can bind to regulatory sequences to increase RNA polymerase binding.
C: Regulatory proteins can be inactivated to increase gene expression.
D: Histone modification can prevent transcription of the gene.
A: Repressor proteins can be activated and bind to regulatory sequences to block transcription.
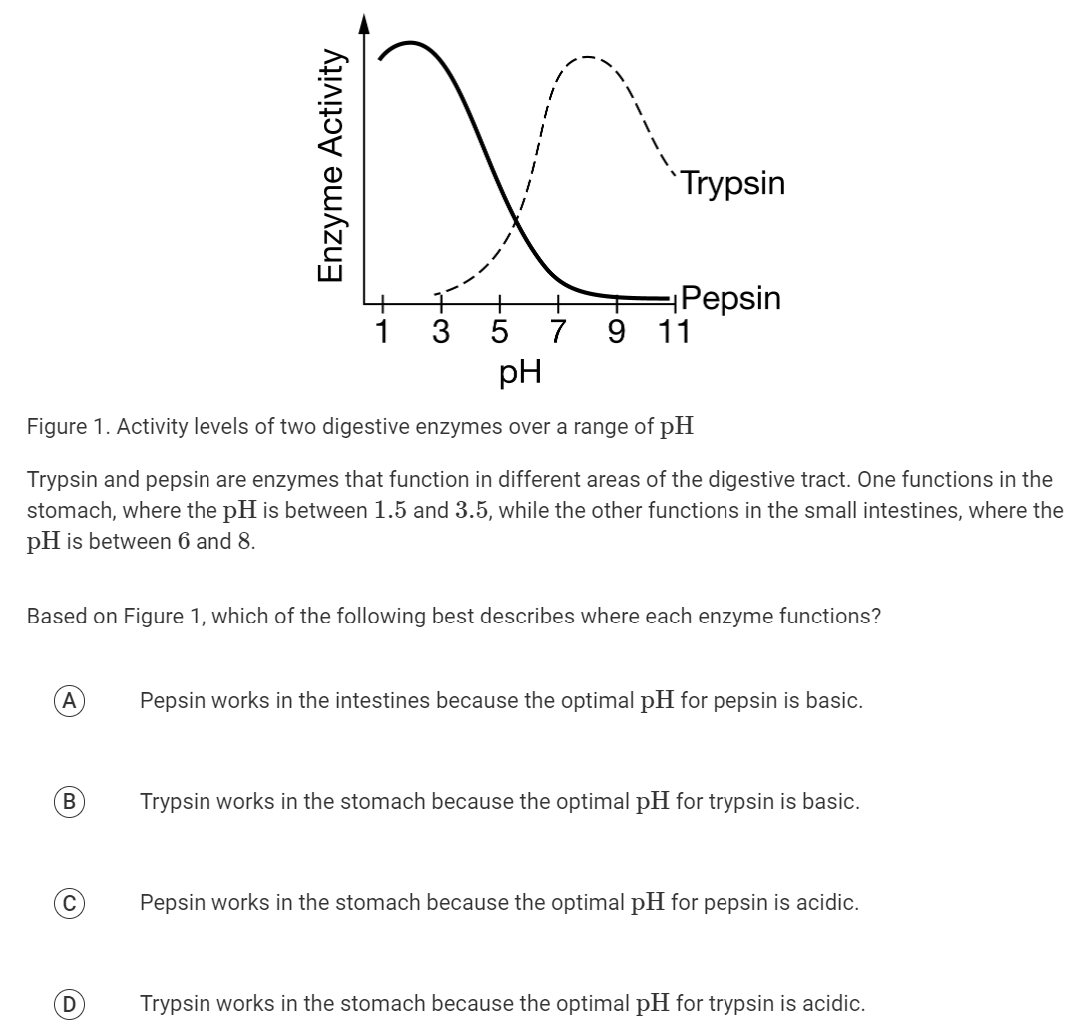
C: Pepsin works in the stomach because the optimal pH for pepsin is acidic.

Figure 1. Experimental steps taken to determine whether the nutrient source in a growth chamber affects mating preference
A population of fruit flies (Drosophila pseudoobscura) grown on a typical nutrient source was separated into several growth chambers. Each of the new chambers was assigned a different source of carbohydrates for nutrition, either starch or maltose, and maintained for many generations (Figure 1).
After a year, male and female flies were paired up in different combinations. The instances of mating between the males and females grown on the same nutrient source and males and females grown on different nutrient sources were recorded (Table 1).
TABLE 1. MATING INSTANCES BETWEEN MALES AND FEMALES GROWN ON THE SAME OR DIFFERENT NUTRIENT SOURCES |
| Females Grown on Starch | Females Grown on Maltose |
Males Grown on Starch | 22 | 9 |
Males Grown on Maltose | 8 | 20 |
To test whether the mating preferences were simply the result of being isolated in separate growth chambers, the researchers tested the mating preferences of flies that were both grown on starch, but in either the same or different chambers (Table 2).
TABLE 2. MATING INSTANCES BETWEEN MALES AND FEMALES GROWN ON THE SAME NUTRIENT SOURCE IN THE SAME OR DIFFERENT CHAMBERS |
| Females Grown on Starch in Chamber 1 | Females Grown on Starch in Chamber 2 |
Males Grown on Starch in Chamber 1 | 18 | 15 |
Males Grown on Starch in Chamber 2 | 12 | 15 |
Which of the following best represents the null hypothesis for the experiment detailed in Figure 1 ?
A: The mating preferences of flies are not dependent on the nutrient source on which they are grown.
B: Prolonged exposure to a different diet can change behavior in fruit flies.
C: When crossed, flies grown on the same medium will not produce viable offspring.
D: Growing flies in a confined chamber will not create a barrier to mating in fruit flies.
A: The mating preferences of flies are not dependent on the nutrient source on which they are grown.
Figure 1. Experimental steps taken to determine whether the nutrient source in a growth chamber affects mating preference
A population of fruit flies (Drosophila pseudoobscura) grown on a typical nutrient source was separated into several growth chambers. Each of the new chambers was assigned a different source of carbohydrates for nutrition, either starch or maltose, and maintained for many generations (Figure 1).
After a year, male and female flies were paired up in different combinations. The instances of mating between the males and females grown on the same nutrient source and males and females grown on different nutrient sources were recorded (Table 1).
TABLE 1. MATING INSTANCES BETWEEN MALES AND FEMALES GROWN ON THE SAME OR DIFFERENT NUTRIENT SOURCES |
| Females Grown on Starch | Females Grown on Maltose |
Males Grown on Starch | 22 | 9 |
Males Grown on Maltose | 8 | 20 |
To test whether the mating preferences were simply the result of being isolated in separate growth chambers, the researchers tested the mating preferences of flies that were both grown on starch, but in either the same or different chambers (Table 2).
TABLE 2. MATING INSTANCES BETWEEN MALES AND FEMALES GROWN ON THE SAME NUTRIENT SOURCE IN THE SAME OR DIFFERENT CHAMBERS |
| Females Grown on Starch in Chamber 1 | Females Grown on Starch in Chamber 2 |
Males Grown on Starch in Chamber 1 | 18 | 15 |
Males Grown on Starch in Chamber 2 | 12 | 15 |
For a population to be in Hardy-Weinberg equilibrium, certain conditions must be met. Which of the following best explains a characteristic of the fly populations that meets a condition of Hardy-Weinberg equilibrium?
A: The population size of the flies was very small, which increases the likelihood of random mutations having a greater impact.
B: Since the flies were confined in chambers, they did not experience any migration, so no new alleles were introduced through migration.
C: Flies have a relatively short generation time and therefore are more likely to pass mutations to the next generation.
D: The different food sources may have exerted selective pressure on the fly populations, giving an advantage to certain flies.
B: Since the flies were confined in chambers, they did not experience any migration, so no new alleles were introduced through migration.
Figure 1. Experimental steps taken to determine whether the nutrient source in a growth chamber affects mating preference
A population of fruit flies (Drosophila pseudoobscura) grown on a typical nutrient source was separated into several growth chambers. Each of the new chambers was assigned a different source of carbohydrates for nutrition, either starch or maltose, and maintained for many generations (Figure 1).
After a year, male and female flies were paired up in different combinations. The instances of mating between the males and females grown on the same nutrient source and males and females grown on different nutrient sources were recorded (Table 1).
TABLE 1. MATING INSTANCES BETWEEN MALES AND FEMALES GROWN ON THE SAME OR DIFFERENT NUTRIENT SOURCES |
| Females Grown on Starch | Females Grown on Maltose |
Males Grown on Starch | 22 | 9 |
Males Grown on Maltose | 8 | 20 |
To test whether the mating preferences were simply the result of being isolated in separate growth chambers, the researchers tested the mating preferences of flies that were both grown on starch, but in either the same or different chambers (Table 2).
TABLE 2. MATING INSTANCES BETWEEN MALES AND FEMALES GROWN ON THE SAME NUTRIENT SOURCE IN THE SAME OR DIFFERENT CHAMBERS |
| Females Grown on Starch in Chamber 1 | Females Grown on Starch in Chamber 2 |
Males Grown on Starch in Chamber 1 | 18 | 15 |
Males Grown on Starch in Chamber 2 | 12 | 15 |
Which of the following claims is best supported by the data in Tables 1 and 2 ?
A: The population of flies has undergone sympatric speciation.
B: The flies have developed a form of behavioral preference that could lead to divergence.
C: A postzygotic barrier has evolved between the populations of flies that prevents the birth of viable offspring.
D: The flies have undergone allopatric speciation, since only flies from the same chamber mated.
B: The flies have developed a form of behavioral preference that could lead to divergence.
Figure 1. Experimental steps taken to determine whether the nutrient source in a growth chamber affects mating preference
A population of fruit flies (Drosophila pseudoobscura) grown on a typical nutrient source was separated into several growth chambers. Each of the new chambers was assigned a different source of carbohydrates for nutrition, either starch or maltose, and maintained for many generations (Figure 1).
After a year, male and female flies were paired up in different combinations. The instances of mating between the males and females grown on the same nutrient source and males and females grown on different nutrient sources were recorded (Table 1).
TABLE 1. MATING INSTANCES BETWEEN MALES AND FEMALES GROWN ON THE SAME OR DIFFERENT NUTRIENT SOURCES |
| Females Grown on Starch | Females Grown on Maltose |
Males Grown on Starch | 22 | 9 |
Males Grown on Maltose | 8 | 20 |
To test whether the mating preferences were simply the result of being isolated in separate growth chambers, the researchers tested the mating preferences of flies that were both grown on starch, but in either the same or different chambers (Table 2).
TABLE 2. MATING INSTANCES BETWEEN MALES AND FEMALES GROWN ON THE SAME NUTRIENT SOURCE IN THE SAME OR DIFFERENT CHAMBERS |
| Females Grown on Starch in Chamber 1 | Females Grown on Starch in Chamber 2 |
Males Grown on Starch in Chamber 1 | 18 | 15 |
Males Grown on Starch in Chamber 2 | 12 | 15 |
Which of the following is closest to the number of flies expected to be heterozygous for the amylase mutation assuming all conditions of Hardy-Weinberg equilibrium are met?
A: 0.13
B: 0.36
C: 0.46
D: 0.64
C: 0.46
Figure 1. Experimental steps taken to determine whether the nutrient source in a growth chamber affects mating preference
A population of fruit flies (Drosophila pseudoobscura) grown on a typical nutrient source was separated into several growth chambers. Each of the new chambers was assigned a different source of carbohydrates for nutrition, either starch or maltose, and maintained for many generations (Figure 1).
After a year, male and female flies were paired up in different combinations. The instances of mating between the males and females grown on the same nutrient source and males and females grown on different nutrient sources were recorded (Table 1).
TABLE 1. MATING INSTANCES BETWEEN MALES AND FEMALES GROWN ON THE SAME OR DIFFERENT NUTRIENT SOURCES |
| Females Grown on Starch | Females Grown on Maltose |
Males Grown on Starch | 22 | 9 |
Males Grown on Maltose | 8 | 20 |
To test whether the mating preferences were simply the result of being isolated in separate growth chambers, the researchers tested the mating preferences of flies that were both grown on starch, but in either the same or different chambers (Table 2).
TABLE 2. MATING INSTANCES BETWEEN MALES AND FEMALES GROWN ON THE SAME NUTRIENT SOURCE IN THE SAME OR DIFFERENT CHAMBERS |
| Females Grown on Starch in Chamber 1 | Females Grown on Starch in Chamber 2 |
Males Grown on Starch in Chamber 1 | 18 | 15 |
Males Grown on Starch in Chamber 2 | 12 | 15 |
Which of the following combinations of flies showed the highest number of mating instances?
A: Males grown on maltose paired with females grown on starch
B: Males grown on starch paired with females grown on starch
C: Males grown on maltose paired with females grown on maltose
D: Males grown on starch paired with females grown on maltose
B: Males grown on starch paired with females grown on starch
The primary function of the kidney is to exchange molecules across a membrane between the blood and the urine. One type of kidney cell has a basic rectangular shape, except for a single surface, which is lined with tiny, finger-like projections that extend into the surrounding extracellular space.
Which of the following best explains the advantage these projections provide the cell?
A: he projections increase the volume of the cell without affecting the surface area, which increases the metabolic needs of the cell.
B: The projections increase the surface area–to-volume ratio of the cell, which allows for more efficient nutrient exchange with the environment.
C: The projections increase the speed at which an individual molecule can move, resulting in faster nutrient exchange with the environment.
D: The projections increase the selectivity of the membrane because the small size of the projections limits the number of transport proteins that can be embedded in the membrane.
B: The projections increase the surface area–to-volume ratio of the cell, which allows for more efficient nutrient exchange with the environment.
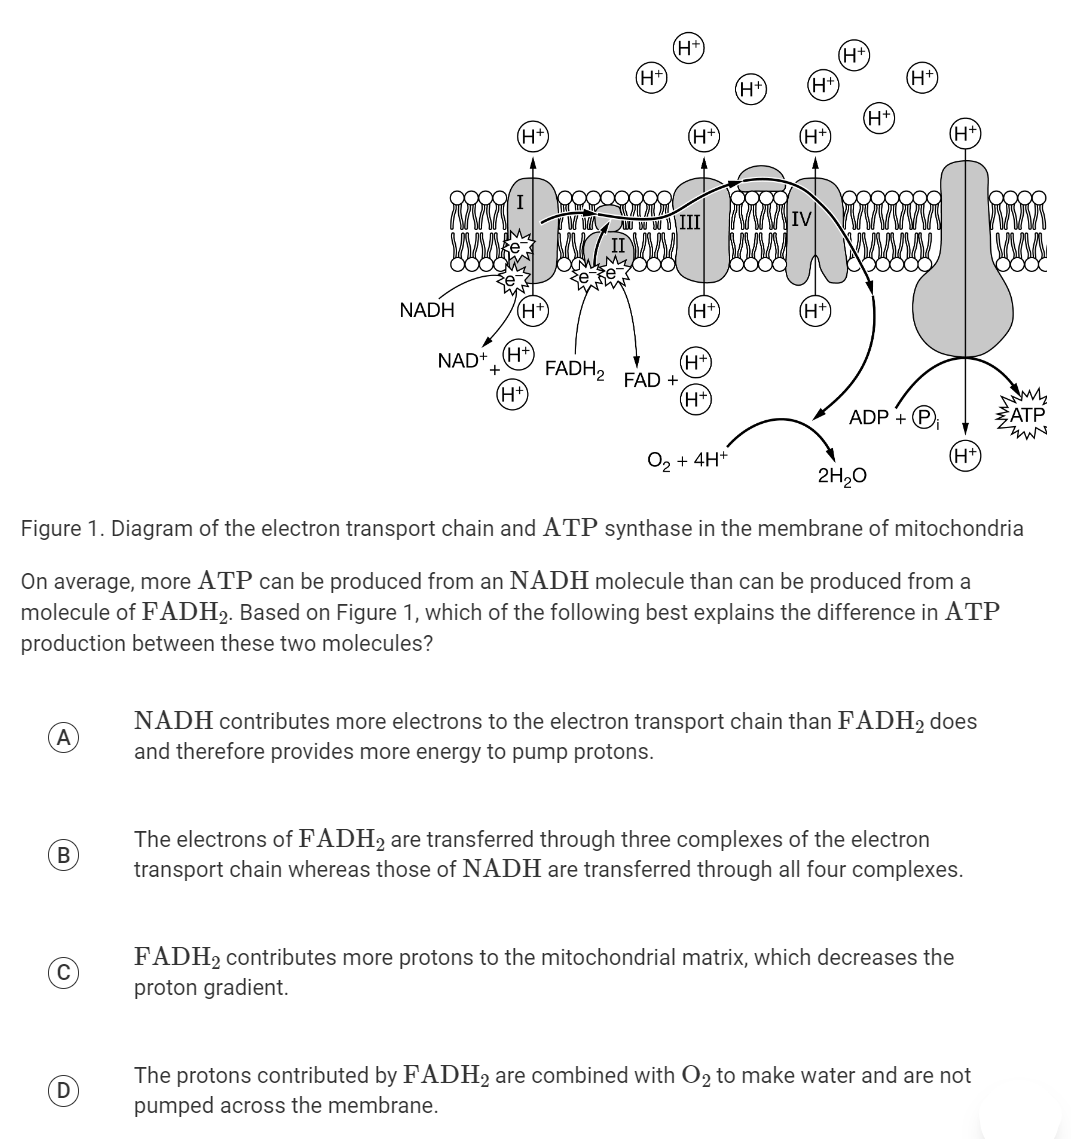
B: The electrons of FADH2 are transferred through three complexes of the electron transport chain whereas those of NADH are transferred through all four complexes.
Which of the following best explains why ligase is required for DNA replicatio
A: The lagging strand cannot be replicated continuously, and ligase is needed to join the fragments.
B: Ligase forms the hydrogen bonds between complementary bases in the two strands of DNA.
C: Ligase facilitates the binding of RNA polymerase to the promoter region.
D: Ligase enables the newly synthesized DNA to twist into a double helix.
A: The lagging strand cannot be replicated continuously, and ligase is needed to join the fragments.