r
r=Correlation coefficient, the average cross product of z scores
Definition
Measures the relationship BETWEEN 2 numeric variables
Strength and association
Measures direction(+-) and strength (-1 to 1), not shape
HOW closely points cluster around the “center” of data
Data
Univariate data→ mean
bivariate data→ regression line
Unitless, so changing the units does nothing
r must be BETWEEN -1 and 1, with 1 meaning perfect correlation
Not affected by which variable(x,y) is changing units
SAME Sign(+-) as the direction of the slope
STRONGLY affected by extreme values
If 1 variable has an equattion→ use it
(s-x) and (x) have a negative correlation because there is a negative
Math
r= Σ ((x-x̄)/sx)*(y-ȳ)sy)) / (n-1)
= Σ( zx- zy) / (n-1)
Strength of r
STRENGTH of r, correlation coefficient
Numbers
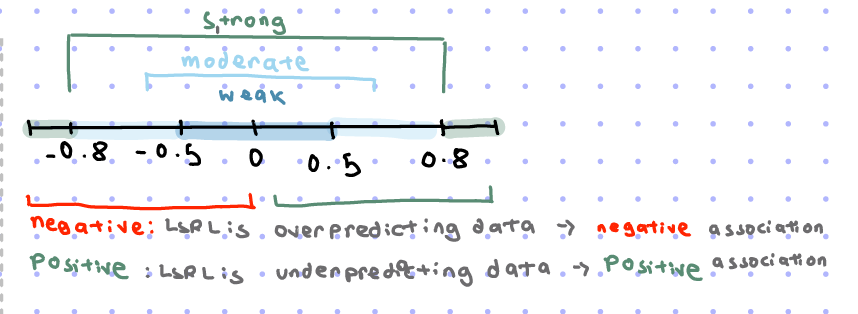
0 to 0.5 →weak
0.5-0.8 →moderate
0.8 onwards→strong
A negative: LRSL is overpredicting data→ negative association
A positive: LRRSL is underpredicting data→ positive association
Least Square Regression Line(LSRL)
Estimates and predictions, not actual values
reasonable only WITHIN the domain of the data(Interpolation
MUST pass through the mean(x̄, ȳ)
Regression OUTLIERS
indicated by a point falling far away from the overall pattern
points with relatively large discrepancies BETWEEN the value of the response variable, y, and a predicted value for the response variable,ŷ
Math
LSRL=ŷ =a+bx
a =y intercept
b=slope
b=r(sy /sx)
SSE= Σ(y-ŷ)
y= Actual
ŷ=predicted
r2
r2=Coefficient of determination
Calculates the proportion of the variance(variability) of one variable that is PREDICTED by the other variable
“ r2 as a 5 of the total variation in Y can be explained by the linear relationship BETWEEN X and Y in the regression line. “
What % of total data can be explained by the regression line?
Greater r2% → Better fit
Math
1-r2 = HOW much variability in Y is unaccountable by the regression line.
Describing Scatterplots
SOFA
S:Strength( Strong, Moderate, Weak, variability and Heteroscedasticity)
O: Outliers( in x, y direction, or BOTH)
F: Form(Linear or curved)
A: Association (Positive, negative, or no composition")
Describing SOFA relationship BETWEEN variables
STEPS
Identify the variables, cases, and scale of measure
Describe overall shape
Describe the trend through the slope
describe strength
Generalization
Note any lurking variables OR causation
Heteroscedasticity
Unequal variation in the plot
“Fanning left/right”
Doesn’t cause bias in the coefficient estimates, but make them less precise.
Lower precision increases the likelihood that the coefficient estimates are further from the correct population value.
tends to produce p-values that are smaller than they should be
Scatterplots
Graph
change can be seen in frequency bar charts
clusters→ modes(peaks, which can also show bimodal)
Scatterplots are only for bivariate data
Z score
Standardised Z
x, y values will be based on their +-, meaning their points location on the 4 quadrants of the coordinate plane, the origin (0,0) being the intersection
Regression
HOW 2 numerical variables AFFECT each other
(x, y) are not interchangeable
“Casual” affect, but NOT causation
Positive when independent and dependent variables are both increasing or decreasing together
Negative when independent and dependent variables are going opposite ways(ie. one is increasing the other is decreasing)
Mean
the regression to the mean: in ANY elliptical cloud of points whenever the correlation, r, is not perfect
A line fitting through this elliptical cloud has a slope of 1
Interpolation
Predicting data value within the dataset
Extrapolation
Predicting data value Outside the dataset
Slope interpretation
“for every 1 unit increase in the explanatory variable, x, there is a slope increase/decrease in the response variable, y.
SSE
The sum of square residual error
Residuals
*distance measurement
The net sum of residual and mean=0
The DIFFERENCE between an observed Y value and its predicted value from the regression line
Decreases when the regression line fits MORE data
Math
Residual= Y-ŷ
Positive output: linear model UNDERestimated the actual response variable
Negative output: linear model OVERestimated the actual response variable
Residual Plots
Scatter plot of regression residuals AGAINST the predicted y values
a “barometer” for HOW well the regression lines fit the data
curvature →sign of curvature in the original plot, meaning the original was a nonlinear regression
rules for regression
The sum of residuals=0
horizontal line: mean of residuals=0
Residual Scattered=better fit for data
Residual have pattern/curve= Not an appropriate line
Missed features in Scatterplots
These points will change the measurement
Influential points
High leverage points
outliers
lurking variables
Influential points
examples: Outliers, high-leverage
removal of points→sharply CHANGE the regression line
High leverage
x values are far from x̄
line up with pattern: doesn’t influence equation, strengthens correlation, r, and determination, r²
Not line up with pattern: dramatically CHANGES the equation, an influential point
Outliers
may cause r² and S to CHANGE
lurking variables
Correlation ≠ causation
Slope Changing Transformations
Line of fit to a scatterplot should be considered for a plot with curvature → adjust the plot using transformations
Nonlinear transformations change the shape of the graph, linear won’t
in terms of slope and correlation,r
ONLY required if a linear model/scatterplot has curvature
use log(ln) or log(log) depending on the plot
exponential and power
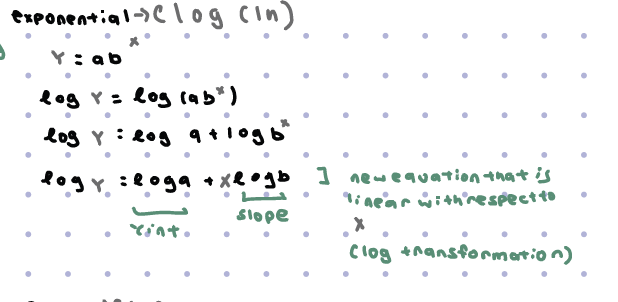
Exponential transformation
y=abx
New equation: log y=log a +x log b
generally used for growth in population
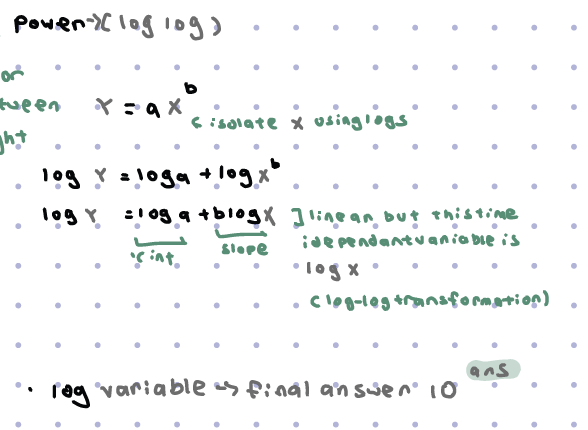
Power Transformation
y= axb
New Equation: log y-log a+b log x
need to log the variable → final answer is 10ans
generally used for relationships BETWEEN height and weight
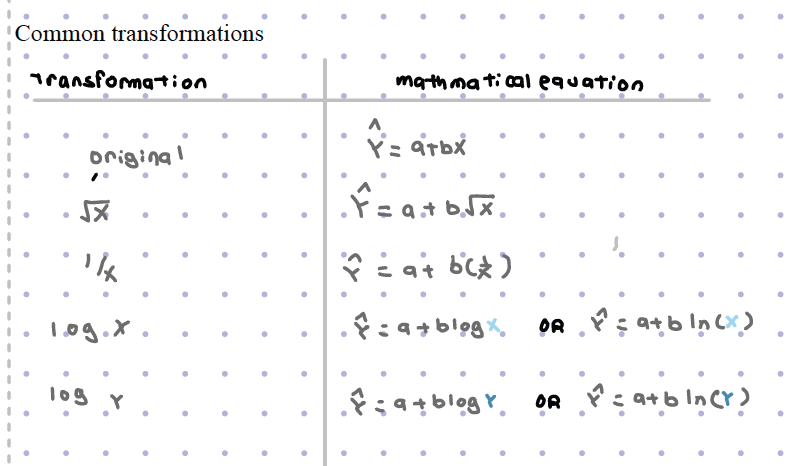
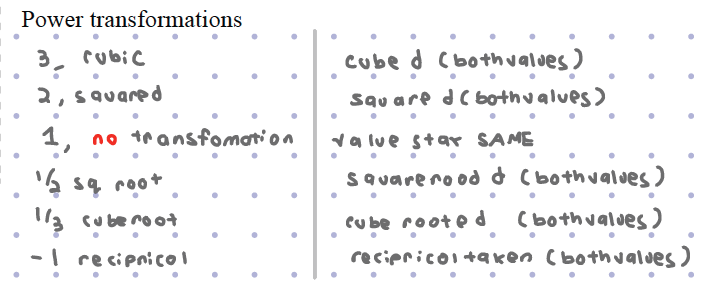
Common Transformations
Power Transformations
Calculator interpretation
Variable =x, explanatory variable
coefficient constant=y intercept, a
coefficient with variable= slope, b
Error SS=SSE
Residual:SSE