
ECON2105 Chap. 3
Chpt. 4 - Equilibrium
A market is any setting that brings together suppliers and demanders
Shopping: Demanding consumer goods
Working: Supplying labor
Getting repairs: Hiring skilled labor
Saving: Supplying Credit
Borrowing: Demanding Credit
Traveling: Supplying USD and Demanding foreign currency
In class: demanding education
Equilibrium price – price where the market is at equilibrium
Equilibrium quantity – quantity where market is at equilibrium
Prices determined by both supply and demand
Consequences of shifts in supply and demand
If demand increases, price increase and quantity supplied increases to new equilibrium.
If demand decreases, price decreases and quantity supplied decreases to new equilibrium.
If supply increases, price decreases and quantity supplied increases to new equilibrium.
If supply decreases, price increases and quantity supplied decreases to new equilibrium.
Is the supply curve or demand curve (or both) shifting?
Is it an increase or a decrease?
How will this effect equilibrium quantity and price
GDP
GDP measures total output, total spending, and total income
Real GDP – No inflation
Nominal GDP – includes inflation values
GDP – Market value of all final goods and services produced within a country in a year.
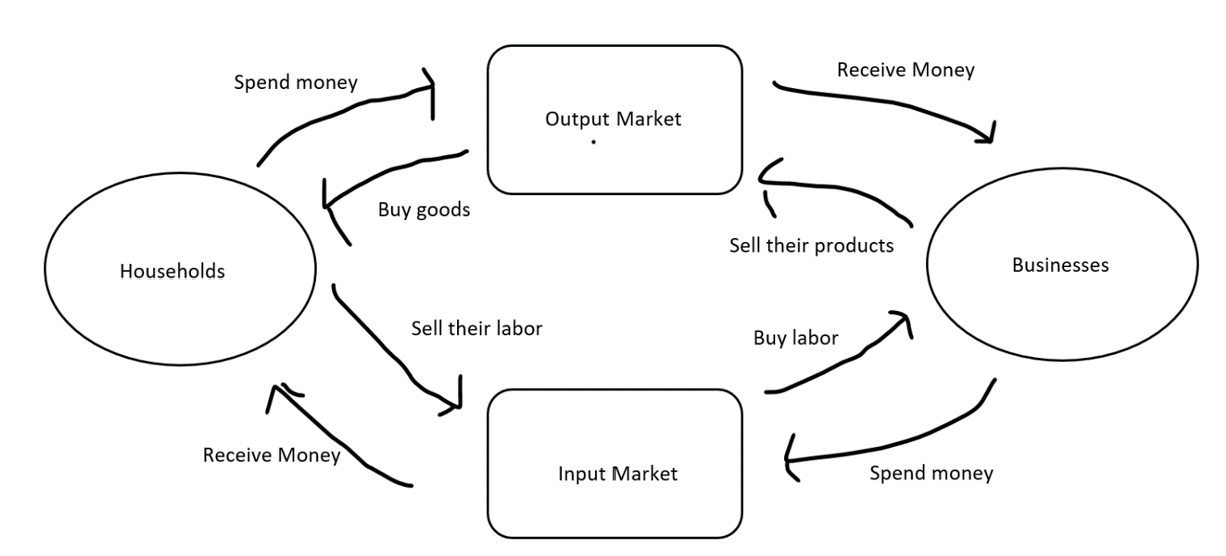
Circular flow diagram:
Three ways to calculate:
Add up every dollar worth of output produced
Add up every dollar of spending
Add up every dollar of income earned
GDP = Consumption + Investment + Government Spending + Net Exports (CIGX)
Net Exports = Exports – Imports
Nominal GDP – todays prices
Real GDP – constant prices
Calculate “Percent Change in Value”: (new value – old value) / old value
Growth Rate: (this year – last year) / (last year)
Base year: year where we keep prices fixed
Growth Rate (NGDP) = Growth Rate (RGDP) + Growth Rate Price Level
Doubling time = 70 / (growth rate)
Y = f (L, H, K)
Y= output
F = function
L = Labor
H = Human Capital
K = Physical Capital
y = Y/L
y = gdp per capita
Diminishing Marginal Returns to capital: more we put in, less we get out
Catch up – smaller countries can catch up to others