


Ch 8 - Monopoly
(Microeconomics)
The Nature of a Monopoly
Monopoly:
Is a market structure where one firm dominates the entire capacity of the industry, meaning that no exact substitutes for the goods and services can be offered.
Entering and exiting the market due to this monopoly is hard as there are high barriers to entry. Monopoly firms tend to be price makers, as they set the price they want.
Monopolies have imperfect competition, which indicates it has a downward sloping demand curve, where marginal revenue will be less than demand.
However, in order for firms in monopolies to sell more units, it has to lower its prices. The demand curve is derived from the added revenue decreasing at a faster rate than price. The marginal revenue eventually becomes negative in this case. Due to any additional revenue becoming negative, monopolists will opt to not produce goods in this case.
Reasons for High Entry Barriers:
Economies of Scale: when a firm is able to gain production advantages over its opponents by producing goods and services at a lower cost than the other firms. The long run average costs tend to decrease as the firm increases in size of operation.
Resource Control: A firm which controls the resources that are needed for the production of a product.
Government power: Where the government chooses to give a singular the power of sole production to the market
Copyrights or Patents: the government grants sole production of a product to a singular firm
A Monopolist's Demand Curve
In the elastic range of the demand curve, a profit maximising monopoly will be produced. The marginal revenue is positive, as the prices are lowered by monopolists, which increases profits and leads to an increase in total revenue.
In the inelastic range, monopolists will not produce goods and services. The marginal revenue is negative here, a decrease in total revenue leads to a decrease in price.
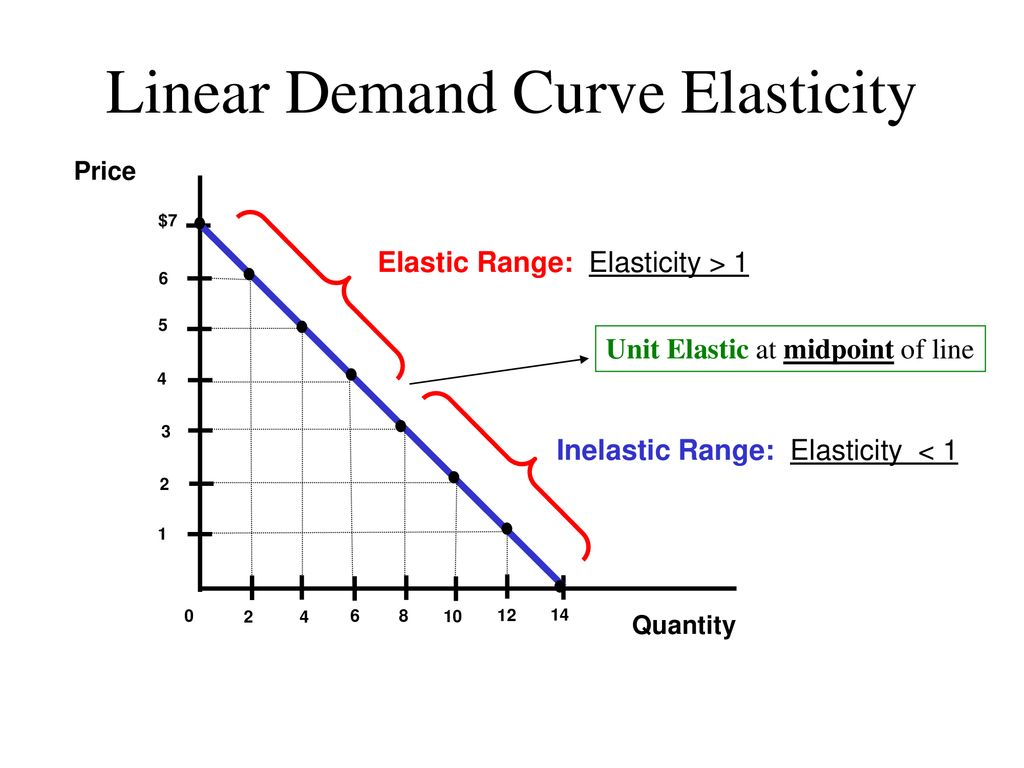
The monopoly’s demand curve is proportional to its price and average revenue.
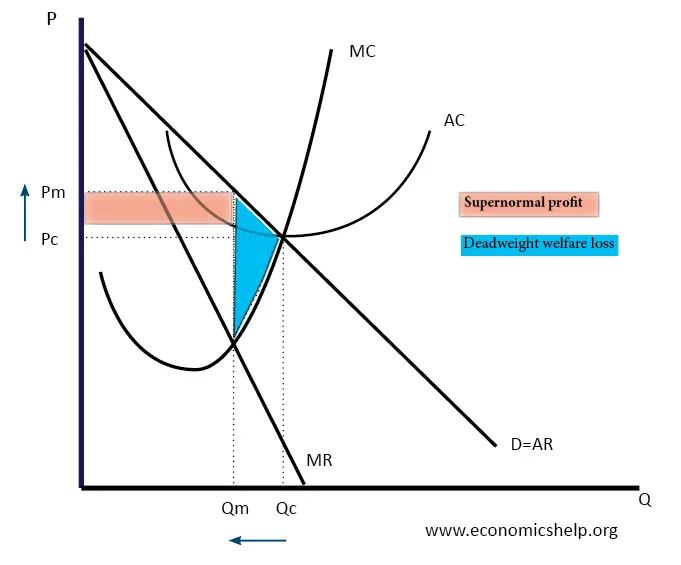
On a graph, a monopoly can be illustrated through both the firm and the indignity, as it has control of the total production of goods and services. This is known as the price maker, which is why the monopoly graph is shared between firm and industry.
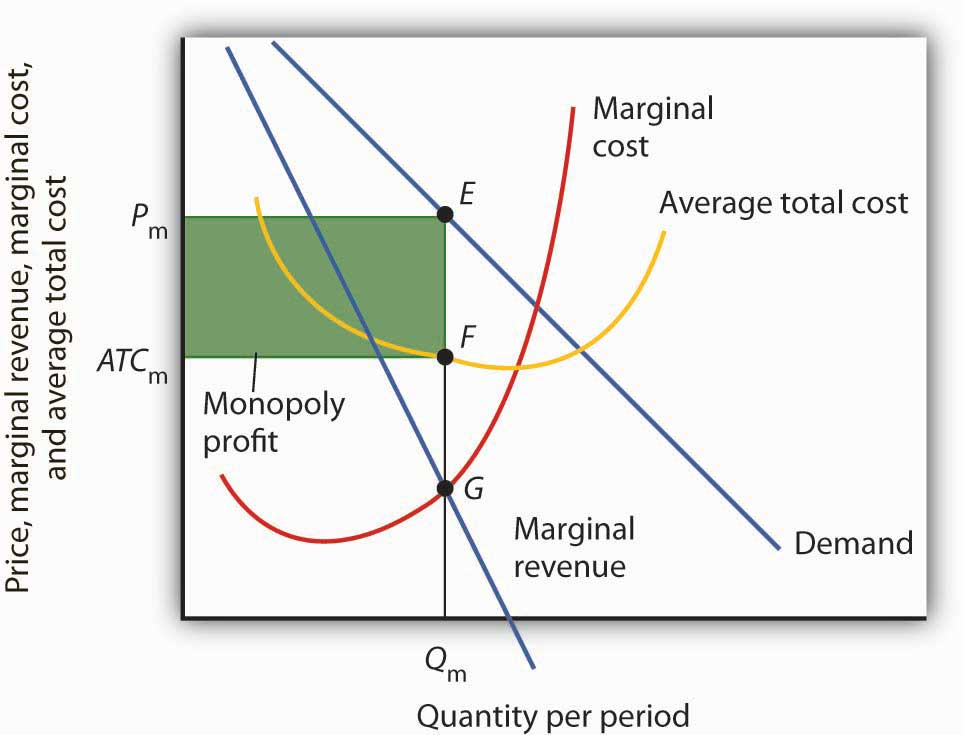
In order to interpret the Monopoly graph, one must find the profit maximising quantity at MR = MC, and understand where the price is located from the demand curve
Monopolies and Efficiency - Deadweight Loss Returns
A deadweight loss is the measurement of the losses which occur following the implementation of a new tax. As a result, the new tax is usually more than what is usually paid to the government.
Allocative Efficiency: producing the exact amount of output that members of the society will need . P=MC in this case, however, monopolies produce P>MC depending on the needs of society
Productive Efficiency: when the production of products is being done at the lowest cost possible, in which case P= minimum ATC. Monopolies produce at P > ATC
A monopoly is only sustainable for the monopolist, as it is harmful for society and consumers.
In Fig. 1, we can see that there is a deadweight welfare loss moving to the left from Qc to Qm. Since this is not a competitive market producing at Qc, that area is neither a consumer nor producer surplus. Here, P is unequal to MC, which leads to it not being allocatively efficient.
The monopoly does not produce at minimum ATC, meaning that it is not productively efficient since P does not equal minimum ATC
In a deadweight diagram, it is always present under the demand curve, above the marginal cost, and on the left of profit maximising quantity.
Price Discrimination
Is a selling strategy which prices the same good at different prices based on what the producer believes the consumers will pay for this product. The prices differ based on what the consumers are willing to pay.
An example of this would be airline tickets which are strategically priced differently. However, this would not be effective as consumers will understand that they have been paying a higher price than others.
Price discrimination works most efficiently if these conditions are met:
Different price elasticities are the basis to creating different markets for consumers. Elastic demand goods provide consumers with the ability to use substitutes. Goods with inelastic demand have less substitutes to consumers.
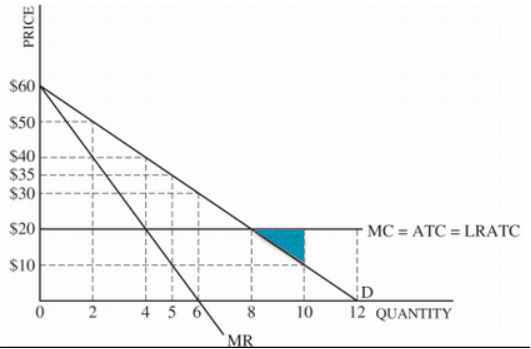
TIP: this graph will be included in the AP exam since it has flat MC, ATC, and LRATC curves which makes it easier to identity where the deadweight loss is along with other factors. This is seen in Fig. 5
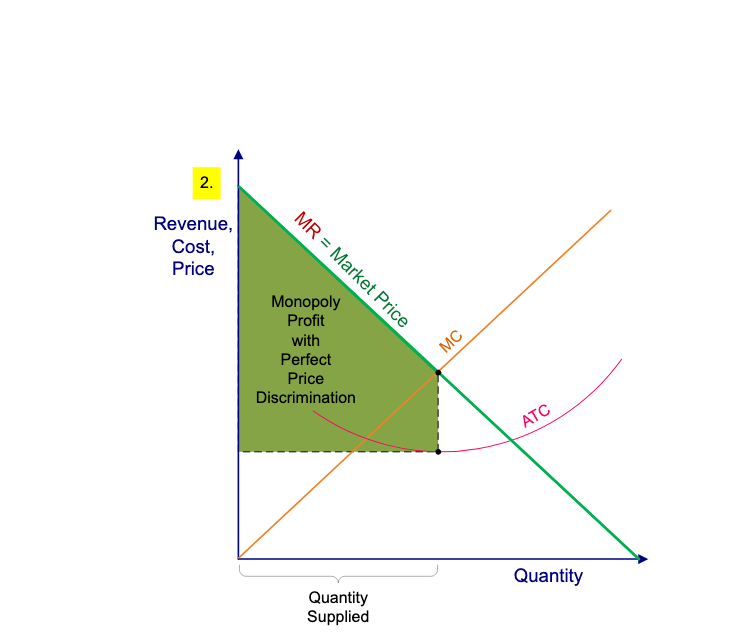
This graph has a few unique features, which are:
Demand = Marginal Revenue: They are not separated anymore
Lack of consumer surplus: the price of goods and services depends on the highest price which consumers are capable of paying
Increase in Profits
Natural Monopolies
This monopoly is formed when there are high start-up costs leading to larger economies of scale, which leaves only one firm in charge of producing goods and services to this territory. There are larger entry and exit costs in the market that lead to this. Only one farm is capable of serving the market at a time.
Due to a reservation of high prices and poor quality of goods and services, the government will often encourage natural monopolies and attempt to regulate these policies in an effort to regain efficiency and reduce deadweight loss.
Regulation of Monopolies
The Government is able to regulate monopolies through these policies:
Socially optimal pricing: the government regulators will forcefully implement monopolies onto firms in order to allocate efficient pricing at P = MC.
Fair-return pricing: In an effort to let firms earn a normal profit and cover its implicit and explicit costs, regulators will force the monopoly to have allocative efficiency at P=MC
Unregulated monopoly: firms who produce at the profit-maximising quantity of MR=MC, lead to underproduction and overcharging.
Characteristics of Monopoly:
Singular firm selling a unique product
Demand curve is sloping downwards, with MR<D
This firm is a price maker (they set the price according to how much the consumers are willing to pay
Economic profit in the long run
Not allocatively efficient P>MC
Productively efficient P> minimum ATC
When the price is at:
Fair-Return Price: Price =average total cost (there is a crossover of demand curve and average total cost curve)
Socially Optimal Price: Price = Marginal cost (the demand curve and marginal cost curve intersect here)