


7.1: Statistics and Parameters
Statistics and Parameters
Statistic: a number that describes some characteristic of the sample
Relevant symbols
Mean: x̄
Proportion: p̂
Standard deviation: S
Parameter: a number that describes some characteristic of the population
Relevant symbols
Mean: μ
Proportion: p
Standard deviation: σ
Samples are taken to try to estimate the population (μ or p)
Ultimate goal: Estimate parameters based on statistics
Distribution, Variability, and Bias
Sampling distribution: the distribution of values taken by the statistic in all possible samples of the same size from the same population
Eg. sample mean, proportion
Sampling variability: how much results vary between samples
Every time a sample is taken, the results will vary
Measured using the spread of the random sample
Based primarily on the size of the random sample
As a general rule of thumb,
Larger sample: less variability
Smaller sample: more variability
The spread does not depend on the size of the population, as long as it is at least 10x larger than the sample
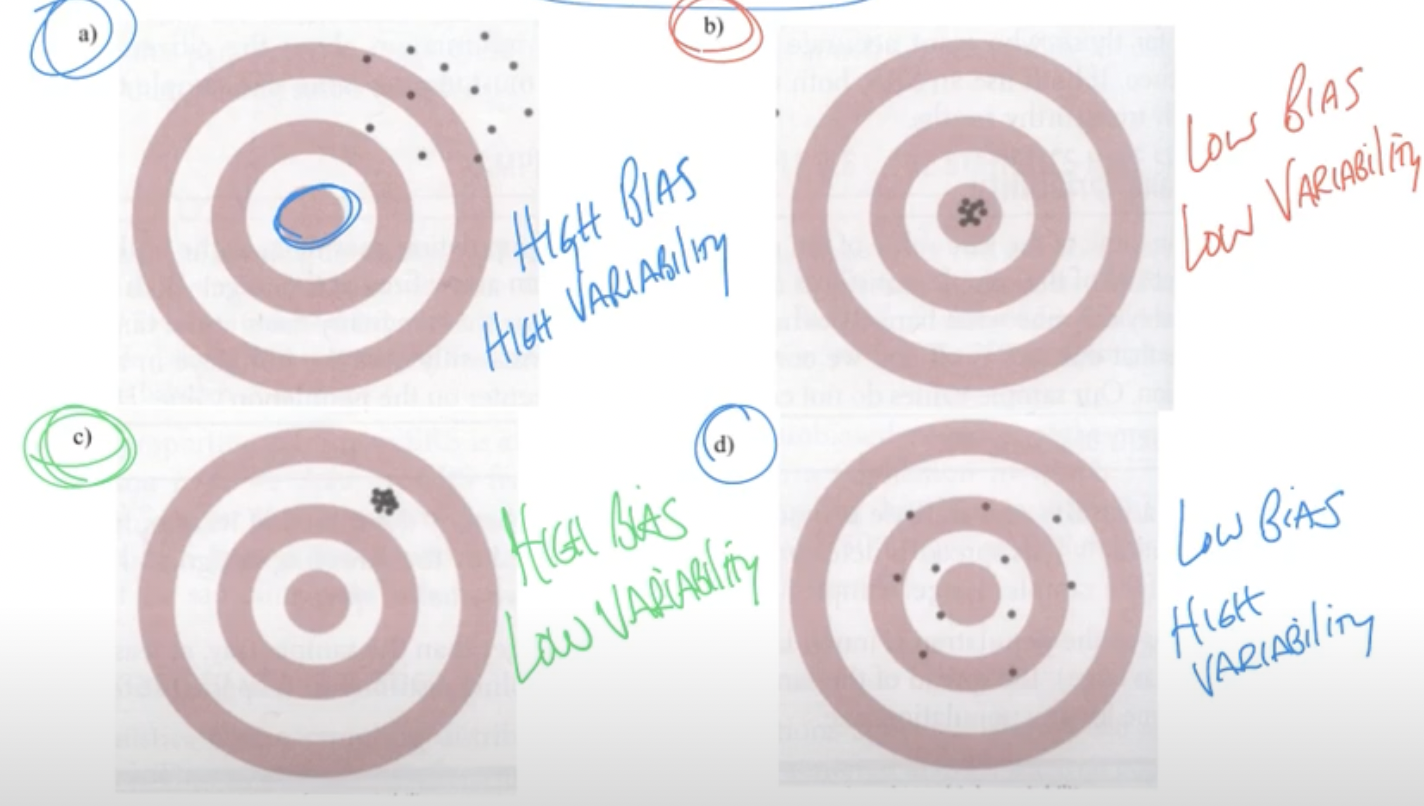
Biased statistic: a statistic which consistently overestimates or underestimates the parameter (mean or proportion)
Unbiased statistic: a statistic in which the distribution of samples is centered around the true population’s parameter
Bias vs. variance
Means and Proportions
Proportion problems generally involve categorical variables
Binomial distributions will become approximately normal distributions if np≥10 and n(1-p)≥10
n = sample size
p = population proportion
p̂ = sample proportion
Normal distribution means the use of z-scores as a standard measure
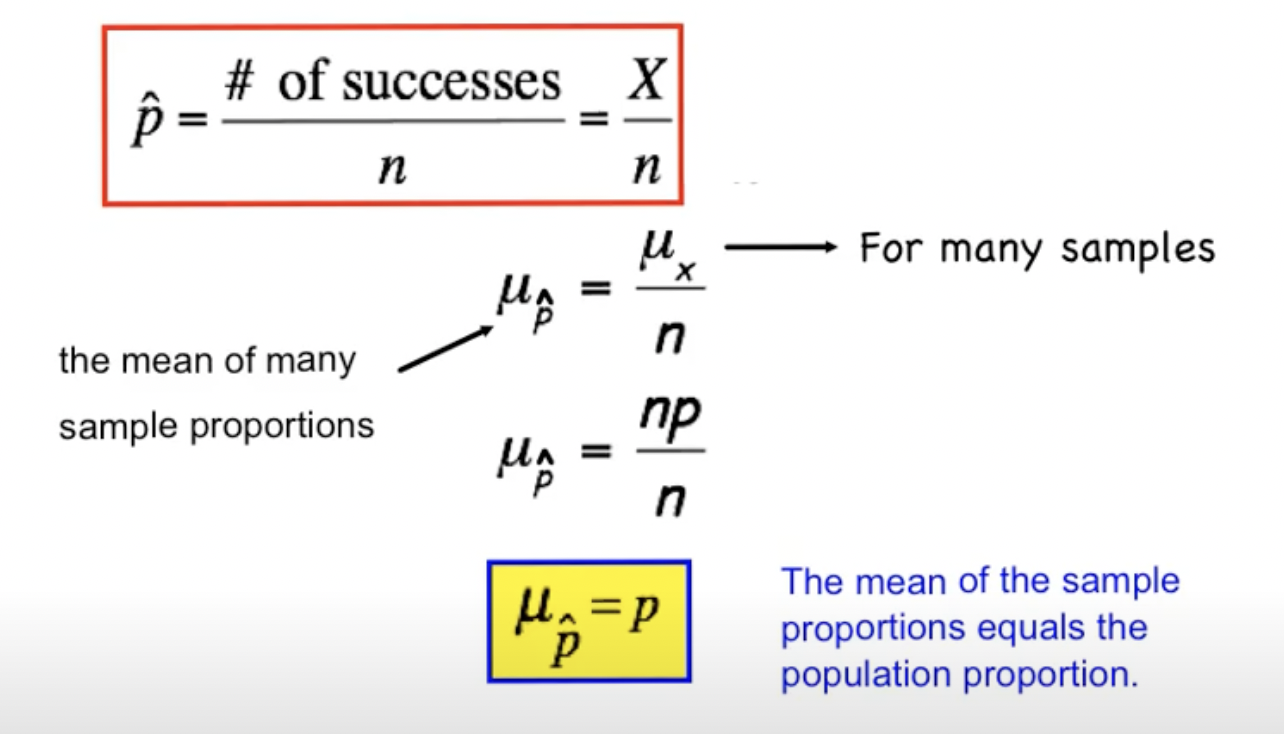
Statistics are unbiased if they are equal to the true parameters, so p̂ is an unbiased estimator of p
Verifying Conditions
If an SRS is taken of size n from a large population with proportion p,
Some conditions must be stated and checked
Is the population more than 10x larger than the sample size?
The 10% condition verifies that the standard deviation formula may be used
Is np ≥ 10 and is n(1-p) ≥ 10?
This verifies that a normal approximation may be used
If these conditions are met, the mean of the sample proportions will equal the true population proportion