Total cost
Total=fixed costs + variable cost
Profits
profit=total revenue - total costs
Total variable costs
Variable cost per unit x Nr of units sold
Sales revenue
Sales revenue = selling price per unit x Nr of units sold
Market capitalisation
Nr of shares issues x current share price
E.V.
EV= pay-off x probability
Net Gain
NG= EV- initial cost of decision
Market size volume
Volume= quantity of goods & services produced in a market in a given time period
Market size value
Total market sales revenue over a given period of time within a market
Sales volume
Quantity of goods and services sold by a business over a period of time
Market growth %
MG= new size-old size / old size x 100
Market share %
Sales of brand/business / total market sales
Added value
Sales revenue - cost of bought /materials
Labour productivity
LP= output per time period / Nr of employees
Unit costs
Total production cost / Nr of units
Capacity utilisation
Actual output / maximum possible output x 100
RoI %
ROI = return on investment / cost of investment x 100
Gross profit
GP = sales revenue - cost of sales
Operating profit
OP = sales revenue - cost of sales - operating expenses
Profit for the year
PfY= operating profit + other profit - net finance costs - tax
Variance
Difference between actual and budgeted figure
Contribution per unit
CpU = selling price - variable costs per unit, It focuses on the returns (contribution) a business makes from each unit of product sold and whether that return is enough to allow the business to make money overall after taking account of its fixed costs.
Total contributions
TC = contribution per unit x units sold
TC = total revenue - total variable costs
Break even output
BE output = fixed costs / contributions per units
Break even chart
When total revenue = total cost
Margin of safety
MoS = actual level of output- break even level
Gross profit margin
GpM = gross profit / sales revenue x 100
Any margin calc
Margin % = ANY profit / sales revenue x 100
Labour turnover %
= Nr of staff leaving / average Nr staff employed x 100
Retention rate %
Nr of staff staying / average Nr staff employed x 100
Employee costs as % of turnover
Employee costs / sales revenue x 100
Labour cost per unit
Labour costs / units of output
ROCE
ROCE = operating profit / (total equity + non-current liabilities) x 100
Current ratio
Current assets / current liabilities, Current ratio is a financial metric used to evaluate a company's ability to pay its short-term liabilities with its short-term assets.
Gearing %
Gearing = non-current liabilities/ ( total equity + non current liabilities) x100, measures how much a company's operations are funded by a form of equity versus debt.
Payable days (creditors)
Payables / cost of sales x 365
Receivable days (debtors)
Receivables / sales revenue x 365
Inventory turnover
IT = cost of goods sold / average inventory held
ARR %
ARR = (net return from project / nr of years) / initial cost
SCORE
Application,
S = size & sector
C = costs, customers, & competition
O = ownership & objectives
R = resources
E = external environment
HWH
Analysis,
H = how X could lead to this initial effect Y
W = why initial effect Y leads to Z
H = how Z impacts the business
AJIM
Evaluation,
A = answer the question
J = justify judgment
I = it depends on
M = most important reason leading to judgement
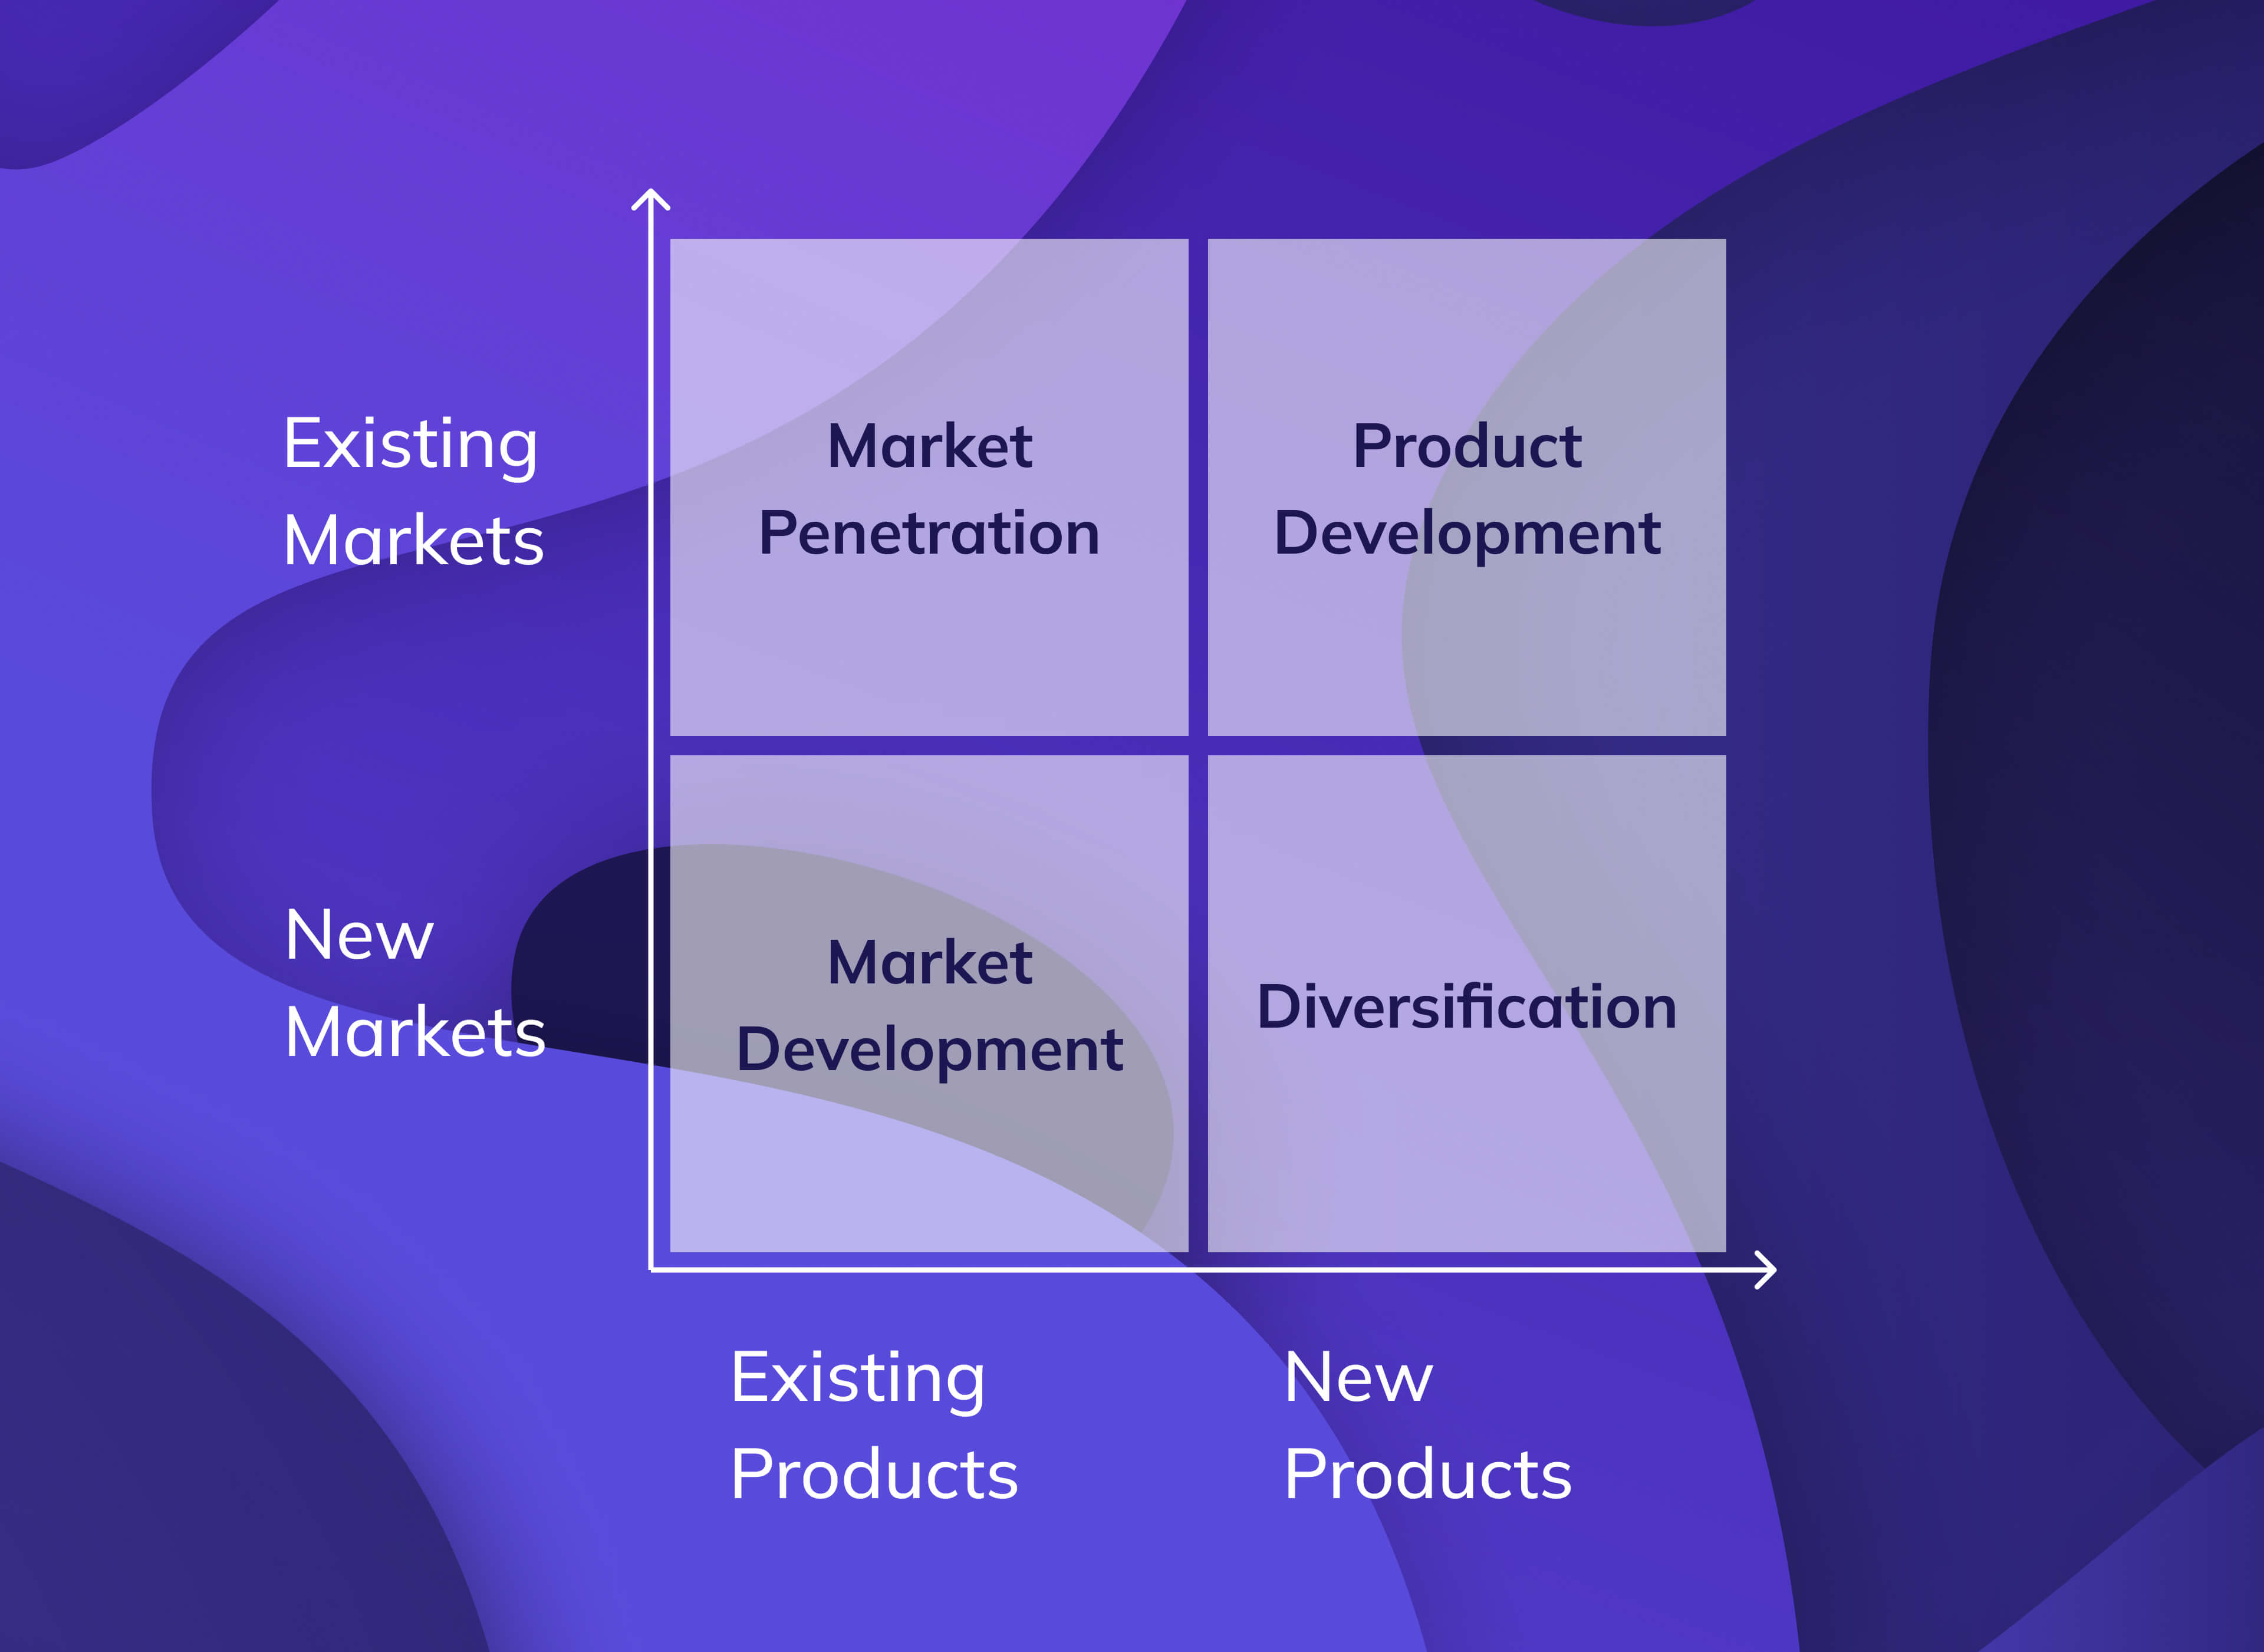
Ansoff’s matrix
4 marketing strategies depending on the relative risk of the respective market and product
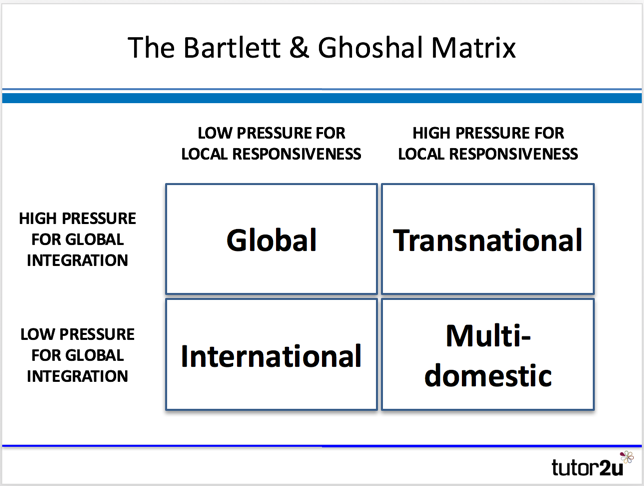
Bartlett & Ghoshal model
Options to manage international operations based on local responsiveness & global integration
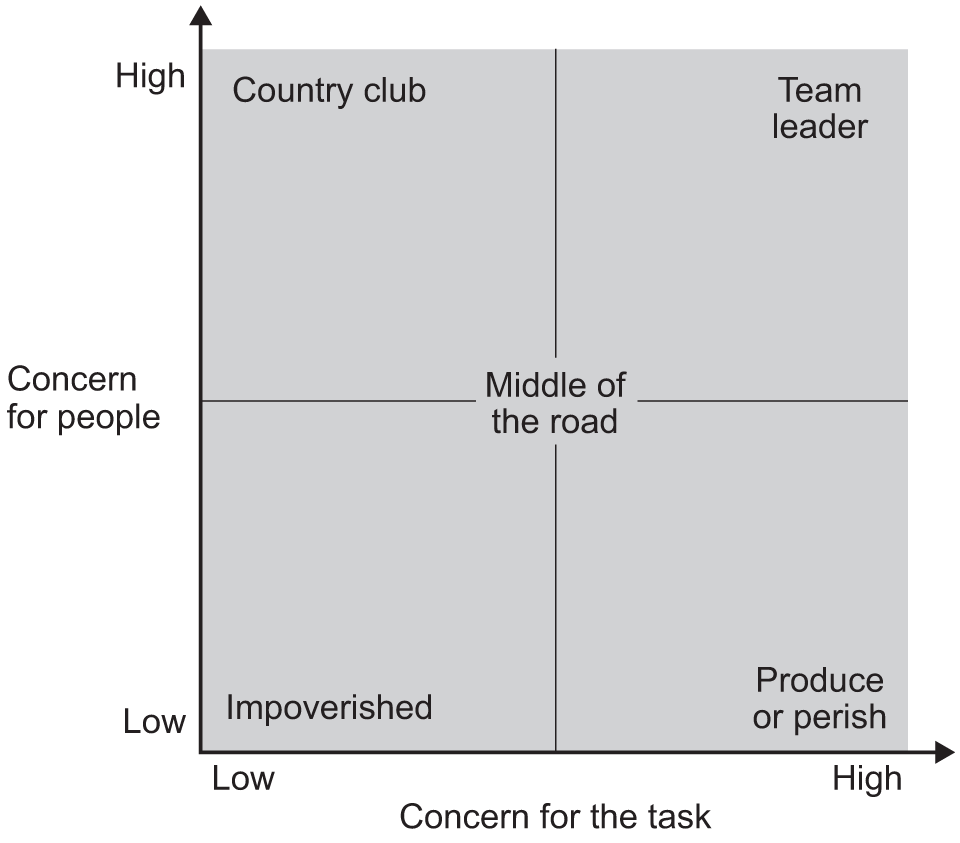
Blake - Mouton grid
5 management styles based on concern for task & people
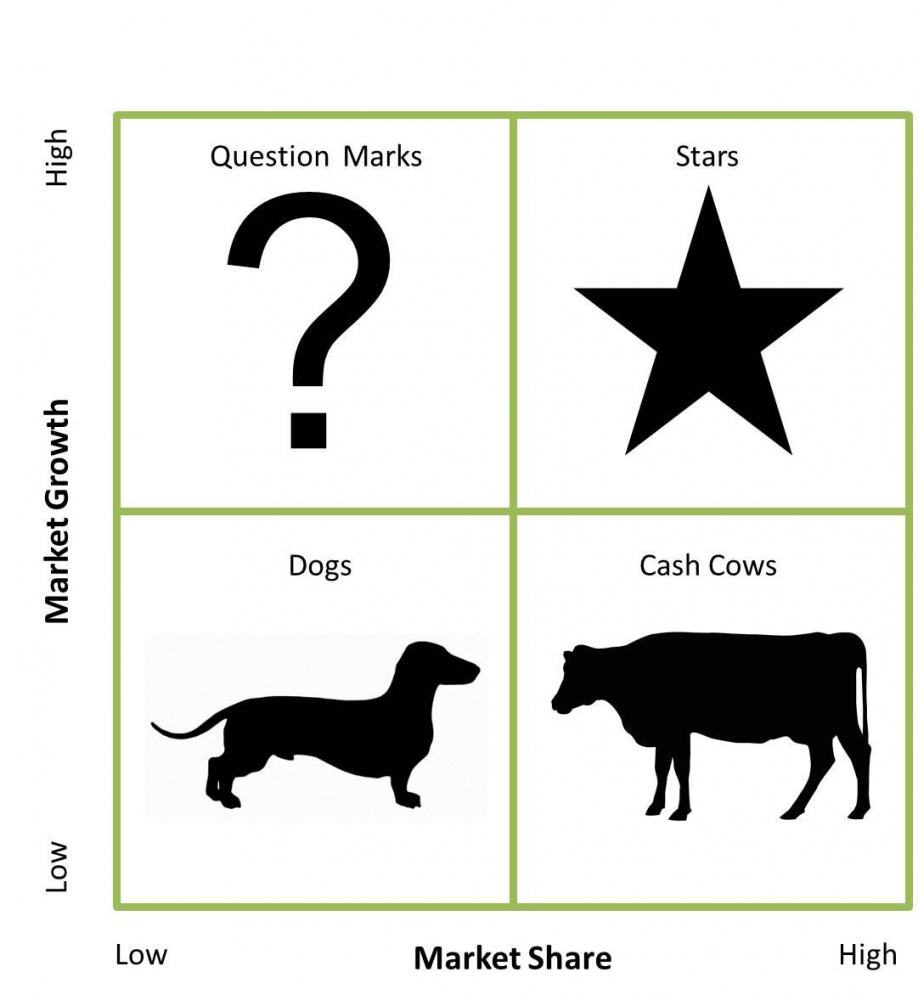
Bostons’ matrix
Product positioning based on relative market growth and market share
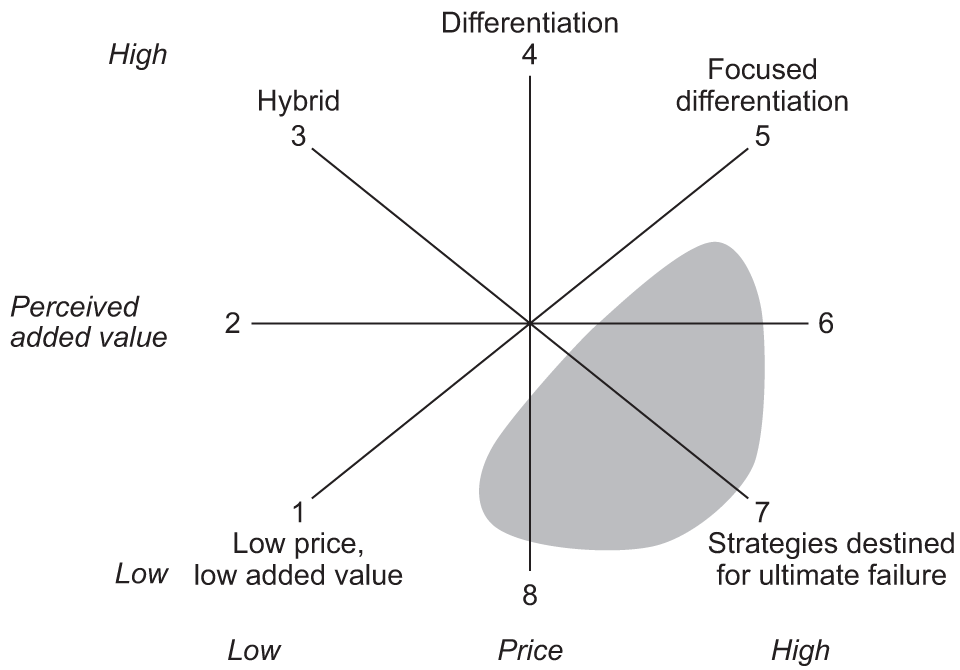
Bowman’s strategic clock
8 product positions based on price an perceived value
6,7,8 = strategic failure (risky high margins, monopoly pricing, loss of market share)
3,4,5 = best strategy as profit & perceived value are highest (hybrid, differentiation, focused differentiation)
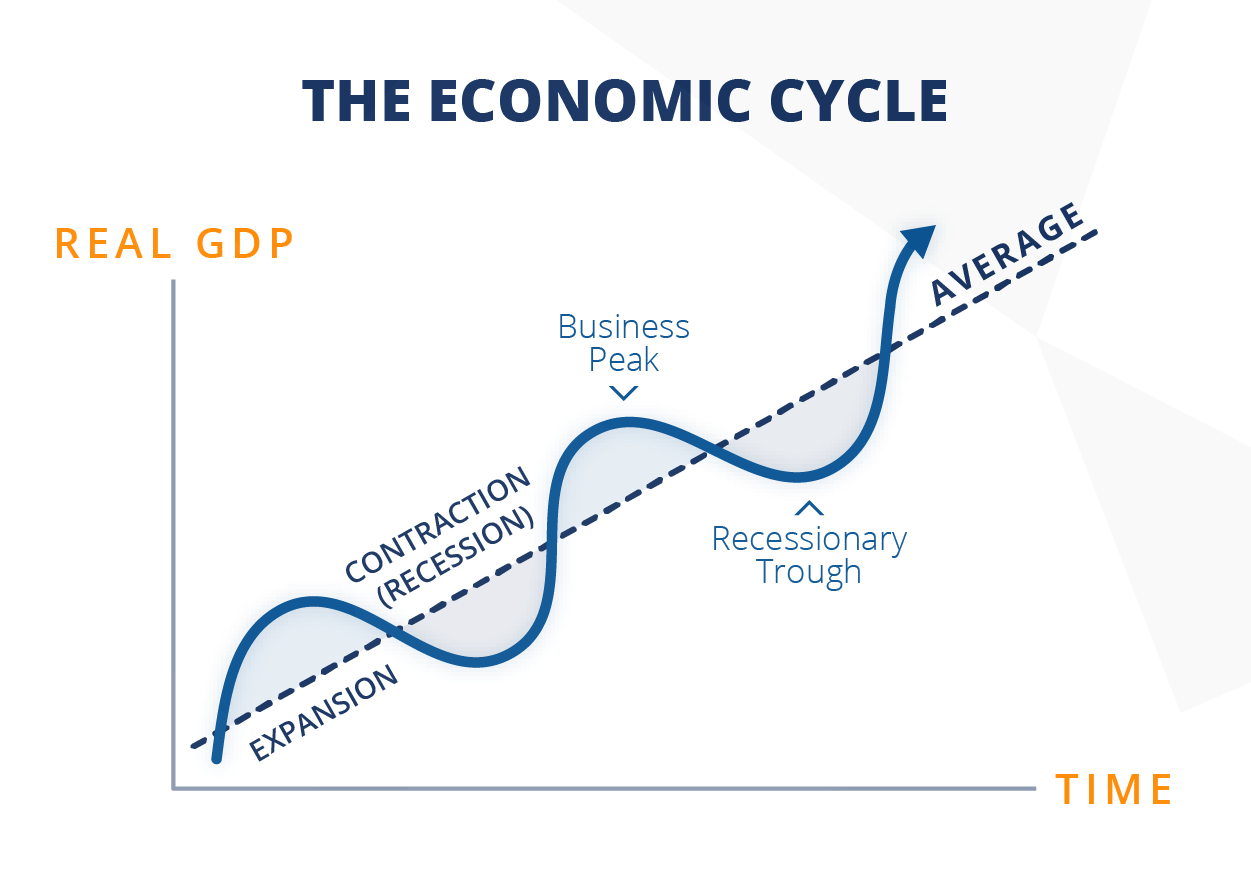
Business cycle
Phases of expansion and contraction of the economy
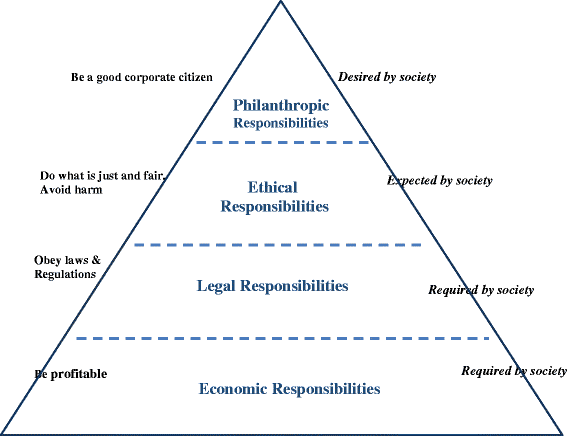
Carrol’s CSR pyramid
Economic - Legal - Ethical - Philanthropic
Elkintons triple bottom line
Profit, People, Planet
The model highlights that business performance may be measured in a number of ways: in relation to its finances, its environmental impact and how socially responsible it is in relation to employees.
Elkington argued that only a company that was measuring performance in all three areas was measuring the full costs of its activities. The significance of this is that if you measure all these areas employees are likely to pay attention to them and change their behavior accordingly (rather than just focusing on profit).
The experience curve
Unit costs fall as cumulative production increases
more experience = less mistake = lower costs
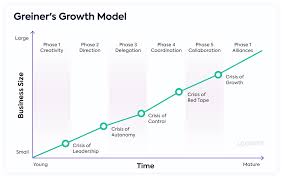
Greiner’s growth model
6 phases & 5 crisis
creativity & leadership
Direction & autonomy
Delegation & control
Coordination & red tape
Collaboration & growth
Alliances
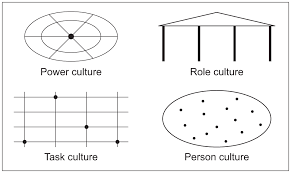
Handy’s cultural model
4 types of cultures
power based (few have power, few rules, intuition based)
Role based (role derived power, little scope, bureaucracy)
Task based (Teams for particular projects, Power derives from expertise, Matrix organisation)
Person based (ability based power, person before business, very similar training/expertise)
Hofstede’s national cultures
6 ways culture varies in different countries
individual vs collective
Power distance
Short vs long-termism
Masculinity vs femininity
Uncertainty avoidance
Indulgence vs restraint
Kaplan & Nortons balanced scorecard
4 perspectives that give management a broader view of business performance
vision & strategy
Financial
Internal processes
Organisational capacity
Customer
Kotter & Schlesinger
4 causes and 6 solutions to resistance to change
Causes:
Self-interest
Disagree with the situation/method
Low tolerance for change
Misinformation/misunderstanding
Solutions:
education & communication
Participation & involvement
Support
Manipulation & co-option
Negotiations & bargaining
Explicit & implicit coercion
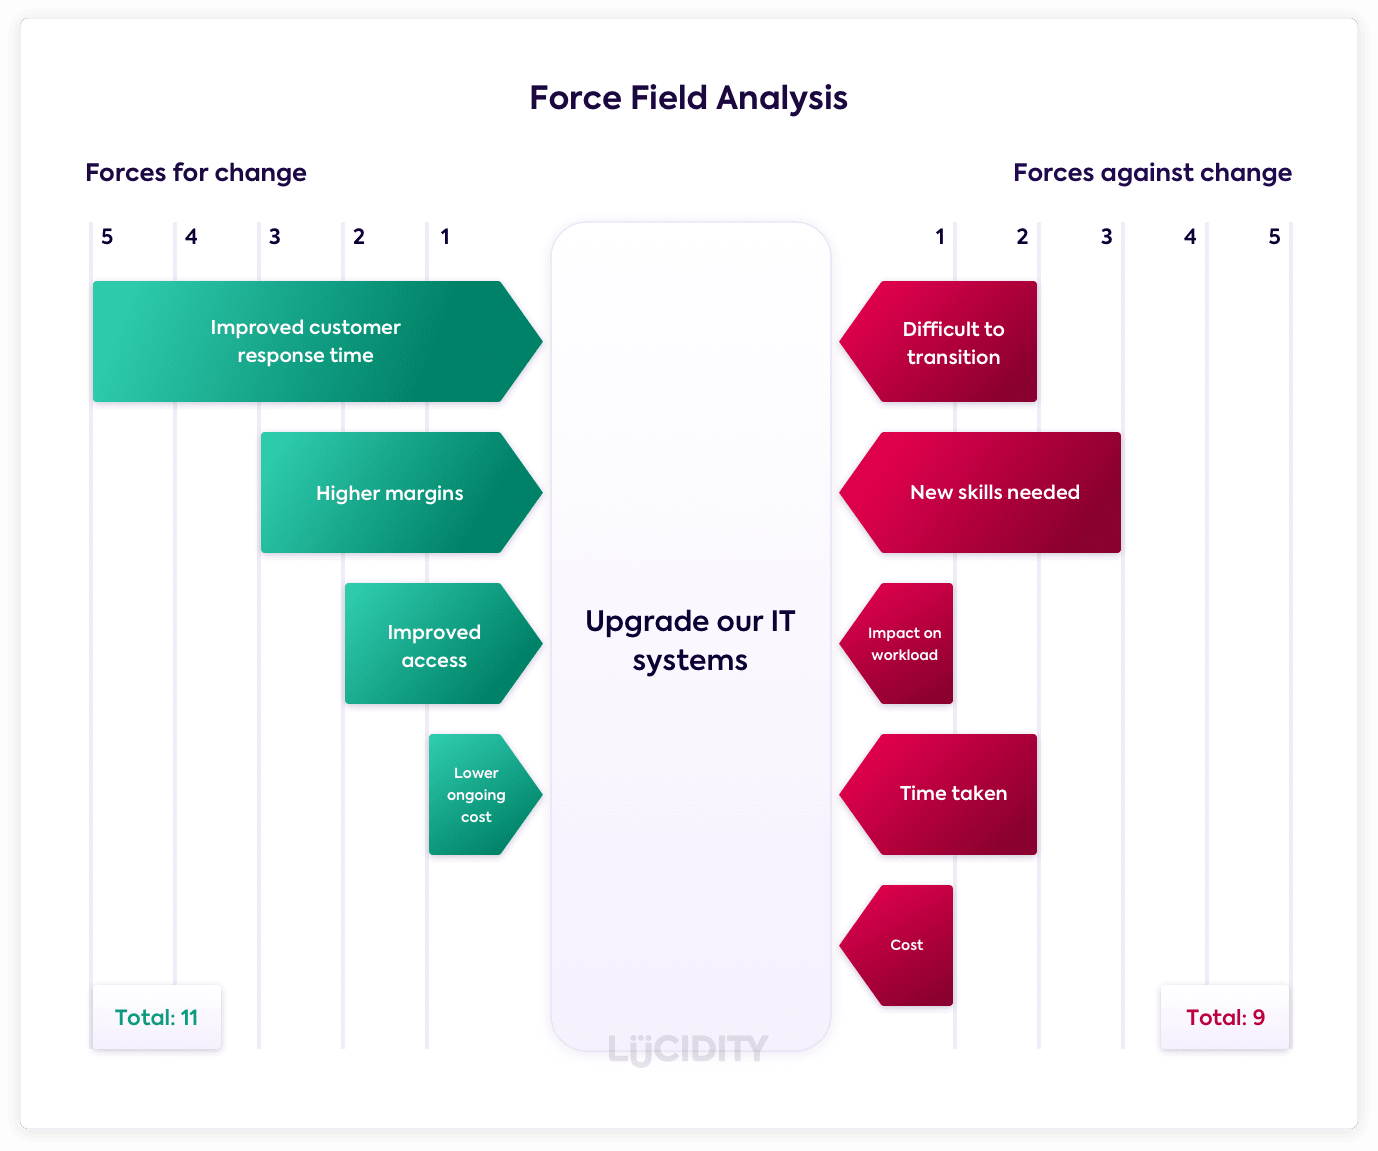
Lewin’s field force analysis
Driving forces vs restraining forces to determine/calculate wether change is viable
simplistic
Doesn’t quantify each force
Market mapping
Mapping to determine competitive position regarding price and quality
Utilises a x & y axis, where the x-axis = quality, and the y-axis = price
Extended marketing mix (7 P’s)
Price
Promotion
Place
Physical environment
People
Process
Product
Masllow’s hierarchy of needs
Physiological - safety - social - esteem - self actualisation
Pestle analysis
External influences that affect strategy
Political
Economic
Social
Technological
Legal
Ethical/Environmental
Porters’ 5 forces
5 forces which analyse the nature of the competitive environment
rivalrous intensity
Threat of substitutes
Threat of new entrants
Bargaining power of suppliers
Bargaining power of customers
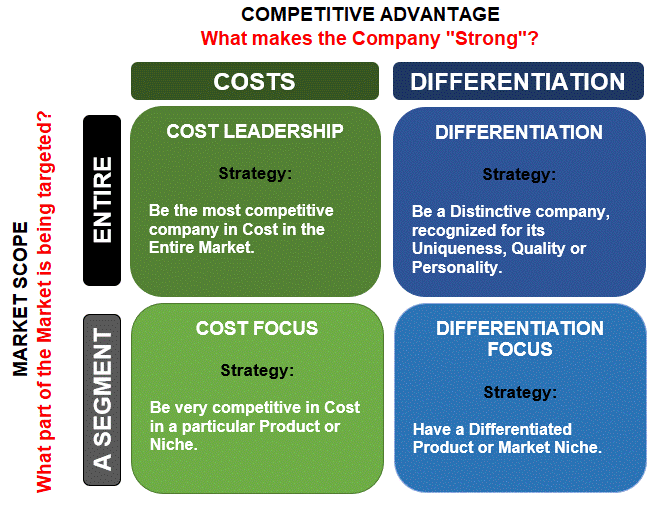
Porters’ generic strategies
Generic strategies to utilise/create a competitive advantage based upon the nature of this advantage (cost or differentiation) and the nature of the market (broad or narrow)
cost leadership (cost & broad)
Cost focus (cost & narrow)
Differentiation leadership (differentiation & broad)
Differentiation focus (differentiation & narrow)
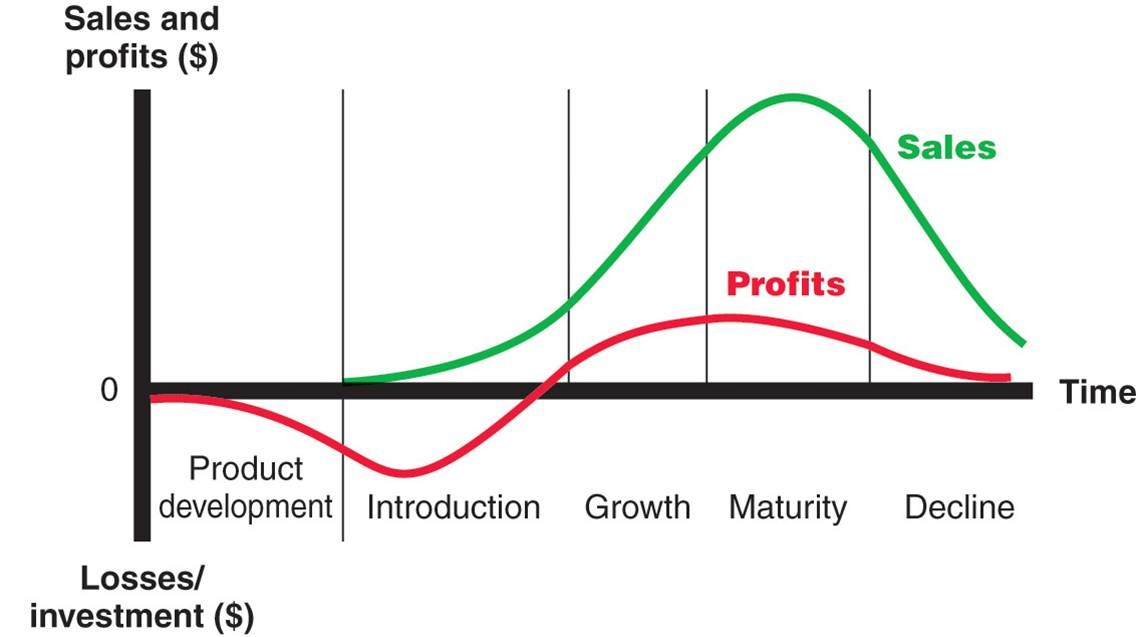
Product life cycle
research & development
Introduction
Growth
Maturity
Decline/extension
Scientific decision making process
set objectives - gather data - analyse data - select - implement - review
STP (marketing)
3 marketing strategy choices
Segmentation:
demographic, geographic, income, behaviour
Targeting:
mass (mass), segmented (differentiated), concentrated (niche)
Positioning:
place a product occupies in the consumers mind relative to competing products
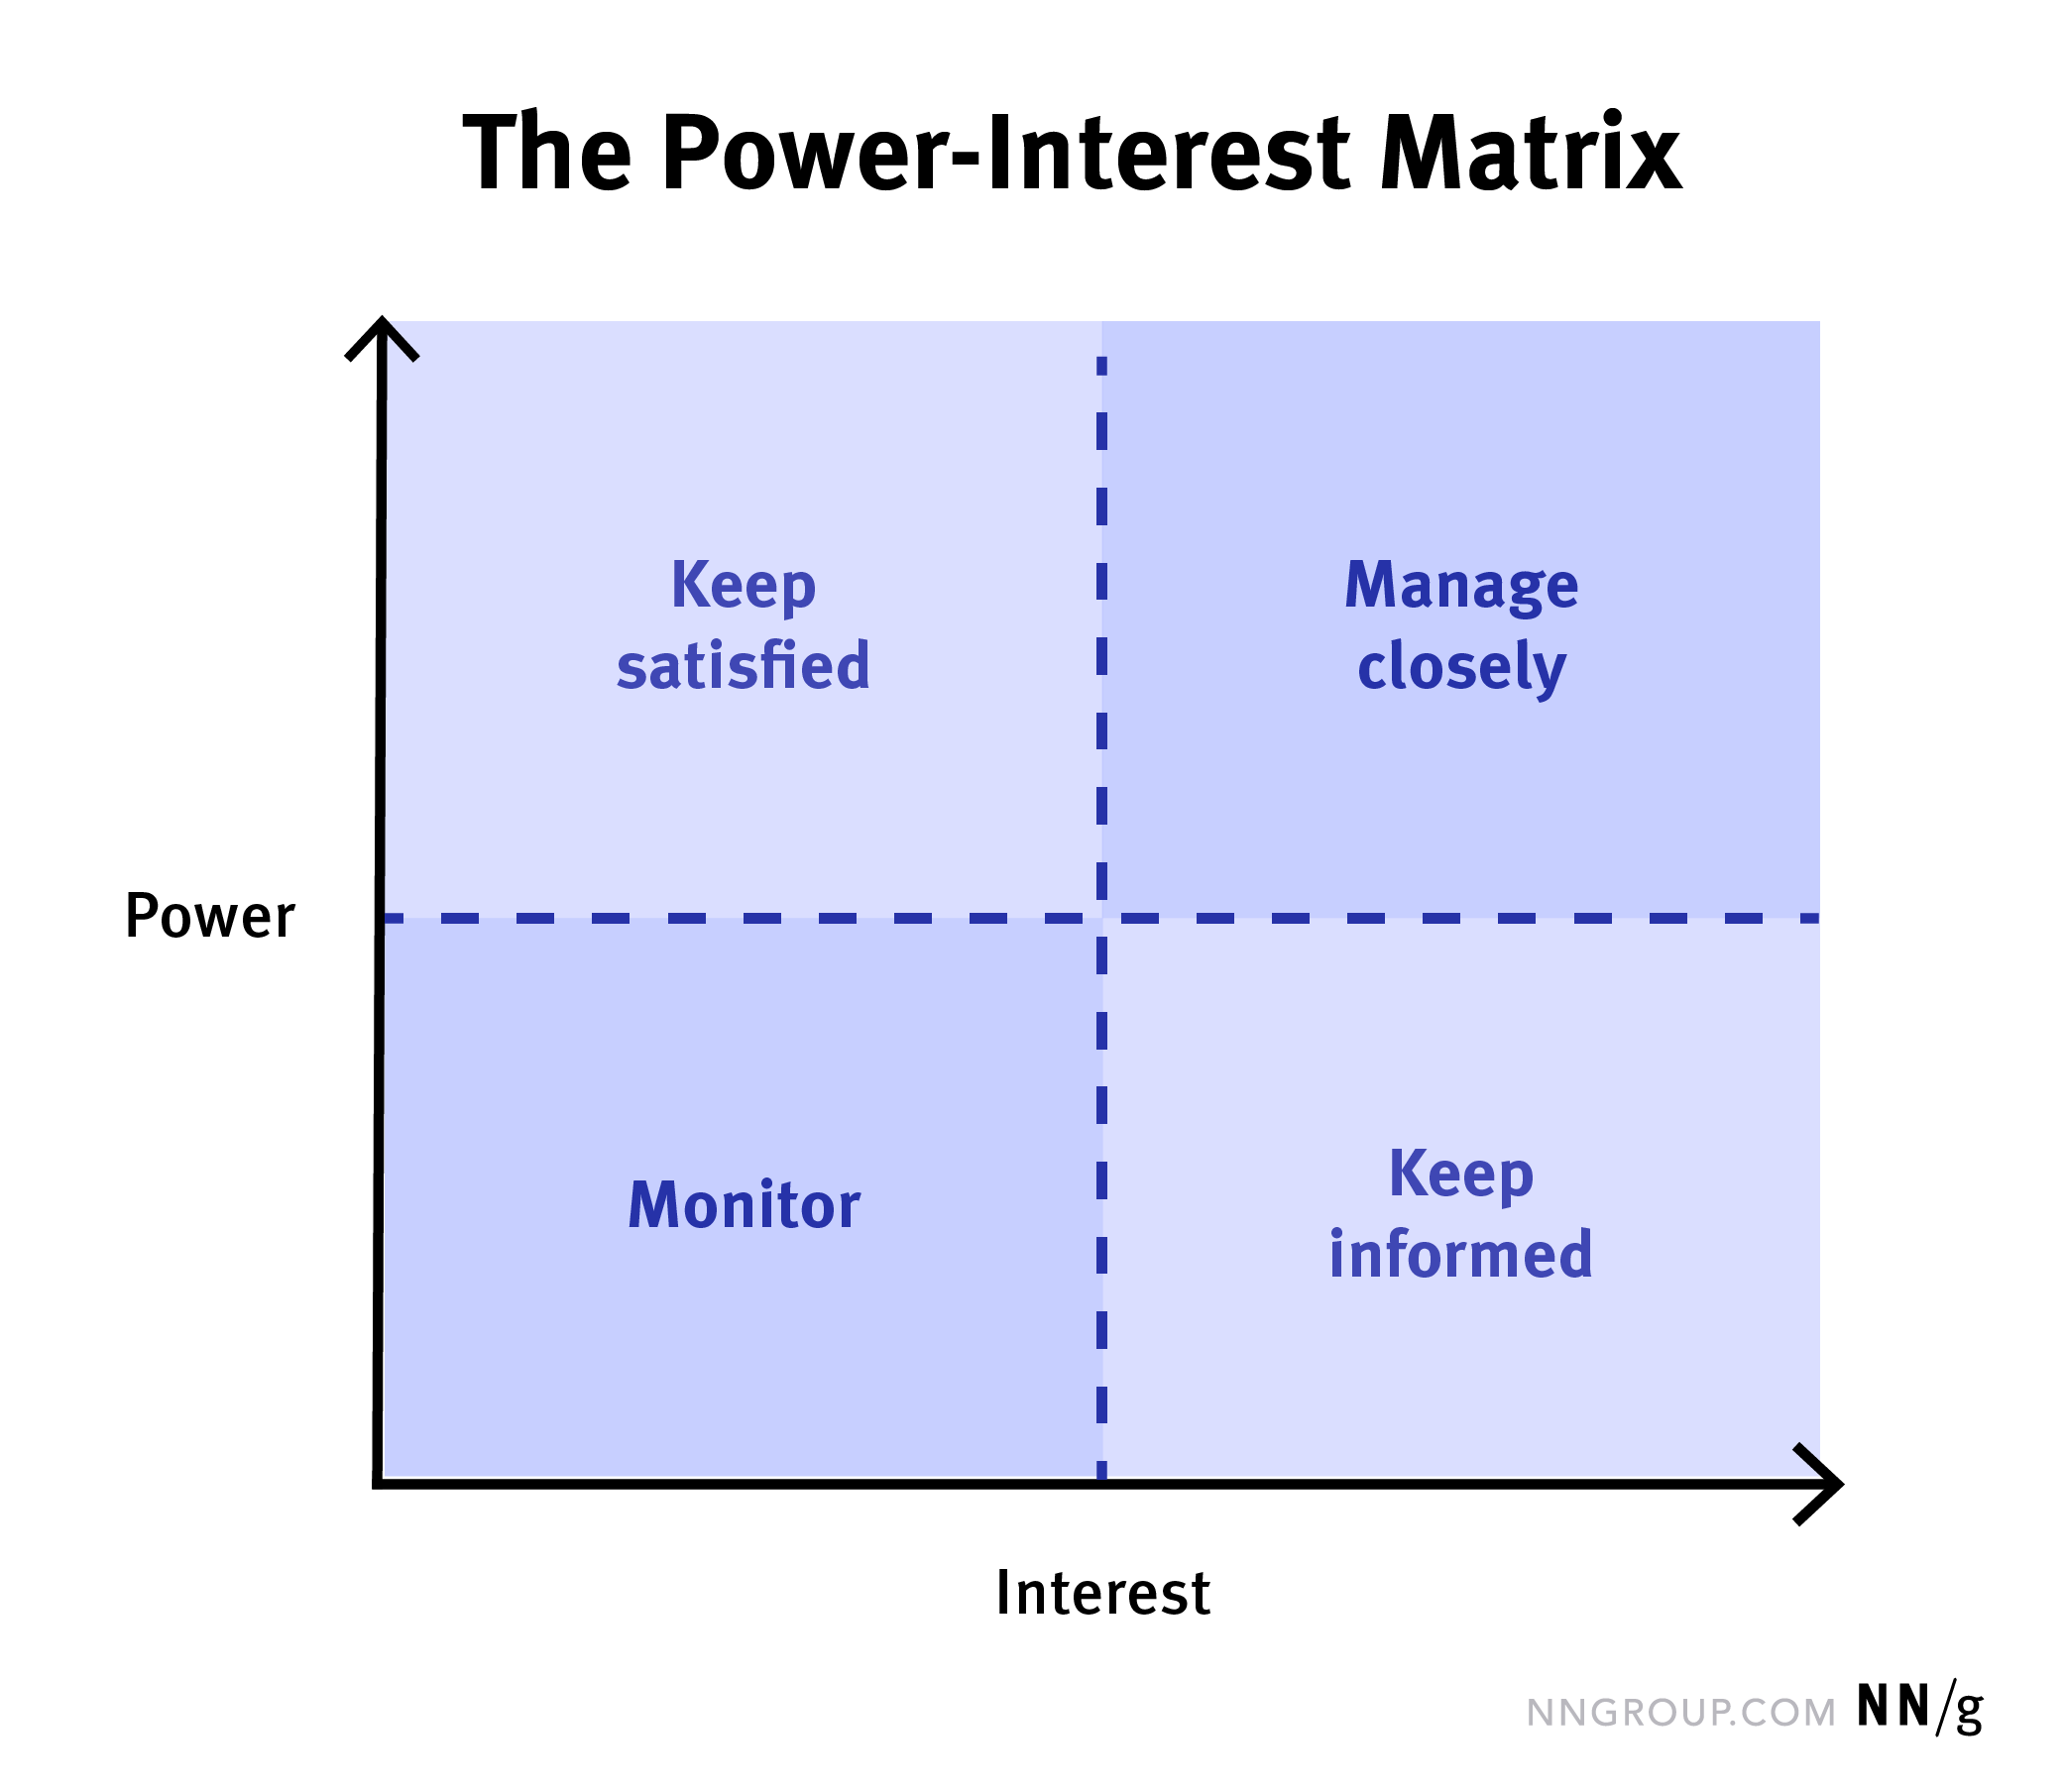
Stakeholder mapping
Stakeholder approach based upon stakeholder interest & power
low & low = monitor
Low interest & high power = keep satisfied
High interest & low power = keep informed
High & high = manage closely
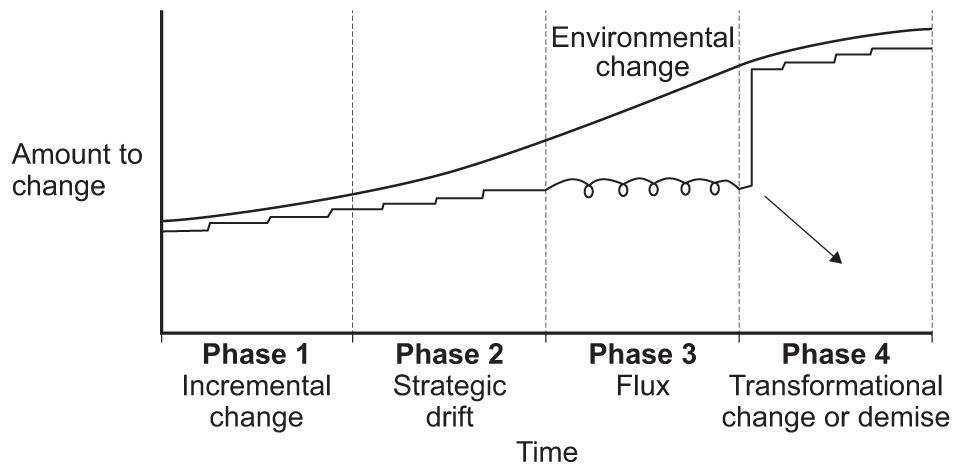
Strategic drift
When strategy diverts from the change that is needed to adapt to its external environment
incremental change
Strategic drift
Flux
Step transformation or death
Swot analysis
Analysis of internal & external pressures affecting a business
Strenght
Weaknesses
Opportunities
Threats
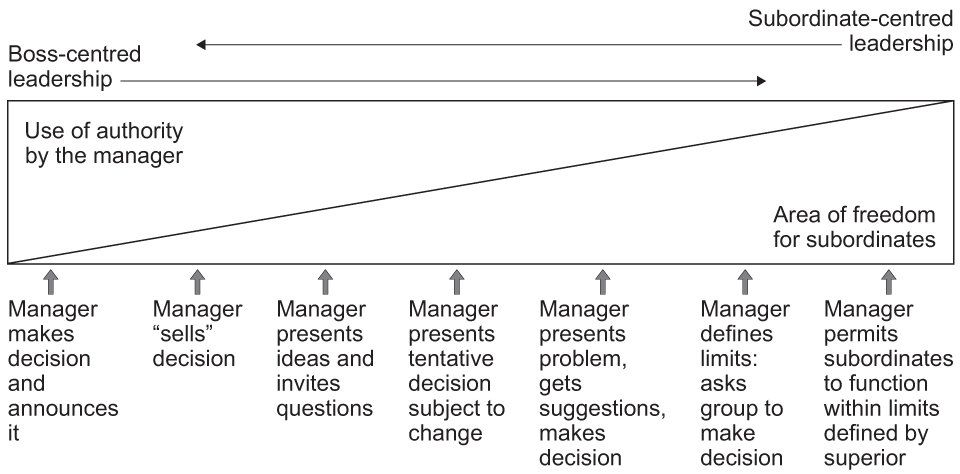
Tannenbaum Schmidt continuum
Managerial positioning based upon how much freedom they allow subordinates (from autocratic to democratic) (from authoritarian to laissez-faire)
Tell - Sell - Consult - Join
Variance formula
Actual - Budget
Income statement
Statement recording all inflows & outflows of cash, revenue (+other incomes) and expenditures
Balance sheet
Statement recording all assists and liabilities a firm has