What is a One Sample T-Test
Used to test a claim about a population mean
Null Hypothesis for One Sample T-Test
μ = #
Alternate Hypothesis for One Sample T-Test
μ > #
μ < #
μ ≠ #
Conditions for One Sample T-Test
1) Sample is random
2) Sampling distribution is approximately normal ( a. If n≥30 , assumed by CLT b. if n≤30 this condition needs to be checked with a histogram)
What is in the Calculation step of a One Sample T-Test
T-value, P-Value and Degrees of Freedom
Formula for One Sample T-Test
Calculator: Stats, Tests, 2
Formula for Degrees of Freedom in a One Sample T-Test
df = n-1
Conclusion for One Sample T-Test
Since the P-value of ___ is less than/greater than the α-level of .05, we reject/fail to reject the H0. In other words, there is/isn’t statistically significant evidence to support the HA that ___ (context)
What is a One Sample T-Interval?
Used to give a plausible range of values for population mean
Conditions for One Sample T-Interval
1) Sample is random
2) Sampling distribution is approximately normal ( a. If n≥30 , assumed by CLT b. if n≤30 this condition needs to be checked with a histogram)
What is needed for the Calculation step of a One Sample T-Interval
Range of values, Degrees of Freedom
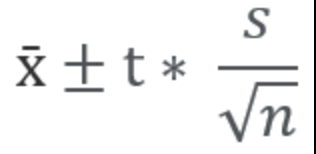
Formula for One Sample T-Interval
Calculator: Stats, Tests, 8
Formula for Degrees of Freedom in a One Sample T-Interval
df = n-1
Conclusion for One Sample T-Interval
We are ___% confident that the true mean of ___ (context) lies between ___(lower bound) and ___(upper bound) ___ (units)
What is a Two Sample T-Test
Used to test a claim about a difference of population means
Null Hypothesis for Two Sample T-Test
H0: μ1 = μ2
Alternate Hypothesis for Two Sample T-Test
μ1 > μ2
μ1 < μ2
μ1 ≠ μ2
What is needed in the Calculation Step of a Two Sample T-Test
T-Value, P-Value and Degrees of Freedom
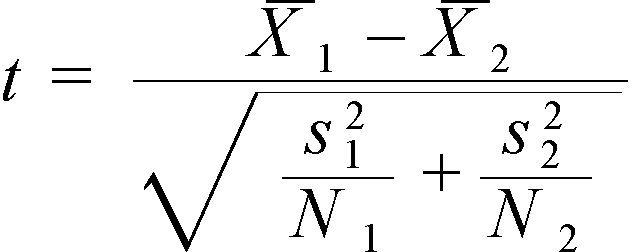
Formula for Two Sample T-Test
Calculator: Stats, Tests, 4,
Conclusion for Two Sample T-Test
Since the P-value of ___ is less than/greater than the α-level of .05, we reject/fail to reject the H0. In other words, there is/isn’t statistically significant evidence to support the HA that ___ (context)
What is a Two Sample T-Interval
Used to give a plausible range of values for a difference in population means
Conditions for a Two-Sample T-Interval
1) Sample are random and independent
2) Sampling distributions are approximately normal ( a. If n1,n2≥30, assumed by CLT b. if n1,n2≤30 this condition needs to be checked with a histogram(s)
What is needed in the Calculation step of a Two Sample T-Interval
T-Value, P-Value and Degrees of Freedom
Formula for Two Sample T-Interval
Calculator: Stats, Tests, 0
Conclusion for Two Sample T-Interval
We are ___% confident that the true difference in the mean of ___ (context) lies between ___(lower bound) and ___(upper bound) ___
What is a Paired T-Test
Used to test a claim about a difference population means for dependent data
Null Hypothesis for Paired T-Test
μd = 0
Alternate Hypothesis for Paired T-Test
μd > 0
μd < 0
μd ≠ 0
Conditions for Paired T-Test
1) Matched Pairs Design: Subjects are randomly assigned treatments
Repeated Measures Design: The order in which subjects received treatments was random
Sample is random (sample, not experiment)
2) Sampling Distribution of differences is approximately normal
What do you need for the Calculation step of a Paired T-Test
T-Value, P-value, and Degrees of Freedom
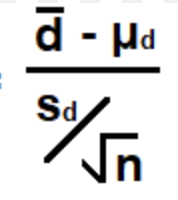
Formula for Paired T-Test
Calculator: Stats, Tests, 2
Formula for Degrees of Freedom in a Paired T-Test
df = n-1
Conclusion for Paired T-Test
Since the P-value of ___ is less than/greater than the α-level of .05, we reject/fail to reject the H0. In other words, there is/isn’t statistically significant evidence to support the HA that ___ (context)
What is a Paired T-Interval
Used to give a plausible range of values for the difference in population means for dependent data
Conditions for a Paired T-Interval
1) Matched Pairs Design: Subjects are randomly assigned treatments
Repeated Measures Design: The order in which subjects received treatments was random
Sample is random (sample, not experiment)
2) Sampling Distribution of differences is approximately normal
What is needed for the Calculation step of a Paired T-Interval
Range of values and Degrees of Freedom
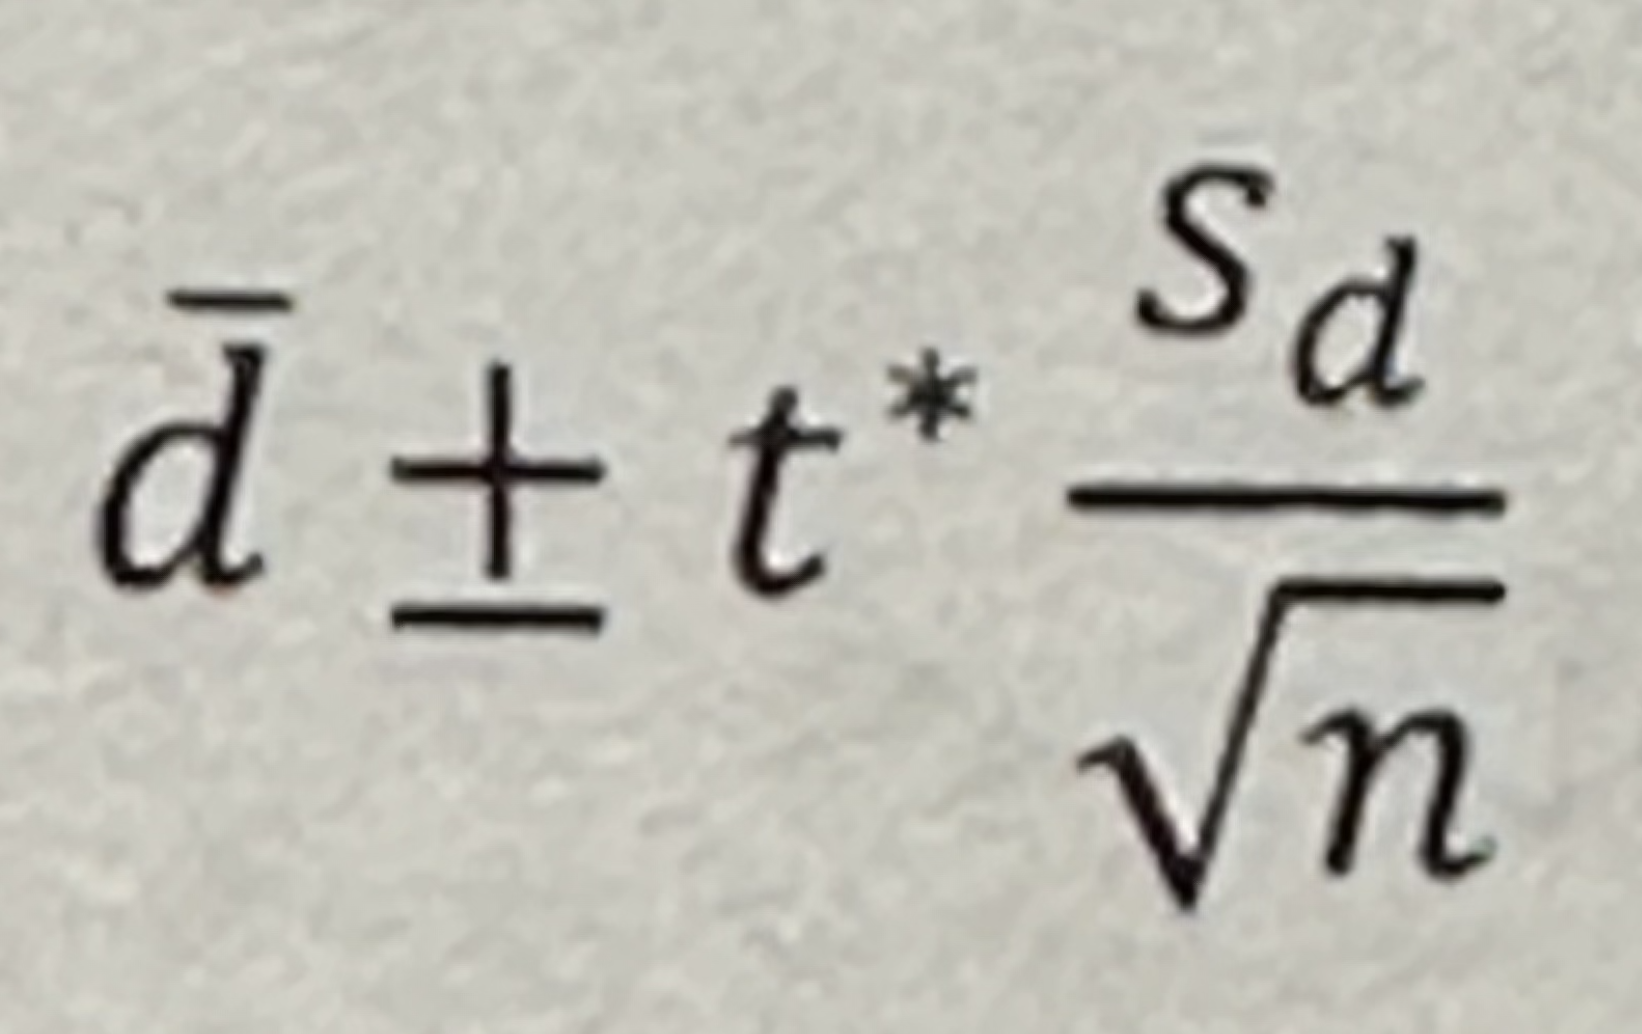
Formula for Paired T-Interval
Calculator: Stats, Tests, 8
Formula for Degrees of Freedom in a Paired T-Interval
df = n-1
Conclusion for Paired T-Interval
We are ___% confident that the true differences in the mean of ___ (context) lies between ___(lower bound) and ___(upper bound) ___
What is a X² Goodness of Fit Test
Used to test a claim that the proportions of a single categorical variable are consistent with some expectation
Null Hypothesis for X² Goodness of Fit Test
The data is consistent with what we expect
Alternate Hypothesis for X² Goodness of Fit Test
The data is no consistent with what we expect
Conditions for X² Goodness of Fit Test
1) Sample is random
2) Expected frequencies are at least 5 (Create a table with Observed and Expected, computed using the given proportions/ratios for the sub-categories)
What is needed for the Calculation step of a X² Goodness of Fit Test
X² Value, P-value, and Degrees of Freedom
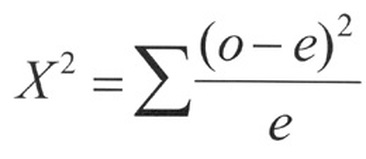
Formula for X² Goodness of Fit Test
Calculator: Stats, Tests, D
Formula for Degrees of Freedom in a X² Goodness of Fi
df = n-1
Conclusion for X² Goodness of Fit Test
Since the P-value of ___ is less than/greater than the α-level of .05, we reject/fail to reject the H0. In other words, there is/isn’t statistically significant evidence to support the HA that ___ (context)
What is a X² Independence Test
Used to test if two categorical variables are independent of one another
Null Hypothesis for X² Independence Test
There is no association between ___ and ___
Alternate Hypothesis for X² Independence Test
There is an association between ___ and ___
Conditions for X² Independence Test
1) Sample is Random
2) Expected Frequencies are at least 5 | (row total*column total)/grand total
What is needed for the Calculation step of the X² Independence Test
X² Value, P-Value, and Degrees of Freedom
Formula for X² Independence Test
Calculator: Stats, Tests, C
Formula for Degrees of Freedom of a X² Independence Test
df = (r-1)(c-1)
Conclusion for X² Independence Test
Since the P-value of ___ is less than/greater than the α-level of .05, we reject/fail to reject the H0. In other words, there is/isn’t statistically significant evidence to support the HA that ___ (context)
What is a X² Homogeneity Test
Used to test if the distribution of the sub-categories of a single categorical variable is the same for multiple populations
Null Hypothesis for X² Homogeneity Test
The distribution of ___ is the same for ___ and ___
Alternate Hypothesis for X² Homogeneity Test
The distribution of ___ is not the same for ___ and ___
Conditions for X² Homogeneity Test
1) Samples are random and independent
2) Expected frequencies are at least 5 (row total*column total)/grand total
What do you need for the Calculation step of the X² Homogeneity Test
X² Value, P-value, Degrees of Freedom
Formula for X² Homogeneity Test
Calculator: Stats, Tests, C
Formula for Degrees of Freedom for X² Homogeneity Test
df = (r-1)(c-1)
Conclusion for X² Homogeneity Test
Since the P-value of ___ is less than/greater than the α-level of .05, we reject/fail to reject the H0. In other words, there is/isn’t statistically significant evidence to support the HA that ___ (context)