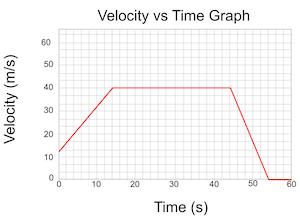
(Speed, Time) diagram
A graph showing the speed against time taken (v,t Diagram)
Acceleration
Increase in speed per second (Increasing velocity)
Deceleration
Reduction in speed per second (Decreasing velocity)
Uniform Motion
A movement in which speed remains constant
Uniform Acceleration
Movement in which speed is increasing at a steady rate
Uniform Deceleration
Movement in which speed is decreasing at a steady rate
(Displacement, time) Diagram
A graph showing the position against time taken
(x, t diagram)
Δ
Delta
Average Velocity
S ÷ T or ΔX ÷ ΔT
Acceleration
ΔV ÷ ΔT
ΔV
Vf – Vi
ΔT
Tf – Ti
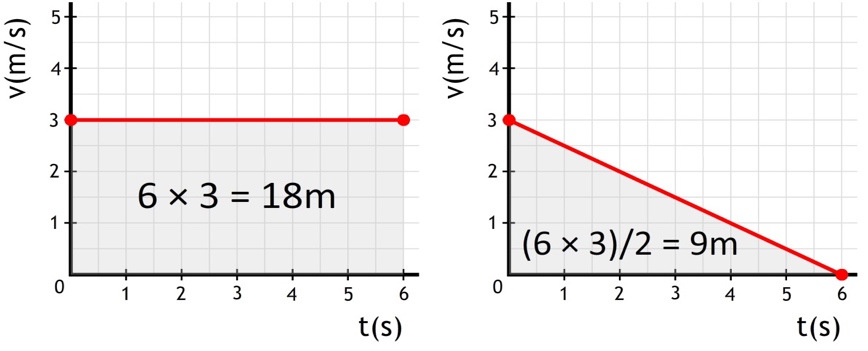
Distance covered
L x W (Length x Width) or ½ X L x W
Inertia
Degree to which an object can change speed or direction
Newton’s 2nd law
Fres= m x a
Acceleration due to gravity
Acceleration with which objects move towards the earth in free fall (Fg= m x g)
Free fall
When only gravity is acting on an object
Reaction time
Time between seeing the hazard and the brakes being applied
Reaction distance
Distance covered by a vehicle during the reaction time
Braking distance
Distance covered by a vehicle while braking
Calculation
Stopping distance
Reaction time + Braking distance
Crumple zone
Parts at the front and back of a car, that are designed to collapse at impact/collision
Average velocity (Vav)
s÷t
Acceleration (a)
v÷t
Vav
Velocity average
Vf
Velocity final
Vi
Velocity initial