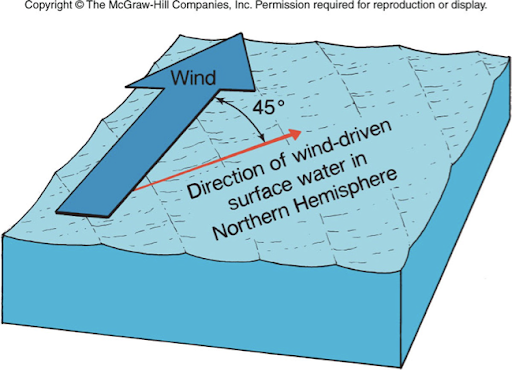
Direction of Wind-Driven Surface Water in Northern Hemisphere
Coriolis effect determines the direction of the wind-driven surface water
In the northern Hemisphere it is 45 degrees to the right of the wind direction, in the southern hemisphere it is to the left of the wind-direction
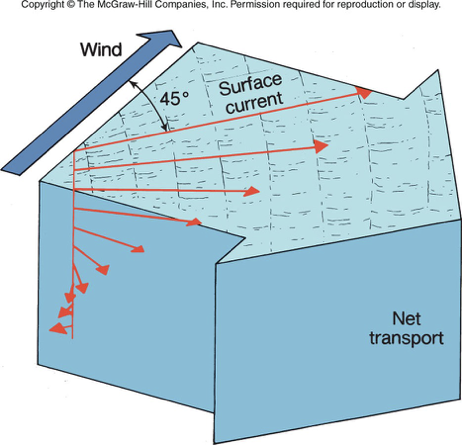
Ekman Spiral
Affects surface water only
Surface current movement is caused by the wind
Red arrows denote direction and speed of the surface current
Speed of current decreases through the water column (decrease in length of red arrows)
Displacement in relation to the wind direction increases with depth
Surface starts at 45 degrees and in each subsequent deeper layer the displacement increases
If water movement is integrated from the top of the Ekman spiral to the bottom of the Ekman spiral, we find that the net transport is 90 degrees to the right of the wind direction
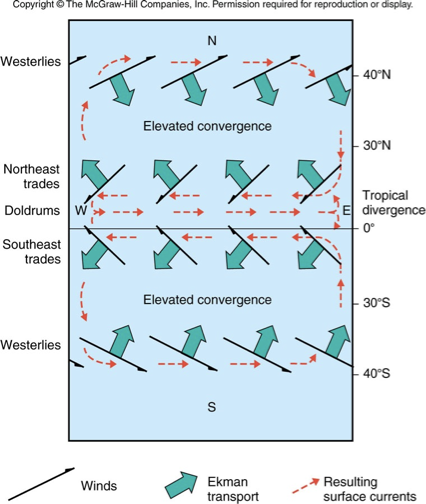
Ocean Current Model
Winds named for direction they blow FROM
Northern hemisphere, two wind systems are the Westerlies and the Northeast trade winds
Westerlies blow from the southwest to the northeast
The resulting net Ekman transport pushed water towards the Southeast (see figure
The northeast trade winds blow from the northeast and result in a net Ekman water transport towards the northwest (see figure)
The result in the northern hemisphere is water being pushed towards the center, forming an elated convergence
Same reasoning for southern hemisphere (Coriolis effect deflects to the left in southern hemisphere)
The dashed red arrows show the resulting clockwise movement of the northern hemisphere gyres
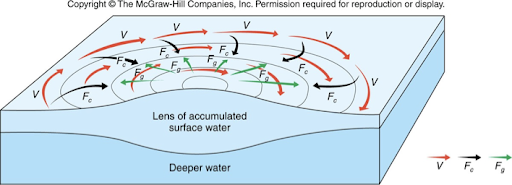
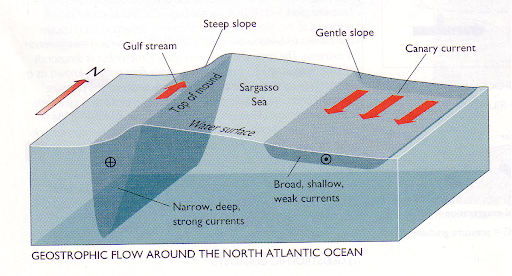
Geostrophic Flow
Start with the black arrow. This is the net Ekman transport, pushing water into the center of the gyre as a result of the Coriolis effect. Fc denotes the Coriolis effect. We are in the northern hemisphere. A hill of accumulated water will form
Then the green arrows: The water on the hill will be pulled straight down the hill by gravity, resulting in a flow according to the green arrow
Then the red arrows: the water flowing downhill will be deflected to the right, by the Coriolis effect, giving a clockwise flow
Geostrophic clockwise flow results when the black and green arrows balance
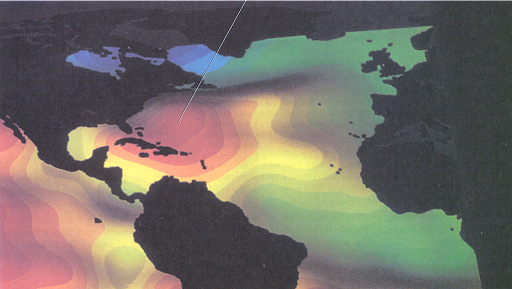
Sea Surface Elevations
The accumulated water in the center of the gyre actually cause a hill in the ocean surface
The warm colors in the figure denote areas where the sea surface is higher than the mean sea surface level
The hill in the ocean surface can be as high as 100 m or 30 ft
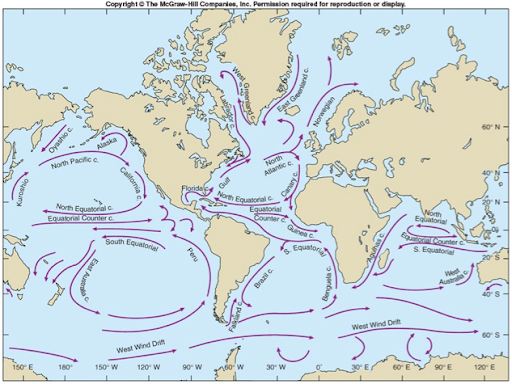
Ocean Current Map
Know names of ocean currents
Many currents follow same naming convention. Note how the northern sections od the currents in the North Atlantic and the North Pacific are simply called the North Pacific and the North Atlantic Current respectively
Close to equator, there are 3 currents with the same name in the Pacific, the Atlantic, and the Indian Oceans
Southern Section of the Southern Hemisphere gyres are all part of the West Wind Drift
It is only continuity currents, the western and eastern currents of the gyres that have own specific names
Western Intensification
Occurs bc the Earth spins towards the east and ocean has inertia
As Earth moves, water in oceans can’t quite follow and piles up on the western side of all ocean basins
The pile pushes on the western continuity current, which becomes deeper, barrow and faster
The opposite occurs on the eastern side where water has been removed - the eastern current are wide, shallow and slow-moving
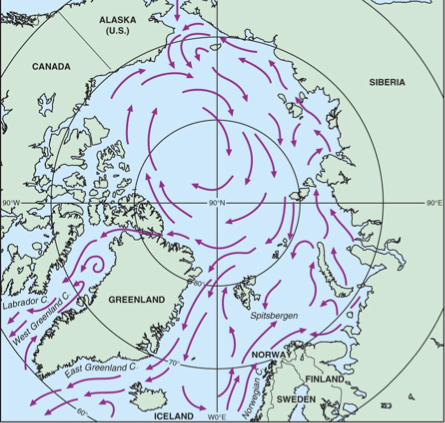
Arctic Ocean Circulation
The Arctic has its own gyre, which is not centered over the north pole but displaces to the west
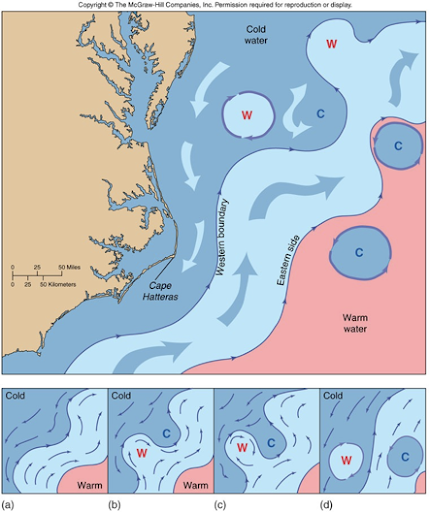
Eddies
Like rivers on land, ocean currents do not go straight but meander
Eddies are formed from this meanders
Look at bottom 4 figures:
A: the dark blue line with arrows that outlines the western boundary of the Gulf Stream will give you the spinning direction on the eddy
B: the meander has become big enough that it has started pinching f two eddies
C: outlining blue line in the W (warm) eddy gives you spinning direction
D: the warm eddy pinches off and goes into the cold wter
The cold water eddy travels through the Gulf Stream and into the warmer water on the east side of the Gulf Stream
Outlining blue line of the C (cold) eddy gave the spinning direction
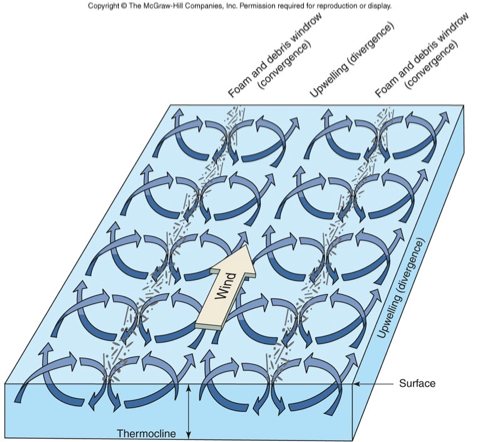
Langmuir Cells
Langmuir cells are small scale patterns that occur in the surface mixed layer (SML)
Wind starts small circulation cells that have the diameter of the SML depth
Where the circulation cells meet and go down, we have a small downwelling area
In coastal areas, the ocean surface often has some debris
This debris will be concentrated in the downwelling area and causes wind rows
Causes of Convergence and Divergence Zones
Convergence and divergence zones can occur from several different current patterns
Top figure
Divergence means we have upwelling
Upwelling causes thermocline to bulge upwards
Convergence means we have down welling
Down welling causes thermocline to be depressed
Bottom figure
Upper 3 figures show examples of current patterns that result in a DIVERGENCE zone
Lower 3 figures show examples of current pattern that result in a CONVERGENCE zone
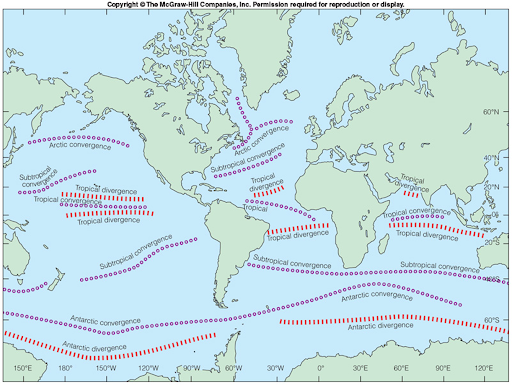
Convergence/Divergence Zones
Map shows global convergence and divergence zones formed from the surface current patterns shown in the previous figure
Notice how the naming convention is pretty simple
Start at tropical convergence path and go south
In order, we find the tropical divergence, the subtropical convergence, and the Antarctic convergence
Then look at the northern hemisphere and notice that we have the same names for the convergence and divergence zones
Only difference between the hemispheres is the Antarctic divergence in the southern hemisphere
There is no Artic convergence
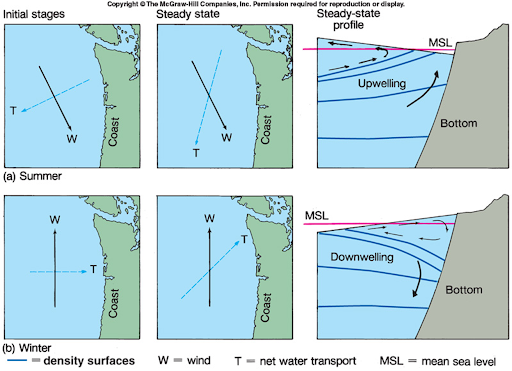
Seasonal Convergence/Divergence Zones
In this figures we are looking at the same coastal section during summer and winter. There is a north wind (the black arrow labeled W) in the summer and a south wind in the winter
Note again how the winds are named for the direction they are blowing FROM
Figure A
In the initial stages, the surface current NET water transport (T) is at a 90 degree angle to the right of the direction of the wind, as predicted bu the Ekman spiral
However, the flow of water moves water away from the coast creating a sort of resistance and at steady state the net transport will be 45 degrees to the right away from the shore
The last figure shows how the movement of water away from the hore affects water movement at the coast
We have moved water away from the shore and continuity of flow means this water has to be from the shore and continuity of flow means this water has to be replaced
This occurs through near coastal upwelling
Note how water surface is sloped, reflecting the movement of water away from the coast
Figure B
In the winter, we have a south wind
Initially, the Ekman transport is at 90 degrees to the right of the wind
At steady state, water transport will be at 45 degrees to the right of the wind
Water is moving towards the coast, it piles up, has to go somewhere and downwelling occurs
Note the slope of the surface, reflecting that water that has piled up against the coast
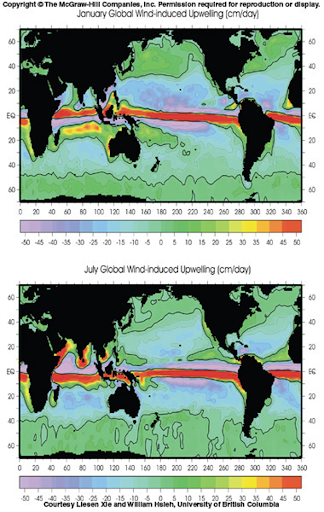
Another Example of Coastal Variations in Upwelling
Also good illustration of how important the equatorial upwelling area is the largest and most powerful in the world
Note how the summer upwelling occurs further north than the winter upwelling
Also not how there are some strong upwelling areas close to the coasts of Africa and India in the winter time
The unit in this figure is cm/day = centimeters per day
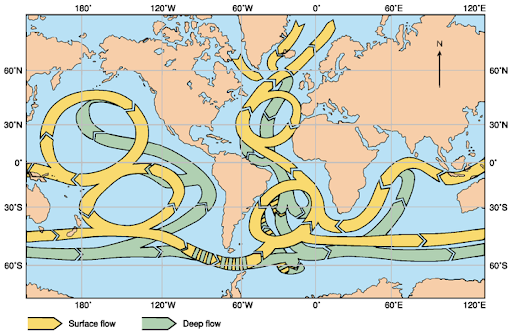
World Water Flow
SUPER IMPORTANT FIGURE
World Water Flow is also called the Global Conveyor Belt
The whole flow is powered by a single area - downwelling of water from the Gulf Stream that is cooled as it enters the North Atlantic. Look at the area between Europe and Greenland, this is where you see the yellow band turn down into green deep water
Recognize the North Atlantic Gyre
The water that sinks in the North Atlantic forms North Atlantic deep water, which flows south in the Atlantic. There is a small amount of mixing between deep and surface water off the north coast of South America and the west coast of Africa. However, most of the water continues its path around the globe as deep water.
There is mixing between surface and deep water in the striped areas on the map - the east coast of North America and south of South America in the West Wind Drift, but most of the deep water stays in the deep
The deep water finally surfaces in the North Pacific and starts its return path as surface water
Will go through the gyres in the Pacific, enter the gyres of the Atlantic and finally return to the North Atlantic as part of the Gulf Stream
There it will sink again and the journey starts ove
Whole circulation takes about 400 years
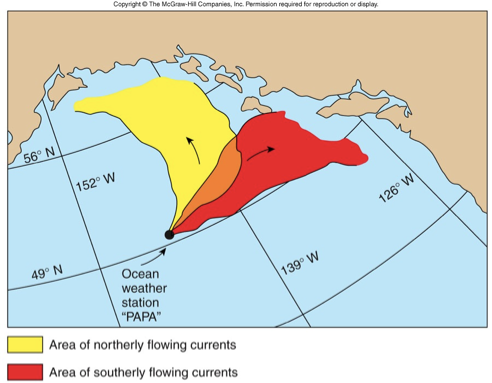
North Pacific Oscillation
N=> warm, dry
S=> cold, wet
Tree ring data
30 oscillations since Columbus
Variations in current patterns occur and have a profound effect on local climate
North Pacific oscillation has a limited spatial extent, but each state of the oscillation lasts for decades
Yellow oscillation has a mostly northerly current flow and results in warm dry weather
The red oscillation has an easterly, southeasterly current flow and results in cold, wet weather
Trees grow faster when they get a lot of rain and by collecting tree ring data scientists have learned that there has been about 30 oscillations since Columbus
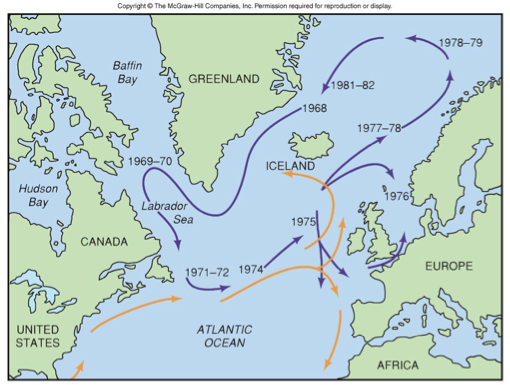
North Atlantic Oscillation
Cold water pool circulating in North Atlantic
Mixes with water in Gulf Stream and Norwegian Current => affects T in N. Europe
Oscillation in the figure started in 1968 north of Iceland and made a full circle in about 13 years
As cold eddy passed close to land, the nearby landmass would experience colder weather
For example, Scandinavia had very cold snowy winters in 1977-78