Looks like no one added any tags here yet for you.
What does repeated-measures designs evaluate?
Evaluates the mean difference between two measurements taken from a single sample
Other names for repeated-measures designs?
within-subject
related-samples
dependent-samples design
Repeated-measures designs require _ participants than needed for an independent-measures design
Repeated-measures designs require FEWER participants than needed for an independent-measures design
Why do repeated-measures designs require fewer participants
Individual differences in performance from one participant to another are eliminated.
Reduces the variance between subjects → reduces the
estimated standard error → increases power
Repeated-measures designs are well suited for examining _
Repeated-measures designs are well suited for examining CHANGES THAT OCCUR OVER TIME (such as learning or development)
What are 2 major potential disadvantage of repeated-measures design?
Testing effects
Floor and ceiling effects
What are testing effects?
Exposure to the first condition may influence scores in the second condition
What are ceiling effects?
Occur when an individual has such a high score in condition 1 there is nowhere to go but down in condition 2
When is repeated measures design used
when comparing groups made up of the same people
(before vs after treatment)
Null hypothesis of repeated-measures t-statistic
There is no consistent or systematic difference between the two conditions
μDifference = zero
Alternative hypothesis of repeated-measures t-statistic (two-tailed)
There is a systematic difference between conditions that produces a non-zero mean difference
The alternative hypothesis is that the sample mean difference represents a true mean difference in the population.
μDifference ≠ zero
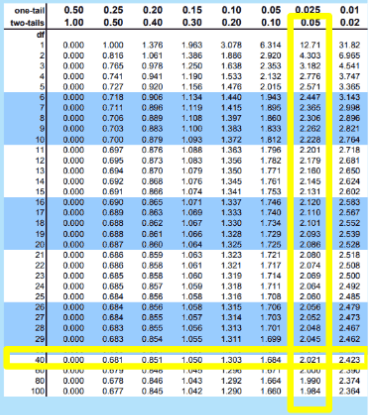
How to locate the critical region for a repeated measures t-statistic
Degrees of freedom (df) for the repeated-measures t test = n - 1
For example, a study with 50 participants measured twice
df = n – 1 = 50 - 1 = 49
Look up the corresponding value in t-distribution table
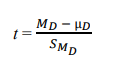
How to calculate t statistic for repeated measures t-test
When do we reject the null hypothesis with a repeated-measures t-test?
When the t value is farther from 0 than the critical value
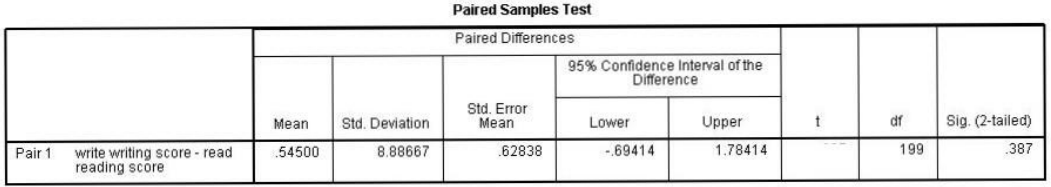
What is the MD of the data?
.54500
What is the sD of the data?
8.8867
What is the sMD of the data?
.62838
Find the t-Statistic of the data.
.867
What is the df of the data?
199
What is the p-value of the data?
.387
What do we use to calculate an effect size for the repeated measures t-test?
Cohen’s D
r-squared
(Know how to calculate)
ANOVA (Analysis of variance)
A hypothesis testing procedure used to evaluate mean differences between two or more populations
Purpose/Advantages of ANOVA
Purpose is similar to t-test
Can examine more than 2 groups at the same time
Why use an ANOVA over multiple t-tests?
Protects researchers from excessive risk of a Type I error in situations when comparing more than two population means
It automatically adjusts for the effect testing multiple hypotheses has on Type I errors
Factor
The independent variable that splits participants into groups
Levels
The individual conditions or values that make up a factor
Number of levels indicated by k
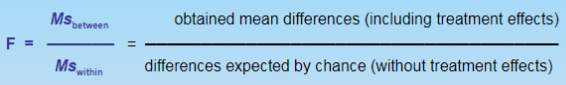
Logic of F-ratio
Same basic structure as the independent-measures t-statistic
MSbetween
measures the size of the differences between each level’s sample mean
By computing the variance of the means (MSbetween), we can test the size of the differences
What can cause differences between means?
Effects of the IV: could cause the mean for one level to be higher (or lower) than the mean for another level.
Chance or Sampling Error: If there is no effect of the IV at all, we would still expect some differences in the DV values between levels due to random, unsystematic sampling error
MSwithin
Measures the size of the differences that exist inside each of the treatment levels
All hypotheses in ANOVA are ____
Non-directional
Since F is a ratio of variances, we can never have a negative F.
Variances can’t be negative.
Therefore, there is only a single tail to the distribution
Null hypothesis for ANOVA
All the μ’s are equal
μ1=μ2=μ3
Alternative hypothesis for ANOVA
There is at least one mean difference
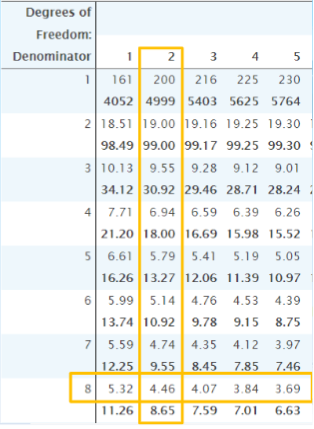
How to locate the critical region?
df between = k – 1 = Number of levels – 1
df within = N – k = Total number of participants – number of levels
We go to the F-Distribution table in the book
df between is in the columns (labeled across the top)
df within is in the rows (labeled down the side)
So an ANOVA with 3 levels and 11 participants would have df = (2, 8)
Regular type = .05
Bold type = .01
Critical Value = 4.46
Locate The Critical Region
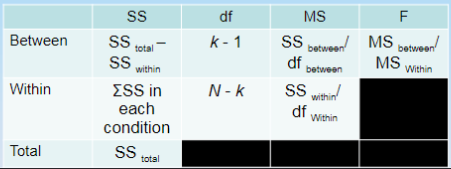
Compute the test statistic for ANOVA
Use an ANOVA table
How to make an ANOVA decision
Compare F value to critical value.
If F is more extreme we reject H0 Hypothesis Testing with the Independent
What do ANOVA results tell you?
However, ANOVA simply states that a difference exists
It does not indicate which levels are different
Need to follow the ANOVA with post hoc tests to determine
exactly which groups are different and which are not.
Tukey & Scheffé tests are common post hoc tests.
Done after an ANOVA where H0 is rejected.
The tests compare the treatments, two at a time, to test the mean differences while correcting for concerns about experiment-wise Type I error inflation.
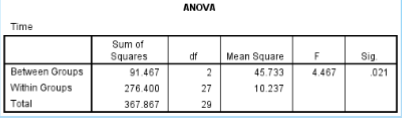
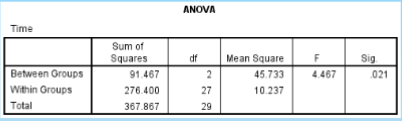
What is the SS between in the given data?
91.467
What is the SS within in the given data?
276.400
What is the df between in the given data?
2
What is the df within in the given data?
27
What is the MS between in the given data?
45.733
What is the MS within in the given data?
10.237
What is the F ratio in the given data?
4.467
Post hoc tests
Compare the treatments, two at a time, to test the mean differences while correcting for concerns about experiment-wise Type I error inflation
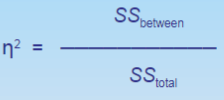
How to calculate effect size for ANOVA
compute the percentage of variance accounted for by the independent variable (group)
Correlation
A statistical method used to measure and describe the relationship between two (X and Y) as they exist naturally
Is correlation experimental?
No because there’s no attempt to manipulate on of the variables
When does a correlational relationship exist?
when changes in X tend to be accompanied by consistent and predictable changes in Y
Correlation _ causation
Correlation does not prove causation
Correlations tell us
the extent to which two variables are linearly related (meaning they change together at a constant rate)
Positive correlation
The two variables tend to change in the same direction
As one increases the other tends to increase
Negative correlation
The two variables tend to change in the opposite direction
As one increases the other tends to decrease
Pearson correlation coefficient
r
The most frequent method of measuring the common form of correlation as a straight line or linear relationship.
A correlation strength of r=+1.00
Perfect positive relationship
A correlation strength of r=-1.00
Perfect negative relationship
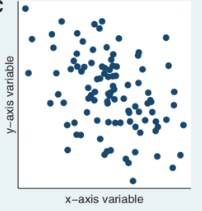
A correlation strength of r=0.00
No relationship at all
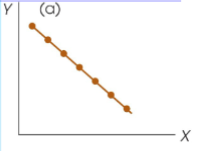
Guess the r value
-1.00
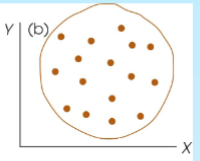
Guess the r value
0.00
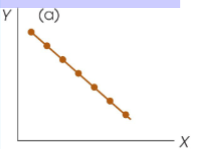
Guess the r value
-0.4
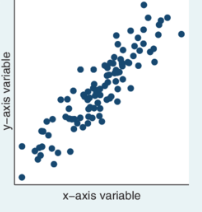
Guess the r value
+0.9
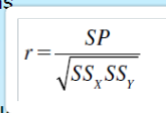
How do you calculate r
make sure you know how to calculation SSx and SSy
What can cause potential problems with Pearson correlation?
Outliers
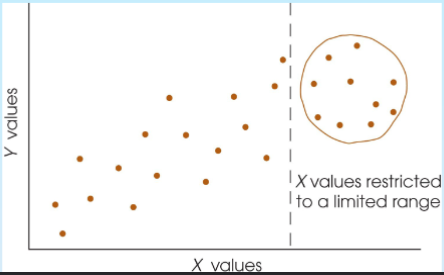
Restriction of Range
Outliers
Individuals with X and/or Y values that are substantially different than the other individuals in a sample
Restriction of range
Relationship between X and Y is obscured when the data are limited to a restricted range of values
Ex: Only able to get 100 on a test
Alternatives to Pearson’s r
Spearman correlation
Variations of pearson’s
point-biserial correlation
phi-coefficient
When is spearman correlation used
When examining the relationship between two ordinal variables (or one ordinal and one interval/ratio)
e.g: birth order and high school class rank
When the form of the relationships between two, variables are curvilinear or exponential
variable get converted to rank
How does spearman correlation work
the observations for each variable are rank ordered
after the variable have been ranked, the Spearman correlation is computed by using the Pearson formula but with ranked data
When is point-biserial correlation used
When one variable is dichotomous and the other is on an interval or ratio scale
When is phi-coefficient used
When variables are dichotomous
How do point-biserial correlation and phi-coefficient work
In both cases you use the same Pearson formula but recode the dichotomous variable values as 0 or 1
Null hypothesis for non-directional correlation
Ho: There is no association between X and Y (ρ = 0)
Alternative hypothesis for non-directional correlation
H1: X is associated with Y (ρ ≠ 0)
Null hypothesis for directional correlation
Ho: Greater X is not associated with greater Y (ρ ≤ 0)
Alternative hypothesis for directional correlation
H1: Greater X is associated with greater Y (ρ>0)
How to locate the critical region for a correlation
df=n-2
Then look at chart
How to make a correlation decision
Compare r to the critical value.
Reject the null if r is more extreme than the critical value.
Effect size of calculation
r squared (you square the r value)
What does r squared represent
the proportion of variance in the dependent variable that can be explained by the independent variable