Looks like no one added any tags here yet for you.
Individual
the objects described by a set of data
variable
any characteristic of an individual (can take different values for different individuals)
categorical variable or qualitative data
places an individual into one of several groups or categories (example: male vs. female). This data is COUNTABLE
quantitative data
takes numerical values for which arithmetic operations make sense (measurable)
distribution of a variable
tells us what values the variable takes and how often it takes these values - pattern of variation (table, bar, graph, pie chart, etc.)
outlier
an extreme value that differs greatly from other values in a set of values
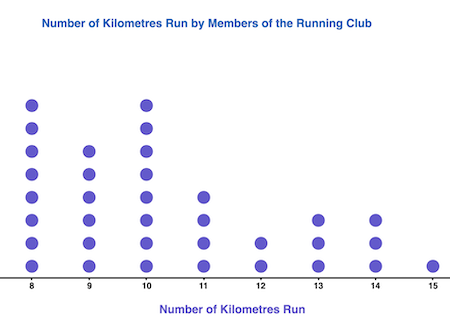
dotplot
a graph of qualitative data; a quick way to visualize a set of data
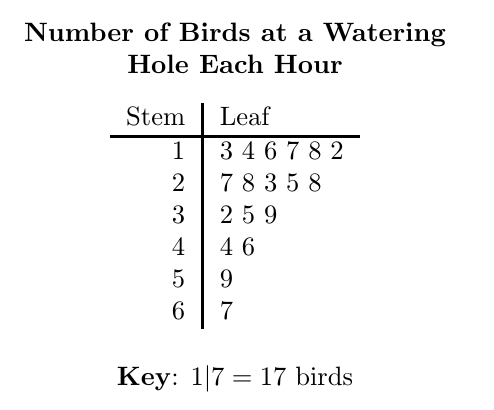
stemplot
the digit(s) in the greatest place value(s) of the data values are the stems. the digits in the next greatest are the leaves.
use key
4|2 = 42
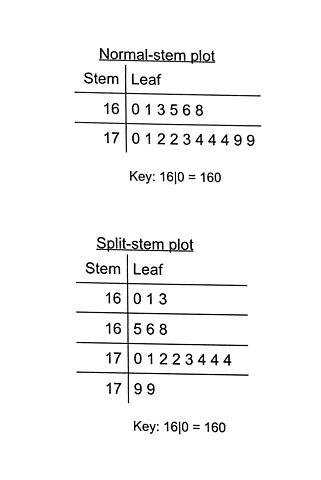
split stem plot
eac stem is listed more than once
first stem number: 0-4’s
second stem number: 5-9’s
Shape
Outliers
Center
Spread
describing or interpreting quantative data distributions.
*All of these with context —use question to answer the question! (WRITE THEM ALL OUT)
example
S - skewed to the left; unimodal
O - maybe at 40
C - median 85
range 60
The distribution of quiz scores is unimodal and skewed to the left. There is a possible outlier of 40. The center of the distribution is the median at 85 and the range of the quiz scores is 60.
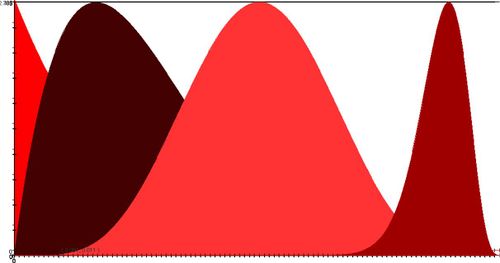
shape
a visual description of what the distribution looks like
a distribution is symmetric if the right and left sides of the histogram are approximately mirror images
is it skewed?
clusters? (unimodal, bimodal, trimodal?)
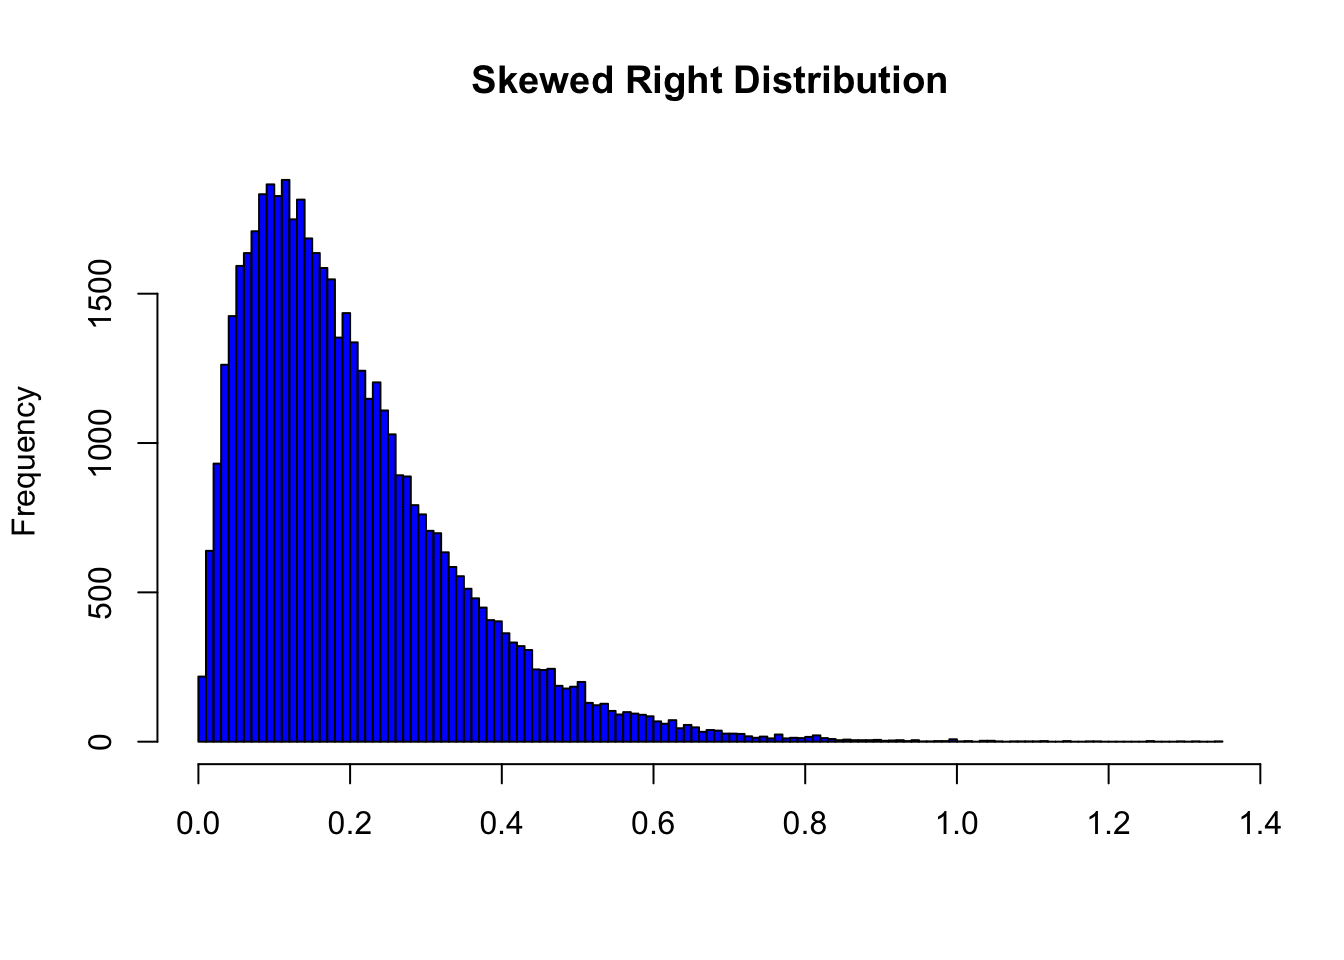
skewed to the right
if a distribution extends much further from the right side than the left
***The tail is to the right
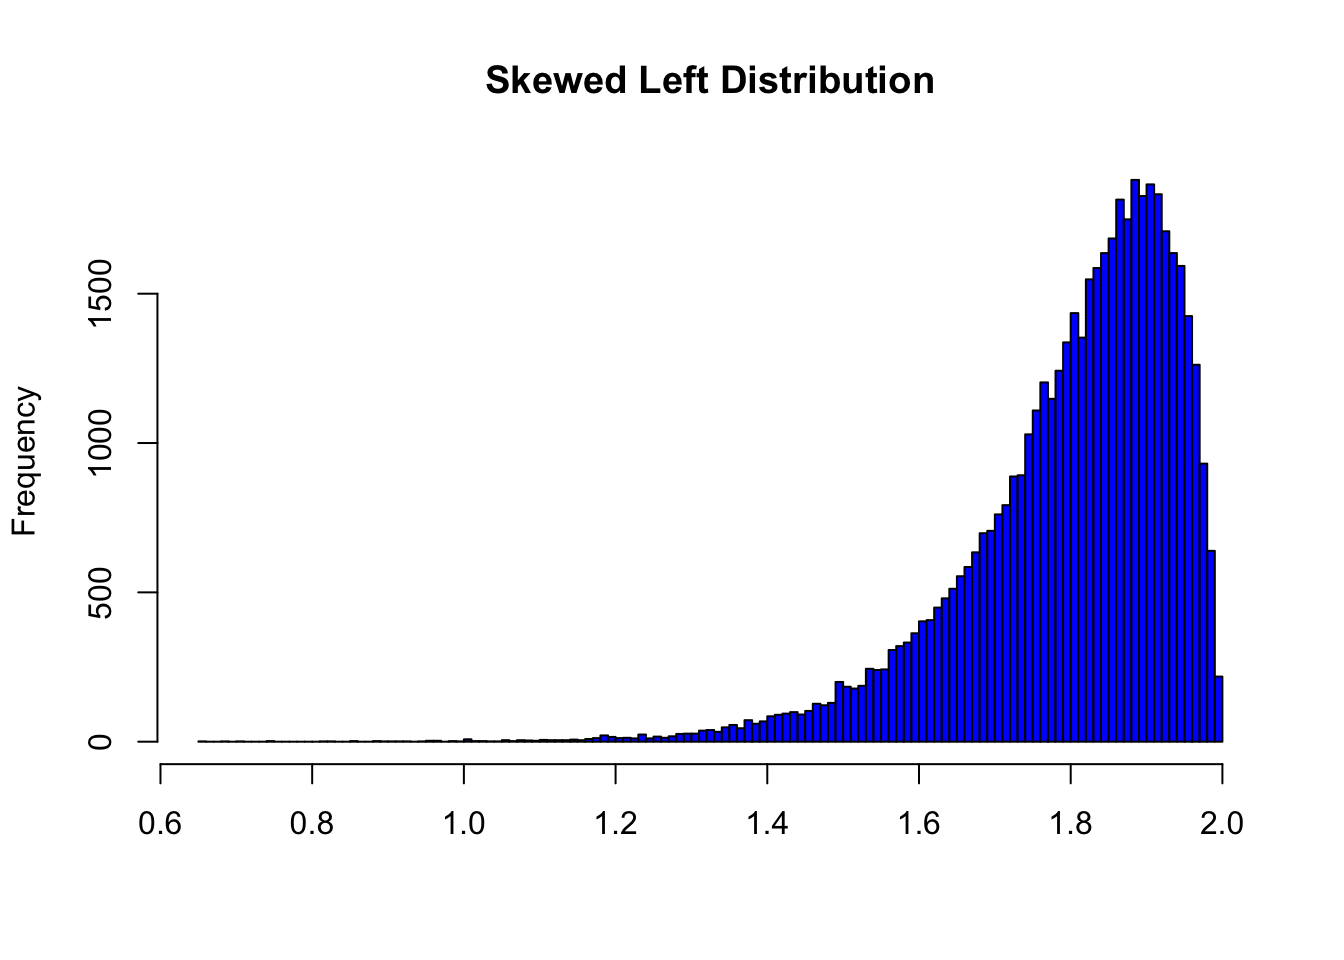
skewed to the left
if a distribution extends much further from the left side than the right
***The tail is to the left
unimodal
one cluster
bimodal
two clusters
multimodal
more than two clusters
“potential or possible outlier”
If looking at a histogram with no data, use words like
IQR Method
IQR = Q3-Q1
used to determine if an outlier exists
outlier < Q1-1.5(IQR)
outlier>Q3+1.5(IQR)
if you have a histogram with data
center
a value that divides the observations so that about half takes longer larger value and about half take smaller values
USE MEDIAN
mean
the arithmetic average of a data set
the sum of all the values divided by the number of values
median
***USE THIS FOR CENTER
the middle value of a data set; the equal areas part, where 50% of the data are at or below this value and 50% of the data are at or above this value
spread
describes the variability of the data
range (histogram with no data)
histogram with data
variance
standard deviation
IQR
range
(max-min)
***ONLY USED THIS FOR HISTOGRAM WITH NO DATA
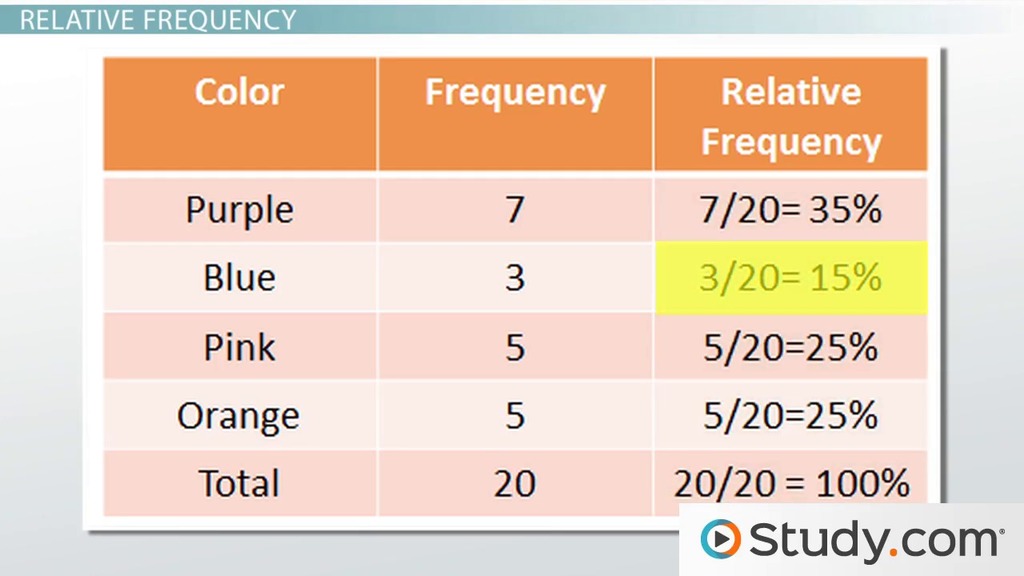
frequency
the count of how often something occurs
relative frequency
percentage or proportion of the whole number of data
frequency/total number
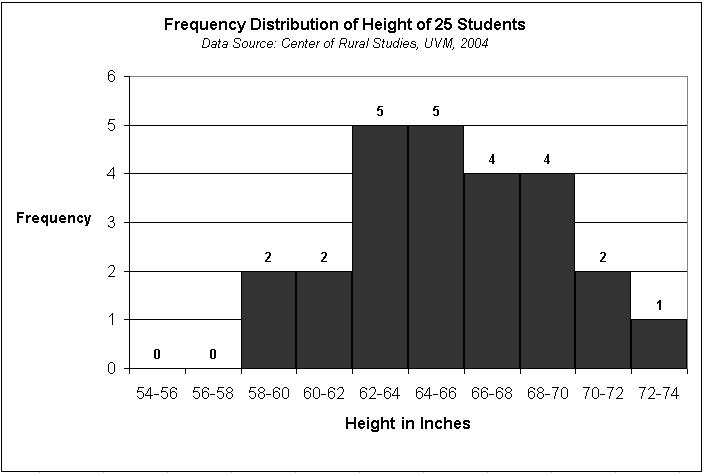
histogram
breaks the range of values of a variable into intervals and displays only the count or percent of the observations that fall into each interval
divide the data into classes (intervals) of equal width
need to specify classes so that each individual falls into one class
usually will need between 5 and 7 intervals
each bar of the histogram can include only one of its endpoinrs
intervals should NEVER overlap
LABEL AND SCALE YOUR AXIS
!!!!!!!title your graph!!!!!
class width = (max-min)/number of groups
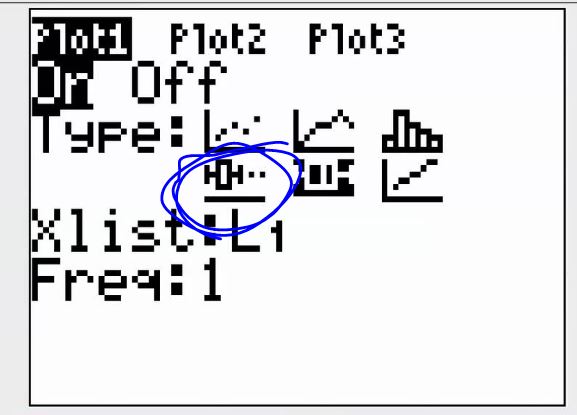
making a histogram (calculator)
enter the data into L1
2ND stat plot (above y=) → plot1 → ENTER
Turn on → choose symmetric histogram picture → graph → zoom9
window → fix xscale=_____
Hit TRACE for interval
heartbeat
if not starting at zero when its on a graph
4 decimal places
round to
time plot
plot each observation against the time at which it was measured - time is always on the z-axis
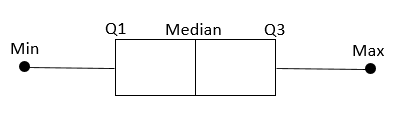
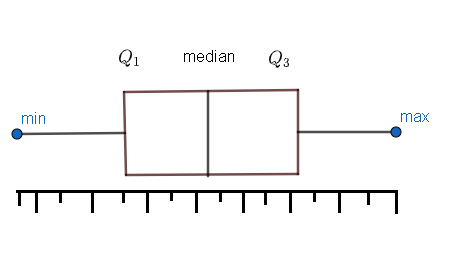
Five number summary
STAT → CALC → 1 Var Stats
Min
Q1
Med
Q3
Max
IQR
Inner Quartile Range
Q3-Q1
checking for outliers
find IQR (Q3-Q1)
Q1-1.5(1=IQR); Q3+1.5(IQR) → [ __ , __ ]
Any number outside this interval is an outlier
resistance
a statistic is resistant if adding an extreme value does NOT change the value of the statistic much
A mean is NOT resistant, a MEDIAN is
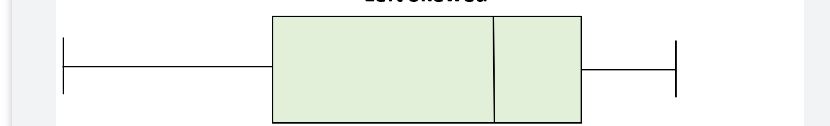
symetric distibution of a boxplot
DO NOT USE BOXPLOTS FOR A SHAPE, alway use histograms
Boxplots are good fo five number summary
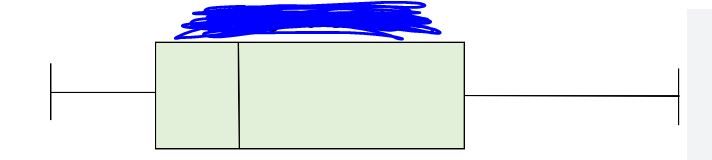
negative distribution of a boxplot
DO NOT USE BOXPLOTS FOR A SHAPE, alway use histograms
Boxplots are good fo five number summary
positive distribution of a boxplot
DO NOT USE BOXPLOTS FOR A SHAPE, alway use histograms
Boxplots are good fo five number summary
The mean and median of a roughly symmetric distribuion are
close together
Don’t confuse the “average” value of a variable (the mean) with its
“typical” value, which we migh describe by the median
If he distribution is excatly symmetric
the mean and median are exactly the same
In a skewed distribution, the mean is
usually further out in the long tail than the median is
The mean is pulled toward the skew and outliers
modified boxplots
The whiskers only extend to adjacent values, not outliers
modified boxplot on calculator
Hitting TRACE will show all points
Standard deviation
One of the most common measures of spread. It looks as how far each deviation is from the mean.
Measuring spread: STANDARD DEVIATION
deviation
=observation-mean
mean equation
add all the numbers and divide by the sum
how to find standard deviation
Calculate the mean
add all the numbers and divide by the sum
Calculate each deviation
deviation=observation-mean
Square each deviation
Find the “average” squared deviation
Calculate the sum of the squared deviations divided by the degrees of freedom (n-1) - This is called the VARIANCE
Calculate the square root of the variance, this is the STANDARD DEVIATION
variance
The average square distance
(sum of square deviations)/(n-1)
Sx
measures the spread about the mean
is the is sample standard deviation
NOT RESISTANT
ALWAYS greater than or equal to 0
Sx=0 ONLY when there is no variability
Sx is always greater >than or equal =/≥ to
0
Sx is ONLY equal to 0 when
there is no variability
Sx is more meaningful with data that
has a symmetric shape
Is Sx resistant?
No, Sx is not resistant. It is even less resistant than mean to extreme outliers.
divide by n if you are looking for a
parameter (population SD)
divide by n-1
if you are looking for a statistic (sample SD)
measures of center and spread
mean and standard deviation
or
median and IQR
median and IQR
are usually better than the mean and standard deviation for describing a SKEWED DISTRIBUTION or a distribution with outliers
use mean and standard deviation only for
symmetric distibutions that don’t have outliers
Note: numerical
mean > median
the distribution is skewed to the right
measuring position: percentiles
knowing the mean or median is helpful, but sometimes you want to know where something falls with respect to everything else…
The pth pecentile of a distribution is the value with p percent of observations at or below it
[(number of values below x)/(number of total values)] x 100
If it says “justify your answer”, use 1.5IQR method
equation for p percentile
[(number of values below x)/(number of total values)] x 100
Cumulative Relative Frequency Graphs (Ogaves)
A graph that displays the cumulative relative frequency of each class of a frequency distribution
(cumulative frequency)/sample size
Measuring posistion: z-scores
Tells use how many standard deviations from the mean an observation falls and in what direction
If x is an observation from a distribution that has a known mean and standard deviation, the standardized value of x is:
z=(x-mean)/SD
we can use z-scores to compare the posistion of
individuals in different distributions
z-score facts
not measured in the same units as the original data
it is the number of standard deviations away from the mean
positive z-scores are above the mean
negative z-scores are below the mean