Energy From the Sun
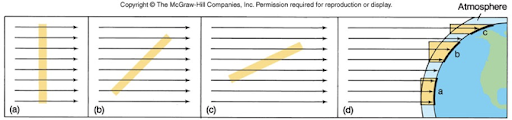
The amount of solar radiation hitting the Earth varies with latitude
Rays perpendicular to surface => more
Between Tropic of Cancer and Tropic of Capricorn
Rays oblique to surface => less
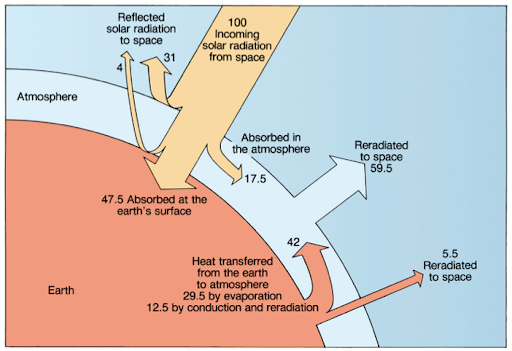
Heat Budget
35 units of solar energy immediately reflected to space
65 units of solar energy absorbed by Earth’s surface and atmosphere
Earth’s surface: 47.5 units
Atmosphere: 17.5
Maintain heat balance: Earth must reradiate 65 units of energy back into space
Earth’s surface: 5.5 units reradiated
Atmosphere: 59.5 units reradiated
Earth’s surface has a net gain of 42 units of heat while the atmosphere has a net loss of 42 units of heat
The loss of heat in the atmosphere is replaced by the heat gained by the Earth through evaporation, conduction, and re-radiation
To understand the heat budget of a portion of the ocean
The total energy absorbed
The loss of energy due to evaporation
The transfer of heat (advectively) through currents (input and outflow of energy)
Warming or cooling of the overlying atmosphere due to energy at the sea surface
Heat re-radiated to space from the sea surface
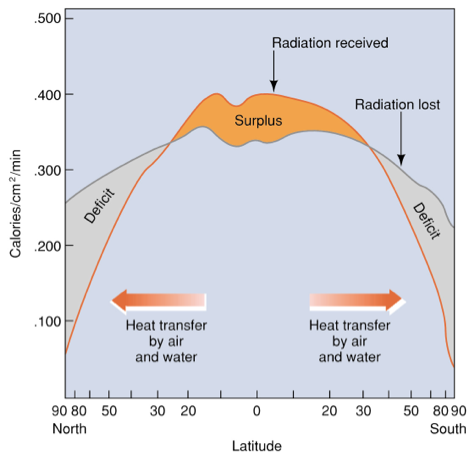
Heat Balance with Latitude
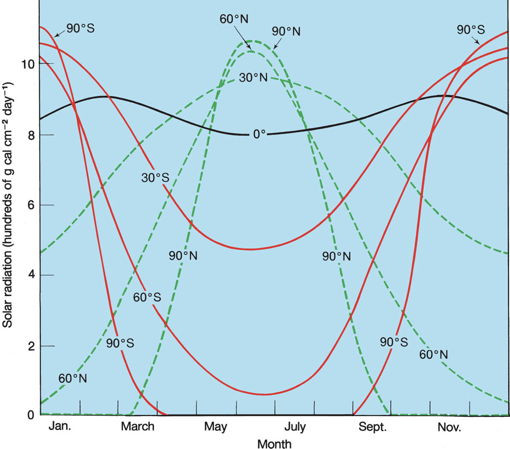
Solar Radiation
The intensity of solar radiation available at the Earth’s surface varies with latitude and time of year
Solar radiation intensity at middle latitudes between about 40 degrees and 60 degrees N & S is highly variable annually
Angle of sun’s rays reaching the surface is slightly variable at these latitudes
Solar radiation intensity is fairly constant through the year in tropics
Polar latitudes are subject to severe changes in length of daylight
Land and ocean respond differently to annual changes in solar radiation
Land has low heat capacity, gains or loses heat over short period of time (such as overnight)
Oceans have very high heat capacity, absorbing or releasing heat with very small changes in temperature (think about maritime vs. continental climates)
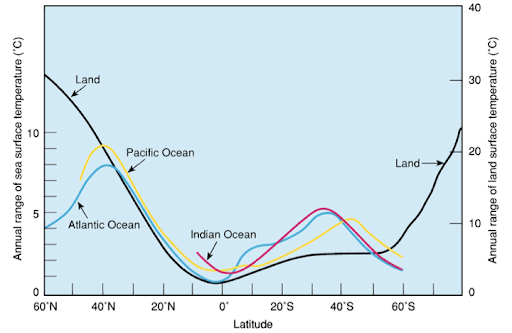
Ocean Temperature Ranges
Water has a higher heat capacity than land
More heat can be added or lost without a change in temperature
The annual range in T will be smallest in the ocean than on land
Range = difference between smallest and highest T
There is less land in the Southern Hemisphere than in the Northern Hemisphere
The average annual range in sea surface temperatures is quite small because of water’s high heat capacity and the transfer of heat through the water by mixing
Sea surface temperature variations range from
0 degrees to 2 degrees celsius in tropics
5 degrees to 8 degrees celsius at middle latitudes
2 degrees to 4 degrees at polar latitudes
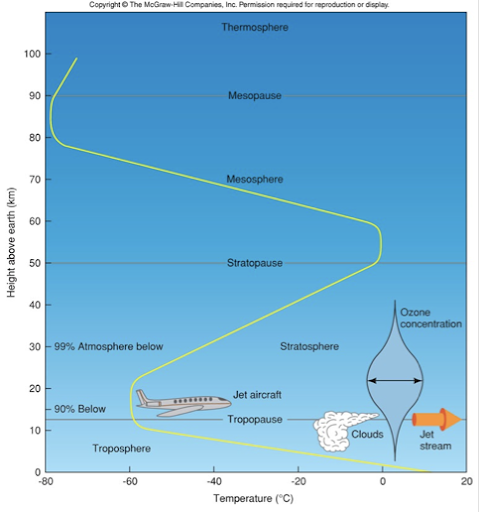
Layers of the Atmosphere
Ozone absorbs UV and changes wavelengths from light to heat (causes increase in temperature)
Atmosphere is reasonably well-mixed envelope of gasses roughly 90 km (54 mi) thick
4 layers of atmosphere from lowest to highest elevation:
Troposphere
Stratosphere
Mesosphere
Thermosphere
Density of the atmosphere decreases rapidly with increasing height
Roughly 90% of the mass of the atmosphere is found in the first 15 km (9 mi) and 99% of the mass in the first 30 km (18 mi)
CFC = chlorofluorocarbon
Refrigerant and propellant released into atmosphere
Cause atmosphere to thin
CFC are broken down by strong UV radiation
Chlorine atoms are released that react with ozone molecules, depleting ozone layer
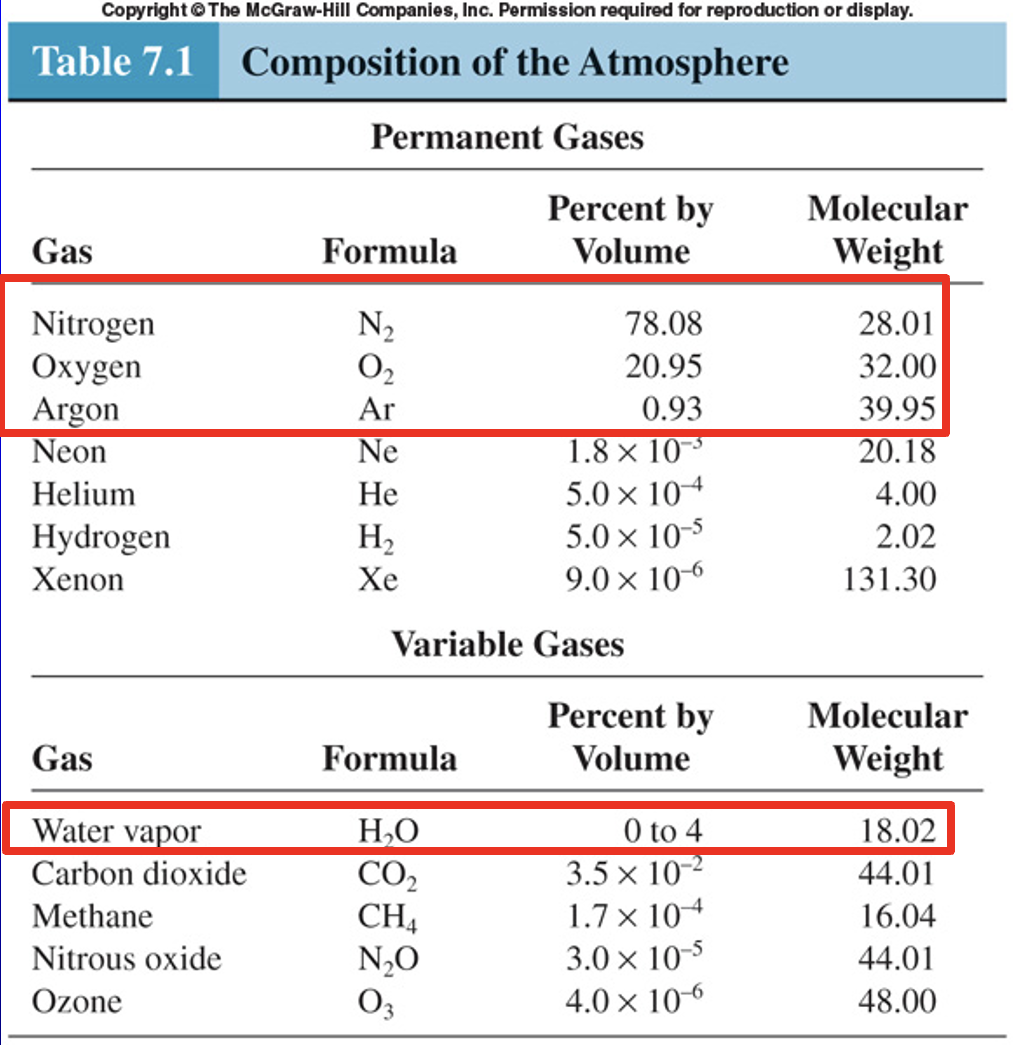
Atmosphere Composition
Density of air is proportional to molecular weight of components in the air
Molecular weight of water vapor is much lower than the three major components of air
This means that increasing the amount of water vapor in the air decreases the density of the air
3 major permanent gasses of the atmosphere
Nitrogen
Oxygen
Argon
Air Density
Controlled by 3 variables:
Amount of water vapor: increased water vapor = decreased density
Temperature: as temperature increases air density decreases
Elevation above sea level = pressure
As elevation increases, density decreases
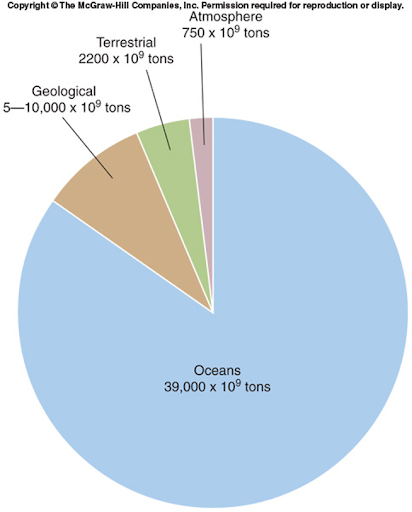
Carbon Dioxide
Most of the carbon dioxide on Earth is in the oceans
Smallest amount of CO2 is found in the atmosphere
The oceans buffer the increase of carbon dioxide in the atmosphere
CO2 is stored in 4 reservoirs
3 active reservoirs:
Atmosphere
Oceans
Earth’s terrestrial system
1 inactive reservoir
Earth’s crust
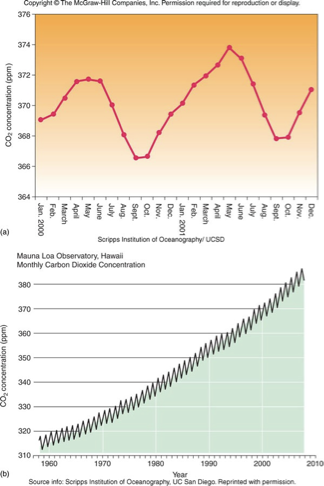
Atmosphere Carbon Dioxide Concentration is Increasing
The CO2 concentration is increasing because of fossil fuel burning
Curve in chart is called Keeling curve after man who started collecting data about CO2 concentration in atmosphere
Short-wavelength incoming radiation is not blocked by CO2 but re-radiated long wavelength energy is, and this warms the atmosphere
Greenhouse effect
Changing atmospheric chemistry can be monitored for past years by analyzing bubbles trapped in polar ice
Following Industrial Revolution, the concentration of CO2 has risen dramatically and continues to rise at an increasing rate
Clear seasonal variation in CO2 related to increasing uptake by plants for photosynthesis in the spring and summer and increasing release through decay in the fall and winter
Scientists estimated that greenhouse effect may produce a global warming of 2 - 4 degrees celsius over next 100 years
Could melt high latitude ice and raise sea level by as much as 1 m by the year 2100
Stratosphere Ozone Concentration - The Ozone Hole Over Antartica
Greatest loss is over antarctica because the Antarctic winters are colder than Arctic winters
Ozone holes occur over poles
Ozone depletion is most severe in winter months
Ozone in upper atmosphere absorbs UV light, which drastically decreases UV light reaching Earth
If there are lower ozone concentrations in upper atmosphere, more UV light will reach Earth
Harmful to living organisms bc is has a short wavelength, which has more energy than long wavelength light
UV light is the highest-energy solar radiation that reaches Earth
Ozone is very reactive and when it reacts with other chemicals ozone is destroyed
Chemicals reacting with ozone:
Chlorofluorocarbons (CFC) which were used in refrigerators, insulating foams, air conditioning systems (homes and cars)
Methyl bromide which is formed by single-celled organisms at surface of ocean, derived from pesticides, and released by industry and slow-smoldering burning of vegetation
Ozone
Ozone DOES NOT AFFECT GLOBAL CLIMATE
Ozone is not a greenhouse gas
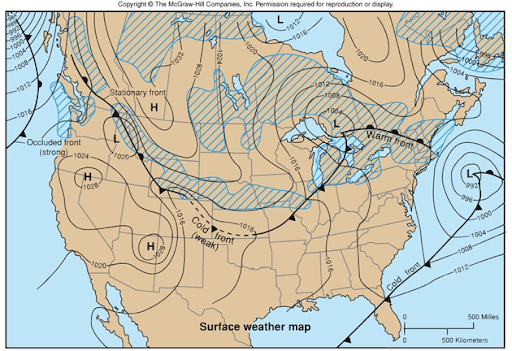
Isobar
An isobar is a line of connecting areas with the same air pressure
Isobars have the unit millibars in this figure
The closer isobars are to each other, the stronger the winds
H is high pressure
H: Air is moving down = clear skies
L is low pressure
L: Air is moving up = precipitation
Cross-hatching is rain
Cold fronts occur when cold dense air wedges itself under less dense, warmer air
Warm fronts are produced when less dense, warm air moves over denser cold air
Winds on a Nonrotating Earth: A Convection Cell Model
Earth’s surface heats more at equator than poles bc angle of sunlight
In a model with a non-rotating Earth, uniformly covered with water, this heat influx would produce a single, large convection cell in each hemisphere, extending from equator to the pole
Warm air rises at equator (forming a low-pressure system)
Cooled air sinks at the poles (forming a high-pressure system)
Rising equatorial air and the sinking polar air occurs in real life, and is the basis of Earth’s air circulation
Equatorial rising air cools as it ascends (because upper atmosphere is cold) causing water-vapor condensation
Condensed water vapor forms clouds and water drops fall as rain
Equatorial low-pressure area has a lot of rain
Upper atmosphere air is cold and dry, because all water vapor has been condensed and removed as rain
Polar areas have little precipitation
In general, low-pressure areas always have higher precipitation than high-pressure areas
Surface winds blow from high-pressure areas to low-pressure areas
In model, surface winds would blow from the polar, high-pressure system towards the equatorial, low-pressure system
As a result of the convection cell, high-altitude air will move away from the equator toward the poles
High altitude air releases heat as it more from the equator towards to poles
This way of moving heat energy is very important for global climate
Winds are always named for the direction from which they blow
Different from ocean currents ( named for direction they are going towards)
In model, all of the Northern Hemisphere would have surface winds from the north (north winds) and all of the Southern Hemisphere would have surface winds from the south (south winds)
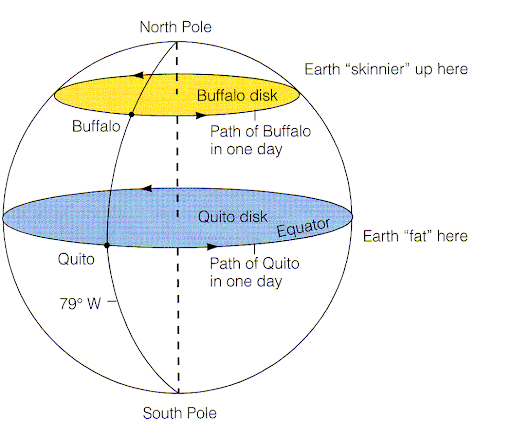
Speed of Earth’s Surface with Latitude
Earth moves faster at wider areas because it has to make a circle at same time as thinner areas
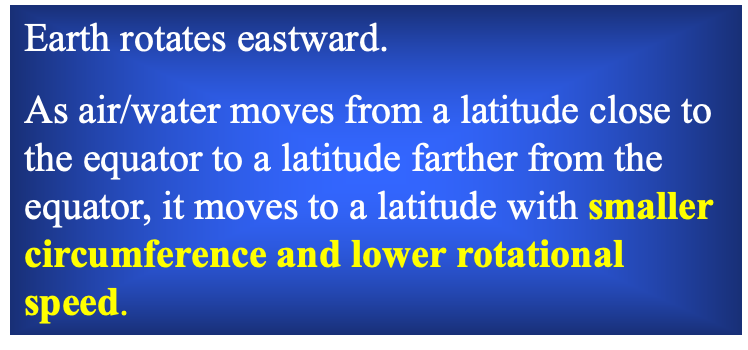
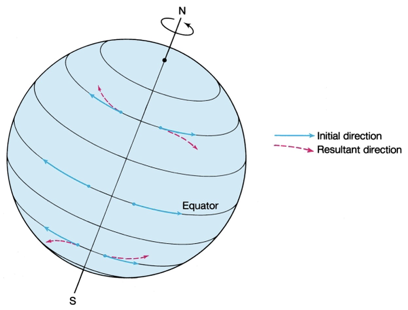
Coriolis Effect
Earth’s surface locations rotate eastward at a speed that depends on latitude
Air or water moving across Earth’s surface has a rotational speed at the origin point and it retains that rotational speed as it moves
Deflection left in southern hemisphere; deflection right in northern hemisphere
It retains the rotational speed due to inertia
Compare this to how your body moves forward if you break quickly in your car - your body keeps moving forward due to inertia: your body moves forward with the speed it had before breaking
Moving Away From Equator
Moving Towards Equator
If the air mass then moves closer to the equator, it will move over points on the surface that have a higher eastward velocity than it does
Consequently, to an observer on the surface, the air mass will appear to lag behind the eastward rotation of the planet, or it will appear to be moving westward
Wind moving East/West
Wind/water moving east in relation to Earth’s surface will have a higher speed than Earth’s surface and will be deflected towards an area where the winds have equal speed, i.e. regions with larger circumference
Wind moving west in relation to Earth’s surface, will be deflected toward areas with equal speed, i.e. regions with smaller circumference
The Coriolis Effect - Air/Water Movement on Rotating Earth
Earth’s rotation causes deflection of large-scale paths
Objects in frictionless motion will appear to be deflected to the right of their direction of movement in the Northern Hemisphere and to the left in the Southern Hemisphere
This apparent deflection is called the Coriolis effect after Gaspard Gustave de Coriolis (1792-1843), who solved the problem of deflection in frictionless motion when the motion is referred to a rotating body and its coordinate system
Northern Hemisphere
As we move from the equator to the north we fall ahead of the eastward rotation of the earth
Southern Hemisphere
As we move from the equator to the south we fall ahead of the eastward rotation of the earth
Coriolis Effect and Scale
The Coriolis effect only work on large spatial scales
Contrary to popular belief, the Coriolis effect does not cause water to move in opposite directions in the Northern vs. Southern hemisphere
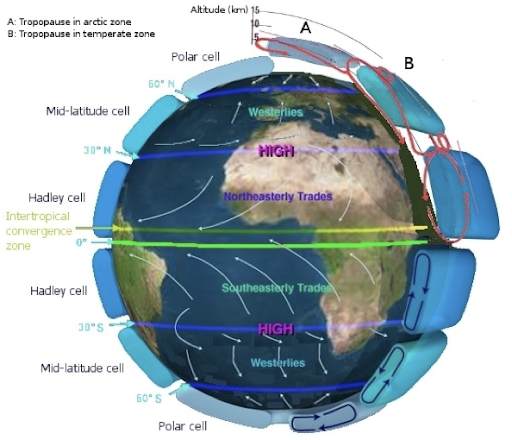
Coriolis Effect and Convections Cell
Remember the model with one large convection cell in each hemisphere?
The coriolis effect divides the one convection cell into three separate convection cells in each hemisphere
Again, think of these cells as pillows going all around Earth
Jet streams are strong winds always flowing from west to eat
Strongest het stream are the Polar jets, at around 7-12 km (23,000-39,000 ft) above sea level, and the higher and somewhat weaker Subtropical jets at around 10-16 km (33,000 - 52,000 ft)
Jet streams in the northern hemisphere are indicated by the small loops above the Mid-latitude cell and between the Hadley cell and the Mid-latitude cell
Winds are named by the direction that are coming from
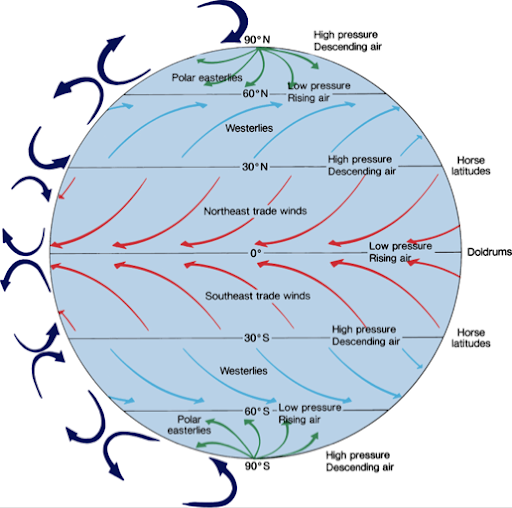
Wind Belts
Deflection short circuits the large convection cell that covers the whole area from equator to pole => several small convection cells are created
They are roughly 30 degrees
You can derive the whole pattern on this figure by knowing that air rises at the equator and that each convection cell is ~30 degrees
Go through each convection cell, the direction and the wind names. A wind is named for the direction is blows FROM
Climate Change, the Jet Stream, and the Polar Vortex
Incredible and extreme rains are a result of climate change
Strong storms and winds
Energy released into atmosphere adds energy to the jet stream, causing it to dip down and stay in place
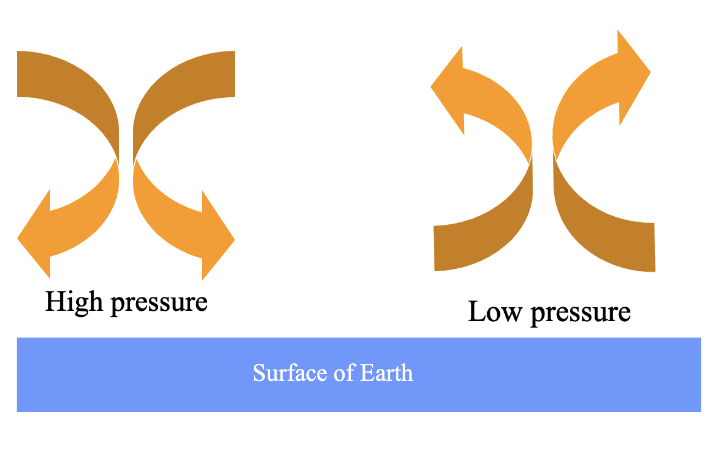
Wind Movement in High and Low Pressure Areas
If air moves downwards, towards Earth’s surface, a high-pressure area forms
If air moves upwards, away from Earth’s surface, a low-pressure area forms
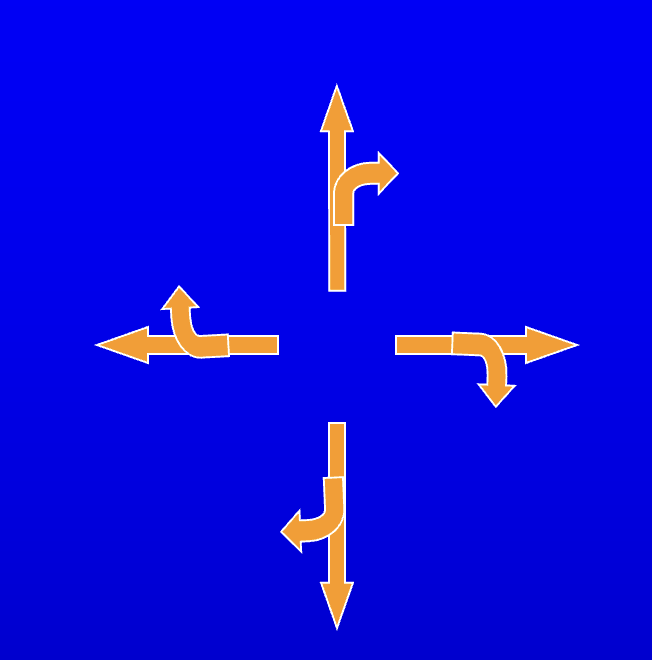
High Pressure Systems (Northern Hemisphere)
Wind direction around high-pressure systems in Northern Hemisphere
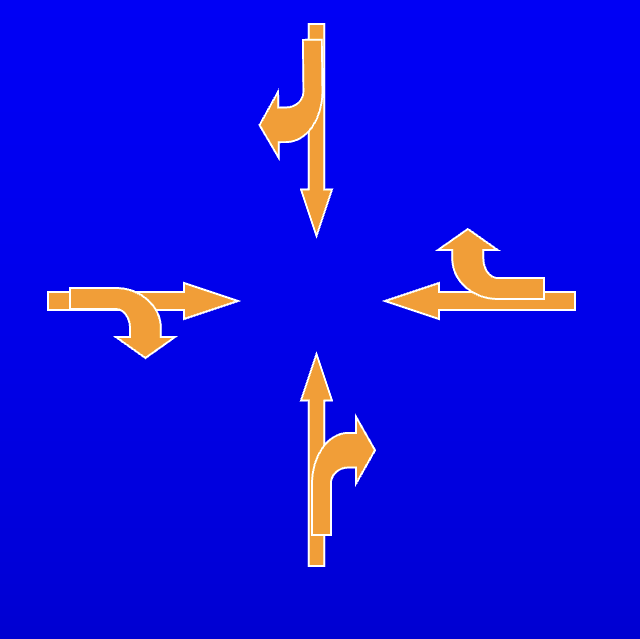
Low Pressure Systems (Northern Hemisphere)
Wind direction around low-pressure systems in Northern Hemisphere
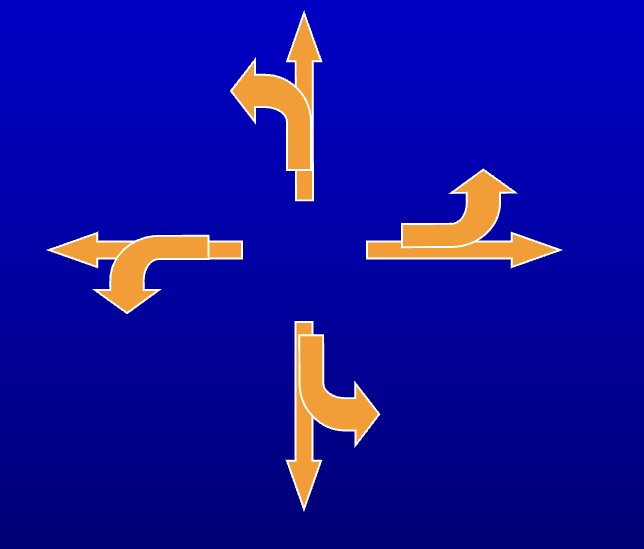
High Pressure Systems (Southern Hemisphere)
Wind direction around high-pressure systems in Southern Hemisphere
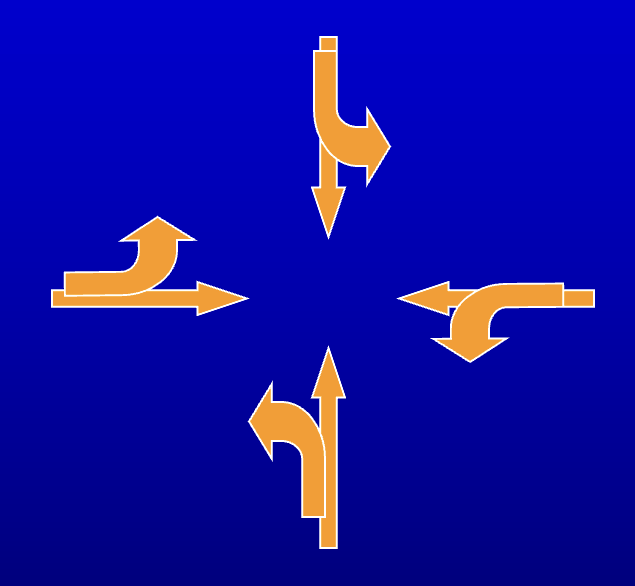
Low Pressure Systems (Southern Hemisphere)
Wind direction around low-pressure systems in Southern Hemisphere
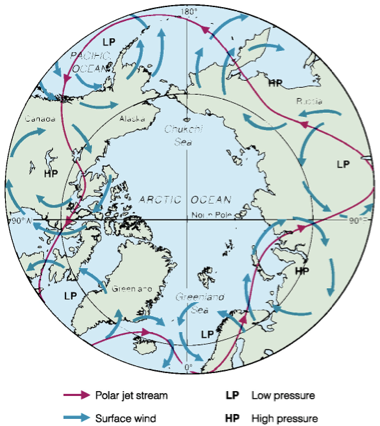
Polar Jet Streams
The polar jet stream results from a series of high and low pressure areas surrounding the Arctic Ocean. If you follow the red line of the wind directions in the Polar Jet Stream you will see that they coincide with the wind directions in the high and low pressure areas
The location shown is the average location, but the Polar Jet Steam can be displaced north or south, and the meanders can also change shape. If the Polar Jet Stream over the continental US is displaced south, the temperature in the north will be dramatically lower. The amount of energy carried by the Polar Jet Stream is immense - it has been estimated that 1% would cover all of Earth’s present energy needs
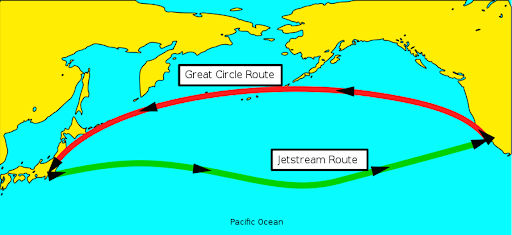
Use of Jet Stream in Aviation
Flying along the Great Circle connecting two points is always the shortest route
However, if there are strong wind currents it can be faster to fly with this air current
This is the case when flying eat within a jet stream
The figure shows the flight routes between Tokyo and LA
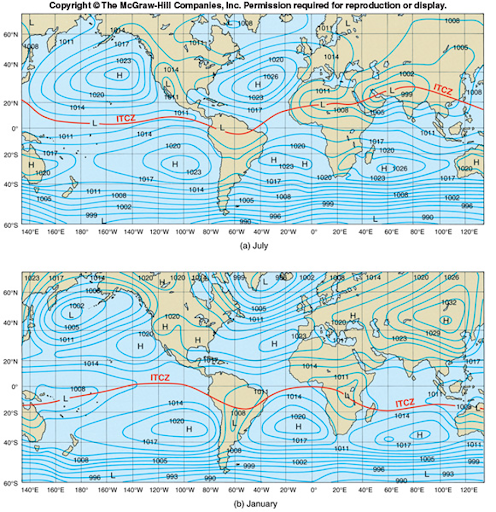
Difference in Heat Capacity
Two important concepts:
Sinking air pushes against the surface and forms high-pressure air system. Rising air moves away from the surface and formas a low-pressure air system
Land has lower heat capacity than the ocean, which causes land to heat faster than the ocean
Top figure:
Average pressure in July (summertime in the northern hemisphere (NH) and wintertime in the southern hemisphere (SH))
In July, NH gets more solar radiation than the SH
Land will heat faster than water, which causes air over land to rise, forming a low pressure system
In contrast, ocean heats slower than land and air ocer ocean will sink forming a high-pressure system
Bottom figure:
Average air pressure in January (wintertime in NH and summertime in SH)
In January, the SH gets more solar radiation than NH
Land will heat faster than water, which causes air over land to rise, forming a low pressure system
In contrast, ocean heats slower than land and air over ocean will sink forming a high-pressure system
ITCZ - Intertropical Convergence Zone
Sometimes called oceanographic equator
Low pressure system along the equator in air-circulation model, ITCZ is that low-pressure area and follows the outline of where the circulation systems along the equator meet
ITCZ is located farther north in July and farther south in January
ITCZ is not the same as the equator because of the unequal distribution of land and water between the hemispheres
Weather and Air Pressure
Local weather will be affected by air pressure
In a high-pressure area it will be sunny and dry
In a low pressure area, it will be cloudy and rainy

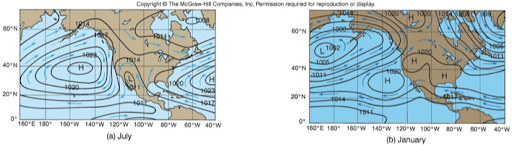
Prevailing Winds Around High- and Low-Pressure Systems
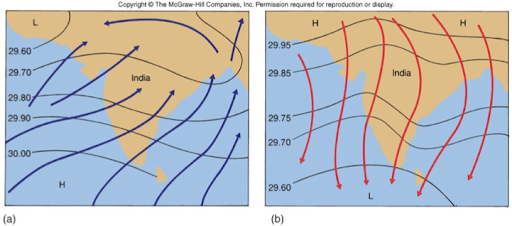
Monsoon Patterns
India is in the Northern Hemisphere
Figure a represents summer (July) and figure b represents winter (January)
Note that these images represent surface winds
In July, the difference in heat capacity between lans and water causes more heating of land than water, which causes a low pressure with rising air over land
The rising air over the continent pulls in moist air from the ocean
The ocean air is warm (close to equator) and carries a lot of moisture because warm air can carry more water vapor than cold air
Moist air rises in the low-pressure over land, resulting in heavy rains that are called monsoon rains
In January, the ocean is warmer than land, forming a low-pressure area with rising air over the ocean
Air is pulled from the continent towards the ocean, and there are dry conditions over land
Morning & Evening Winds
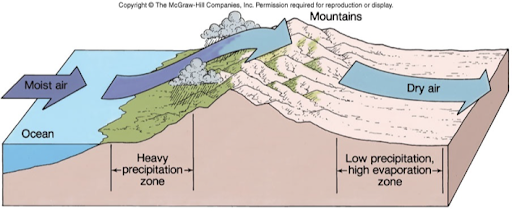
The Orographic Effect
Moist ocean air, with high water vapor content, blows towards land
Land has a nearshore mountain range that forces the moist air upwards
The upper atmosphere is cold and will condensate the water vapor into rain
Ocean side of the mountain chain gets a lot of rain, while the landward side of mountain chain is dry
Hurricane Formation
Ocean surface T > 27 C => low-pressure system can form a tropical depression
Hurricanes form only when the ocean-surface water temperature is high enough to cause evaporation
High evaporation only happens when the ocean surface is very warm - the cut off temperature is 37 C or 80 F
Winds around system clockwise in SH, counter-clockwise in NH
High wind speed close to LP => air picks up water vapor
Vapor condenses as it rises => heat is released => fuels the hurricane
Typhoon, cyclone = hurricane formed in western Pacific
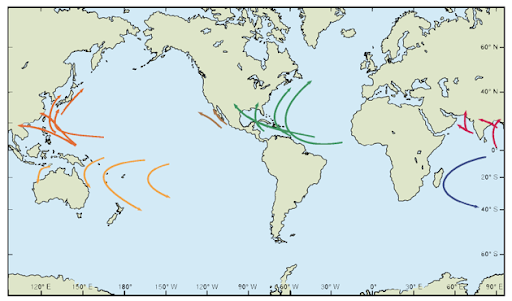
Hurricane Tracks
Hurricanes have a LP air system in their center
Winds around LP systems spin in opposite directions in the northern and southern hemisphere
Hurricanes cannot cross the equator - the change in spin direction would stall and cancel it
A hurricane cannot form at the equator because the Coriolis effect is not large enough
Coriolis effect occurs because of the difference in rotational speeds between latitudes
Difference in rotational speed is very small close to equator
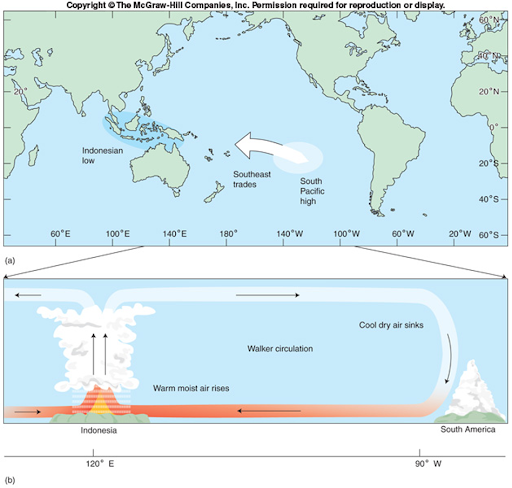
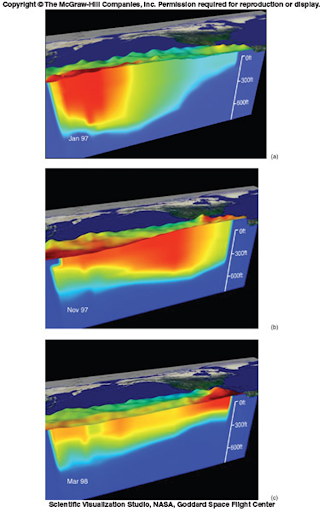
Normal Circulation in the South Pacific
The South Pacific normally has a high-pressure area close to Chile and the prevailing surface winds are southeasterly
Air in this circulation cell will rise when it encounters Indonesia, which has high humidity
Cell is completed by air at high altitude flowing back towards South America
Southeasterly surface wind pushes surface water from South America towards Indonesia, which causes upwelling along the South American coast
Upwelling adds nutrients to surface waters along the South American coast and is the reason for the very rich fisheries
El Nino
Top graph shows normal conditions
Mid graph shows transition into El Nino conditions
Bottom graph shows El Nino conditions
Years with El Nino conditions tend to have higher average global T
When El Nino, conditions occur, the warm surface water is close to the west coast of South America and forms a “lid” preventing upwelling of the nutrient-rich deep water
As a result, the fish population declines rapidly and the effects on the economy of nations depending on these fisheries (e.g. Chile) can be severe
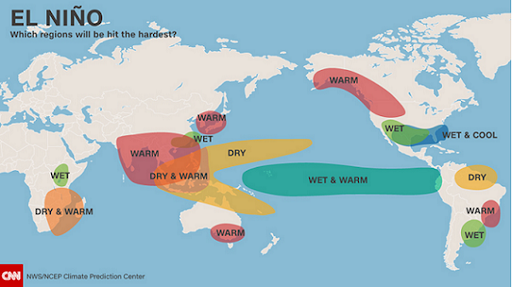
Global El Nino Effects
Years with El Nino conditions tend to have higher average global T, but the more detailed effects of El Nino can be seen in this figure
The take-home message is that El Nino effects are not only local-they affect the whole planet
Current El Nino?
We are in the first year of an El Nino
Will probably last 2 years total
Makes the globe warmer
May increase hurricane frequency
May make the winter warmer