Classical Epidemiology
studies origins of health problems
Clinical Epidemiology
study patients in health care settings in order to improve the diagnosis and treatment
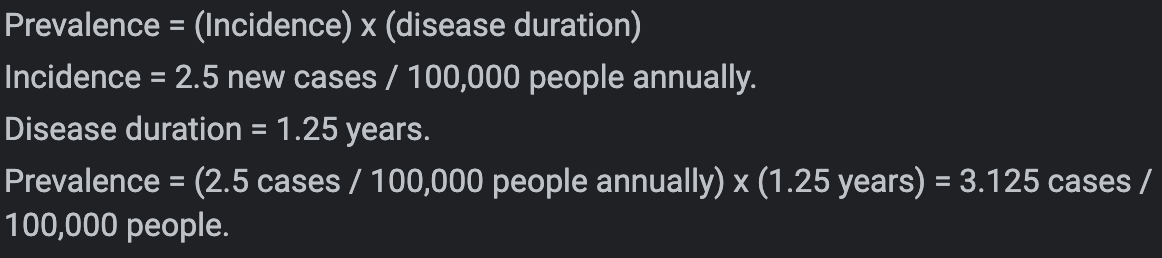
Incidence
# of new instances of disease in a population over a given time period
Measures rapidity of disease occurrence
X cases / Y population / Z time
Time = the duration of the illness or condition
Prevalence
# of affected persons in the population at any given point in time
Measures the proportion of the population with disease \n \n X cases / Y population
Point Prevalence
snapshot of the population + its rate of a certain disease at a point in time
Period Prevalence
tracks the prevalence over a certain duration
13 Steps to Investigate Outbreak
Prepare for field work - Research and Supplies, Official Arrangements, Safety Protocols, and Contacts
Establish the Existence of an Outbreak - Consider Severity, Potential for Spread, Public Concern, and Availability of Resources
Verify the Diagnosis - Verify Procedures and Eliminate Experimental Error (and Other Errors/Biases, for That Matter)
Construct a Working Case Definition
Find Cases Systematically and Record Information - Time: Tables, Epi Curves; Place: Geographical Extent of Disease & Spot Map; Identify By Demographic Information or Exposures to Risk Factor
Describe and Orient the Data in Terms of Person, Place, and Time - Descriptive Epidemiology
Develop Hypotheses (Agent/Host/Environment Triad) = Chain of Transmission
Evaluate Hypotheses - Analytical Studies (MUST Have a Control Group)
Refine Hypotheses if Necessary
Compare and Reconcile with Laboratory and/or Environmental Studies
Implement Control and Prevention Measures (ASAP!)
Initiate or Maintain Surveillance - Monitor Implementation: Track New Cases, Check the Outbreak’s Spread Outside Targeted Area, Control and Change if Needed
Communicate Findings - Reports, To Important People and Public
5 Steps for Surveillance
Identify, define, and measure the health problem of interest
Collect and compile data about the problem (and if possible, factors that influence it)
Analyze and interpret these data
Provide these data and their interpretation to those responsible for controlling the health problem
Monitor and periodically evaluate the usefulness and quality of surveillance to improve it for future use. (Surveillance of a problem often does not include actions to control the problem
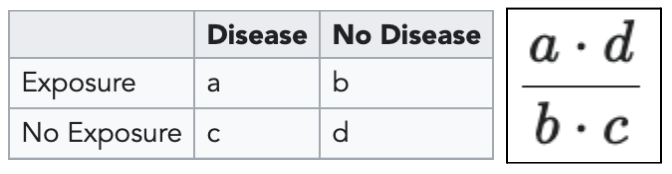
Odds Ratio
the odds of an event in an experimental group relative to that in a control group
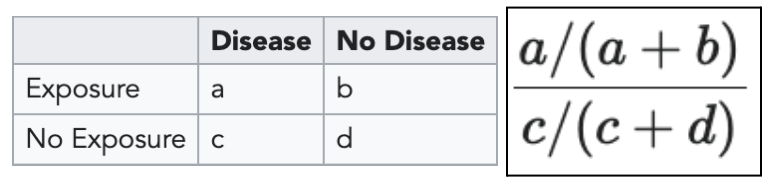
Relative Risk
ratio of risk of an event in one group (e.g., exposed group) versus the risk of the event in the other group (e.g., nonexposed group)
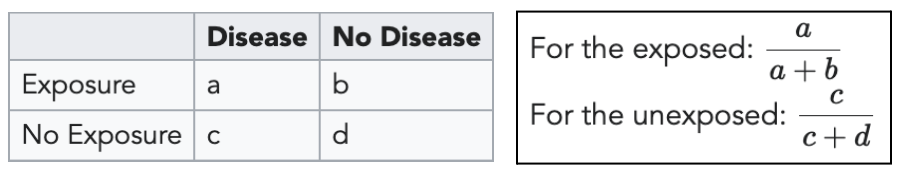
Attack Rate
rate that a group experienced an outcome or illness equal to the number sick divided by the total in that group
For exposed: a/(a+b) → should be HIGH
For unexposed: c/(c+d) → should be LOW
Chi-Square
used to determine the statistical significance of the difference indicated by the relative risk or odds ratio; compares your observed values (a, b, c, and d) with the expected values for those same groups
Expected Value: [ (a+b)(b+c) ] / (a+b+c+d)
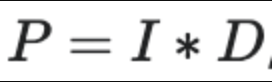
P-value
the measure of how confident you are that your findings are NOT due to chance
If P-value is LESS than alpha (0.05 or 5%), the data is significant
ex) P-value of 0.01 → 10% chance your results were a result of random fluctuations
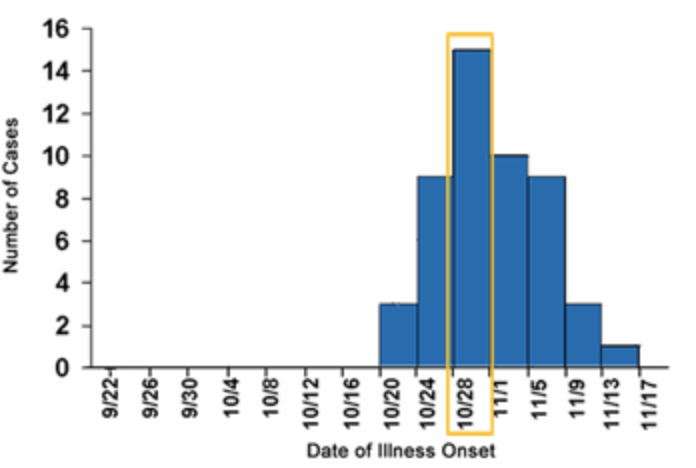
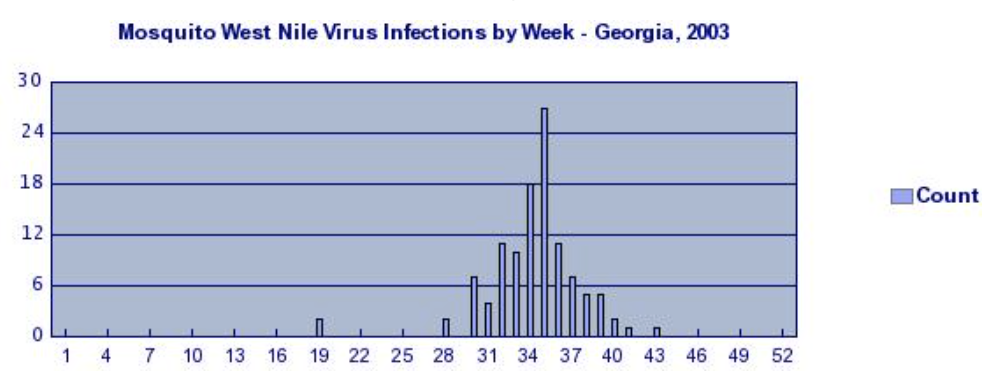
Epi-Curves
a histogram (graph consisting rectangles) that shows the course of an outbreak by plotting the number of cases of a condition according to the time of onset
Point Source
persons are exposed over a brief time to the same source, such as a single meal or an event
Shape of curve (commonly) RISES RAPIDLY + contains a definite peak, followed by a gradual decline
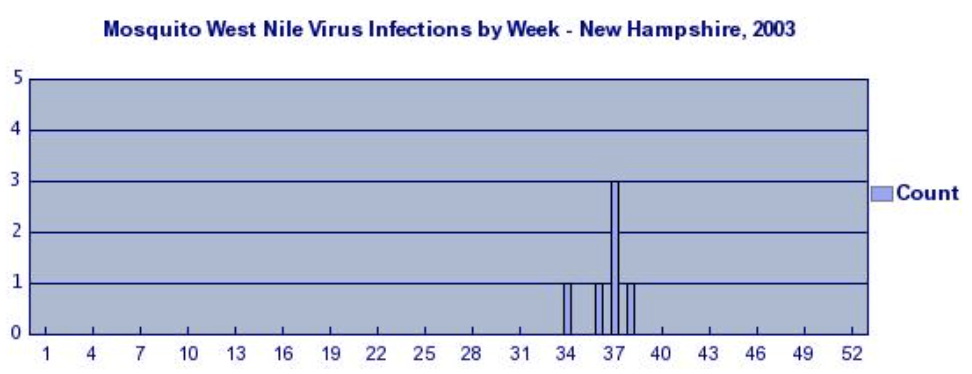
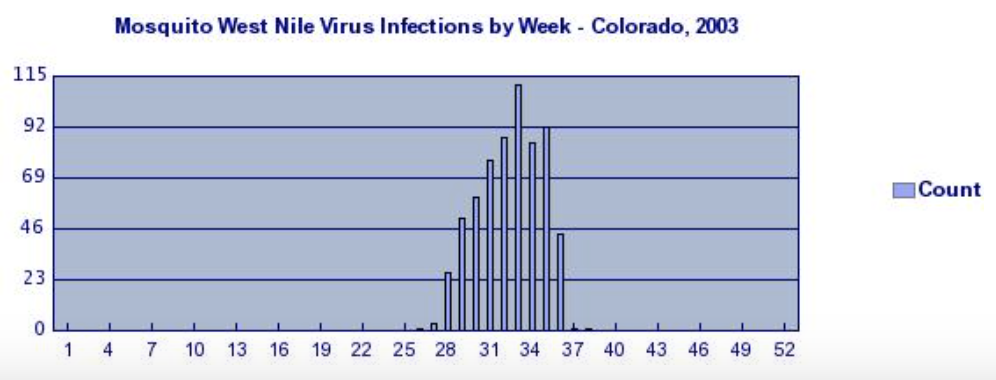
Continuous Common Source
when persons are exposed to the same source but exposure is prolonged over a period of days, weeks, or longer
*the down slops of the curve may be very SHARPif common source is removed or gradual if the outbreak is allowed to exhaust itself
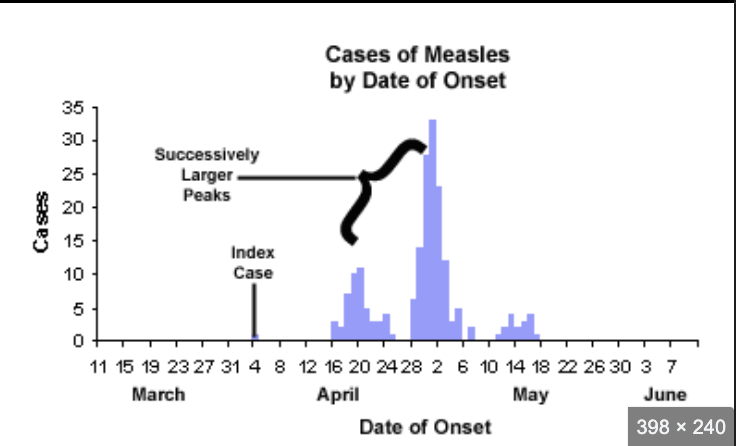
Propagated (Progressive Source)
when one or more of the first wave of cases serves as a source of infection for subsequent cases and those subsequent cases, in turn, serve as sources for later cases
SHAPE: curve usually contains a series of successively larger peaks (reflects increasing # of cases caused by person-to-person contact)
distance between peaks may be rough indication of the incubation period of the disease
As outbreak progresses, peak flattens out
Random Error
the result of fluctuations around a true value because of sample population; use of invalid outcome. measure that equally misclassifies cases. and. controls
can be reduced by: INCREASING sample size + making measurements more precise
Precision
measure of random error that is inversely related (INCREASING random error DECREASES precision)
Systematic Error
usually consistent and repeatable and often occurs from flawed equipment or experimental design
Selection Bias
when selection of participants for a study is affected by an unknown variable that is associated with the exposure and outcome being measured
Information Bias
when bias (any systematic error) is introduced though an error in measurement or observation
Confounding bias
results from mixing effects of several factors (deals with causation and NOT variations in study results)
Hill’s Criteria for Causation
nine viewpoints by which to evaluate human epidemiologic evidence to determine if causation can be deduced
Strength of Association - relationship is clear and risk estimate is high
Consistency - observation of association must be repeatable in different populations at different times
Specificity - a single cause produces a specific effect
Alternative Explanations - consideration of multiple hypotheses before making conclusions about whether an association is causal or not
Temporality - cause/exposure must precede the effect/outcome
Dose-Response Relationship - an increasing amount of exposure increases the risk
Biological Plausibility - the association agrees with currently accepted understanding of biological and pathological processes more exposure = more risk
Experimental Evidence - the condition can be altered, either prevented or accelerated, by an appropriate experimental process
Coherence - the association should be compatible with existing theory and knowledge, including knowledge of past cases and epidemiological studies
Infant Mortality Rates
ratio of deaths to births
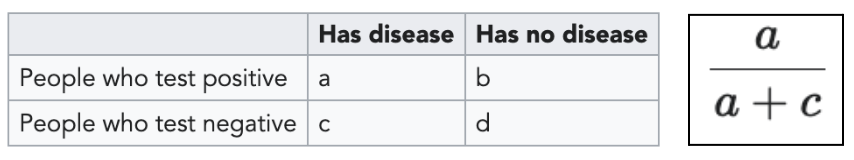
Sensitivity
the chance of testing positive if you do have the disease
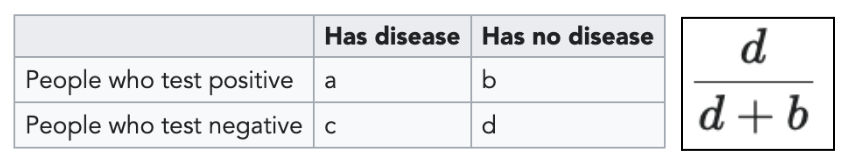
Specificity
the chance of testing negative if you do not have the disease
Attack Rate
total number of new cases / total population
Case Definitions
a set of standard criteria for classifying whether a person has a particular disease, syndrome, or other health condition
includes criteria for person, place, time, and clinical features
Length Time Bias
overestimation of survival duration due to the relative excess of cases detected that are asymptomatically progressing, while fast progressing cases are detected after giving symptoms
Simpson’s Paradox
Women appeared to be more susceptible (influenced) to an illness than men, but when studies were carried out, men were found to have higher probability of contracting illness
Pigmalion Effect
researchers convey high expectations to subjects; the subjects produce those results
Cross Sectional
a survey, health questionnaire, “snapshot in time”
Fastest
Least Expensive
Good for more than 1 Outcome


![<p>used to determine the statistical significance of the <em>difference</em> indicated by the relative risk or odds ratio; compares your observed values (a, b, c, and d) with the <em>expected</em> values for those same groups</p><p></p><p>Expected Value: [ (a+b)(b+c) ] / (a+b+c+d)</p>](https://knowt-user-attachments.s3.amazonaws.com/0fbde2c2d102499394777907f1387382.jpeg)