Sentence stems, formulas, comparison vocabulary, calculator commands 😘😘 -Always write full sentences/interpretation WITH CONTEXT -Show your work AND calculator commands + process -Show which formula and procedures you are using
Qualitative
Categorical (categories) Data, answering as a category.
Pie charts, mosaic plots, bar graphs
Quantitative
Numerical Data, answering as a number.
Questions such as: What is your height?
SOCS
Shape - Symmetric or skewed (to left or right), unimodal or bimodal.
Outliers - Extreme values (1.5 times IQR), data is always skewed TOWARDS outliers.
Center - for skewed data: median (resistant to outliers and change) for symmetric data: mean (use when possible, nicer to work with).
Spread - Median, range (max-min), IQR, mean, standard deviation.
Empirical Rule
Normally distributed data follows the 68, 95, 99.7 rule:
68% of data is within 1 sd of the mean.
95% of data is within 2 sd of the mean.
99.7% of data is within 3 sd of the mean.
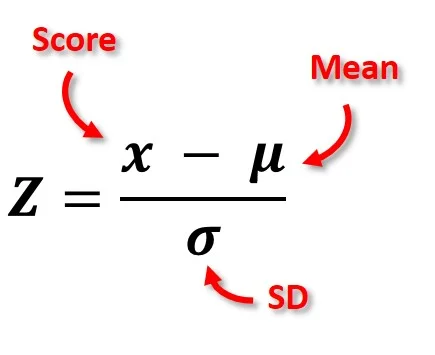
z scores (❤ ω ❤)(❤ ω ❤)
The number of standard deviations above or below the mean of a specific value.
Formula: Z score = (x-μ)/σ
Percentile
Percent (%) of data at OR below a certain value. (include the value in the calculation)
Slope interpretation 😍
For every increase of 1 (x units) the predicted (y units) will increase/decrease by (slope in units)
y intercept interpretation
at/when (x variable) is 0, the predicted (y variable) is (y-intercept, units)
What is r? What type of relationship?
What is the calculator command?
r is the correlation coefficient which is the strength of the relationship
Negative value: negative correlation
Positive value: positive correlation
Close to 1 or -1: Strong relationship (with 1 or -1 being perfect)
0.3 to 0.7 or -0.3 to -0.7: Moderate relationship
Close to 0: Weak relationship
Calculator Command: Make sure stat diagnostics are on (mode>stat diagnostics on) THEN go to stats>calc>8
Residual
The difference between the actual value and the predicted value
Formula: y - ŷ
r² interpretation and definition
Definition: Coefficient of determination
Interpretation: __% of the (y variable in context) can be explained by variation in the (x variable in context)