Hindsight Bias
The tendency to believe, after learning an outcome, that one would have foreseen it
Critical Thinking
Thinking that does not blindly accept arguments and conclusions
Examines assumptions, assesses the source, discerns hidden values, evaluates evidence, and assesses conclusions
Theory
An explanation using an integrated set of principles that organizes observations and predicts behaviors or events
Hypothesis
A testable prediction, often implied by a theory
Operational Definition
A carefully worded statement of the exact procedures used in a research study
Replication
Repeating the essence of a research study, usually with different participants in different situations, to see whether the basic finding extends to other participants and circumstances
Case Study
A descriptive technique in which one individual or group is studied in depth in the hope of revealing universal principles
Naturalistic Observation
Observing and recording behavior in naturally occurring situations without trying to manipulate and control the situation
Survey
A technique for ascertaining the self-reported attitudes or behaviors of a particular group, usually by questioning a representative, random sample of the group
Sampling Bias
A flawed sampling process that produces an unrepresentative sample
Population
All those in a group being studied, from which samples may be drawn
Random Sample
A sample that fairly represents a population because each member has an equal chance of inclusion
Correlation
A measure of the extent to which two variables change together, and thus of how well either variable predicts the other
Correlation Coefficient
A statistical index of the relationship between two variables (from -1.0 to +1.0)
Scatterplot
A graphed cluster of dots, each of which represents the values of two variables
The slope of the points suggests the direction of the relationship between two variables
The amount of scatter suggests the strength of the correlation (little scatter indicates high correlation)
Illusory Correlation
The perception of a relationship where none exists
Experiment
A research method in which an investigator manipulates one or more factors (independent variables) to observe the effect on some behavior or mental process (dependent variables)
By random assignment of the participants, the experimenter aims to control other relevant variables
Experimental Group
In an experiment, the group exposed to the treatment, that is, to one version of the independent variable
Control Group
In an experiment, the group not exposed to the treatment
Contrasts with the experimental group and serves as a comparison for evaluating the effect of the treatment
Random Assignment
Assigning participants to experimental and control groups by chance, thus minimizing preexisting differences between the different groups
Double-Blind Procedure
An experimental procedure in which both the research participants and the research staff are ignorant to whether the participants have received the treatment or a placebo
Commonly used in drug-evaluation studies
Placebo Effect
Experimental results caused by expectations alone
Any effect on behavior caused by the administration of an inert substance or condition, which the recipient assumes is an active agent
Independent Variable
The experimental factor that is manipulated
The variable whose effect is being studied
Extraneous Variable
An extra variable that may or may not interfere with an experiment (ex. weather, clothing)
Confounding Variable
A factor other than the independent variable that might produce an effect in an experiment
Third Variable
Often used in correlational studies
A variable (could be considered confounding) in an experiment that can help explain correlation
Dependent Variable
The outcome factor
The variable that may change in response to manipulations of the independent variable
Validity
The extent to which a test or experiment measures or predicts what it is supposed to
Descriptive Statistics
Numerical data used to measure and describe characteristics of groups
Includes measures of central tendency and measures of variation
Histogram
A bar graph depicting a frequency distribution
Mode
The most frequently occurring score(s) in a distribution
Mean
The arithmetic average of a distribution
Median
The middle score in a distribution
Half the scores are above it and half are below it
Skewed Distribution
A representation of scores that lack symmetry around their average value
Range
The difference between the highest and lowest scores in a distribution
Standard Deviation
A computed measure of how much scores vary around the mean score
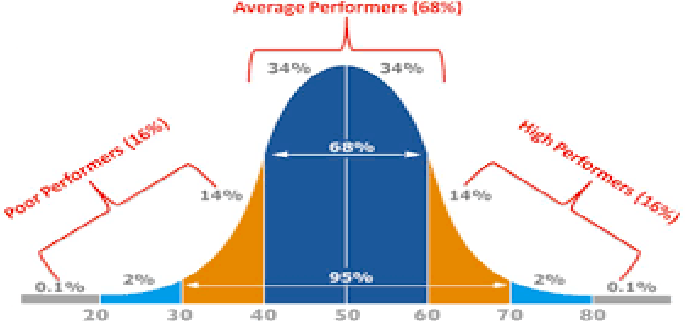
Normal Curve
(aka normal distribution)
A symmetrical, bell-shaped curve that describes the distribution of many types of data
Most scores fall near the mean (about 68% fall within one standard deviation of it) and fewer and fewer near the extremes
Inferential Statistics
Numerical data that allows one to generalize-to infer from sample data the probability of something being true of a population
Statistical Significance
A statistical statement of how likely it is that an obtained result occurred by chance
P-Value
(aka probability value)
Measures how likely it is that any observed difference between groups is due to chance
Culture
The enduring behaviors, ideas, attitudes, values, and traditions shared by a group of people and transmitted from one generation to the next
Informed Consent
An ethical principle that research participants be told enough to enable them to choose whether they wish to participate
Debriefing
The postexperimental explanation of a study, including its purpose and any deceptions, to its participants