Tags & Description
Short Run Production (SR)
time period when at least one input (otherwise known as factor of production) is fixed
Long Run Production (LR)
all inputs are variable
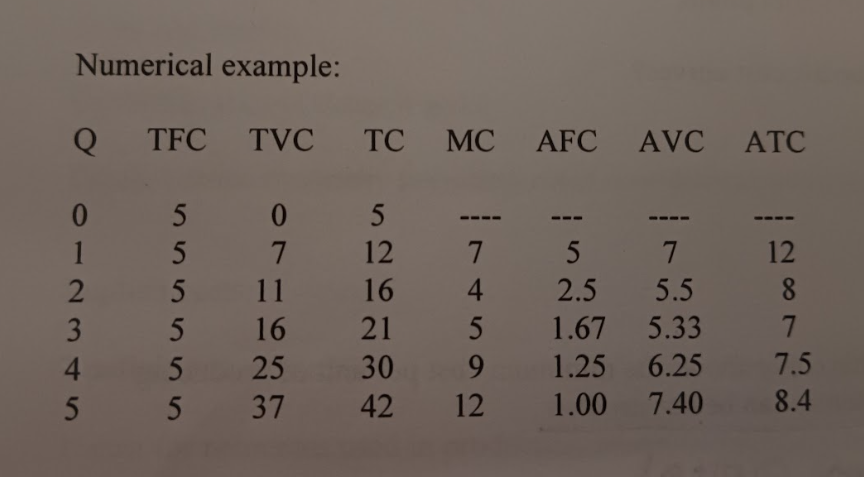
What are the Short Run Production Costs and what do they mean?
Total fixed costs (TFC): costs that do not vary with output (also called overhead costs). This has to be paid no matter what and stays the same.
Total Variable Costs: costs that vary with output. If there is more of a good or service TVC increases, less of a good or service TVC decreases.
Total Costs: TFC + TVC
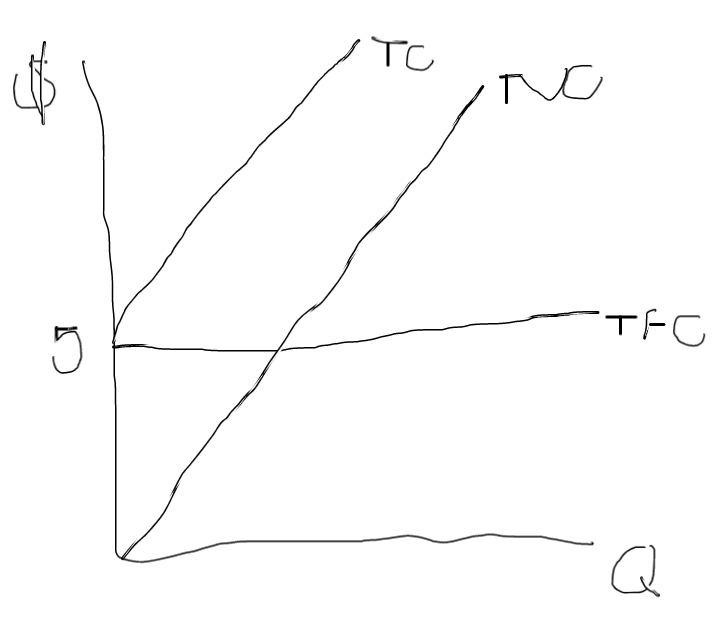
What does the graph for TFC, TVC and TC look like?
TVC and TC have to be parallel because they’re the same distance in between them
Average costs and Marginal Costs
Average Fixed Cost (AFC) = Total fixed cost/Quantity
Average Variable Cost (AVC) = Total Variable cost/Quantity
Average Total Cost (ATC) = Total Cost/Quantity = (AFC + AVC)
Marginal Cost (MC) = Δ TC/ ΔQ = ΔTVC/ΔQ
Marginal Cost also means a change in total costs when one more unit of output is produced.
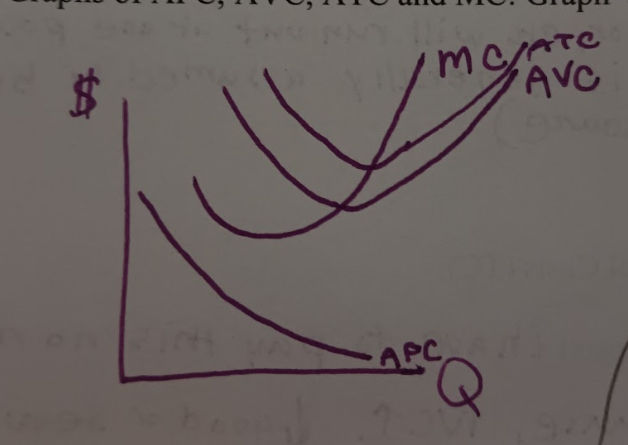
Graph of AFC, AVC, ATC, and MC
MC Intersects AVC and ATC at their minimum points
What will shift the SR Cost Curves?
Technology Improvements
Changes in Resources Prices
Changes in business taxes
What is the Long Run Production Cost?
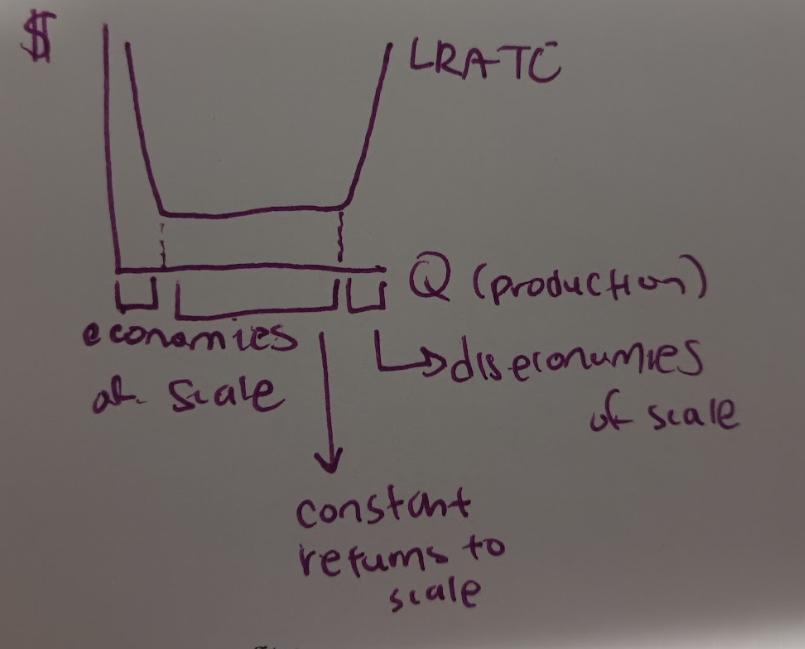
Long run average total cost curve (LRATC): this curve shows the minimum cost per unit of producing each level of output when any desired size of factory can be constructed (can vary capital)
What are the 3 regions of LRATC?
Economies of scale: as production increases, cost per unit decreases and so the LRATC is downward sloping.
Why do economies of scale occur (for example it’s really expensive to make a drug)?: Specialization of labor and management, efficient capital, and fixed cost of design and development.
Constant returns to scale: as production increases, cost per unit stay the same and so the LRATC is horizontal.
Why do constant returns to scale occur? The percentage change in output is equal to the percentage change in inputs.
Diseconomies of scale: as production increases, cost per unit increases and so the LRATC is upward-sloping.
Why do diseconomies of scale occur? The firm is so large that management becomes difficult (becomes out of control b/c its big).
What does the graph for LRATC look like?
What are explicit costs?
monetary payments made to purchase resources
What are implicit costs?
Cost for resources used in production where no monetary payment is made.
The value of the firm’s resources in their best alternative use (better definition).
Accounting profits vs Economic Profits
Accounting profit = revenues - explicit costs
Economic profit = revenues - (explicit costs + implicit costs)
-Accounting profits underestimate the economic costs and so overestimate profits
Is it okay if economic profits equal 0?
Yes! This means firms are making a normal profit which is the minimum profit necessary to keep a firm in operation.
Market Structure
the level of competition, firm behavior, and economic outcomes are analyzed in markets
What are the 5 characteristics of Perfect Competition?
Many sellers and buyers: this means each buyer and seller has a negligible share of the market
Insignificant barriers to entry or exit: this means firms can freely enter or exit the market
Standardized product produced by each firm in the industry: each product is identical and so there is no brand or consumer loyalty (people will only care about prices)
Perfect information: each buyer and seller knows everything about price and quality of the product.
The firm is a price taker: since each firm is so small compared to the market, it cannot affect the market price (charge equilibrium price).
Example of a perfectly competitive industry: agriculture
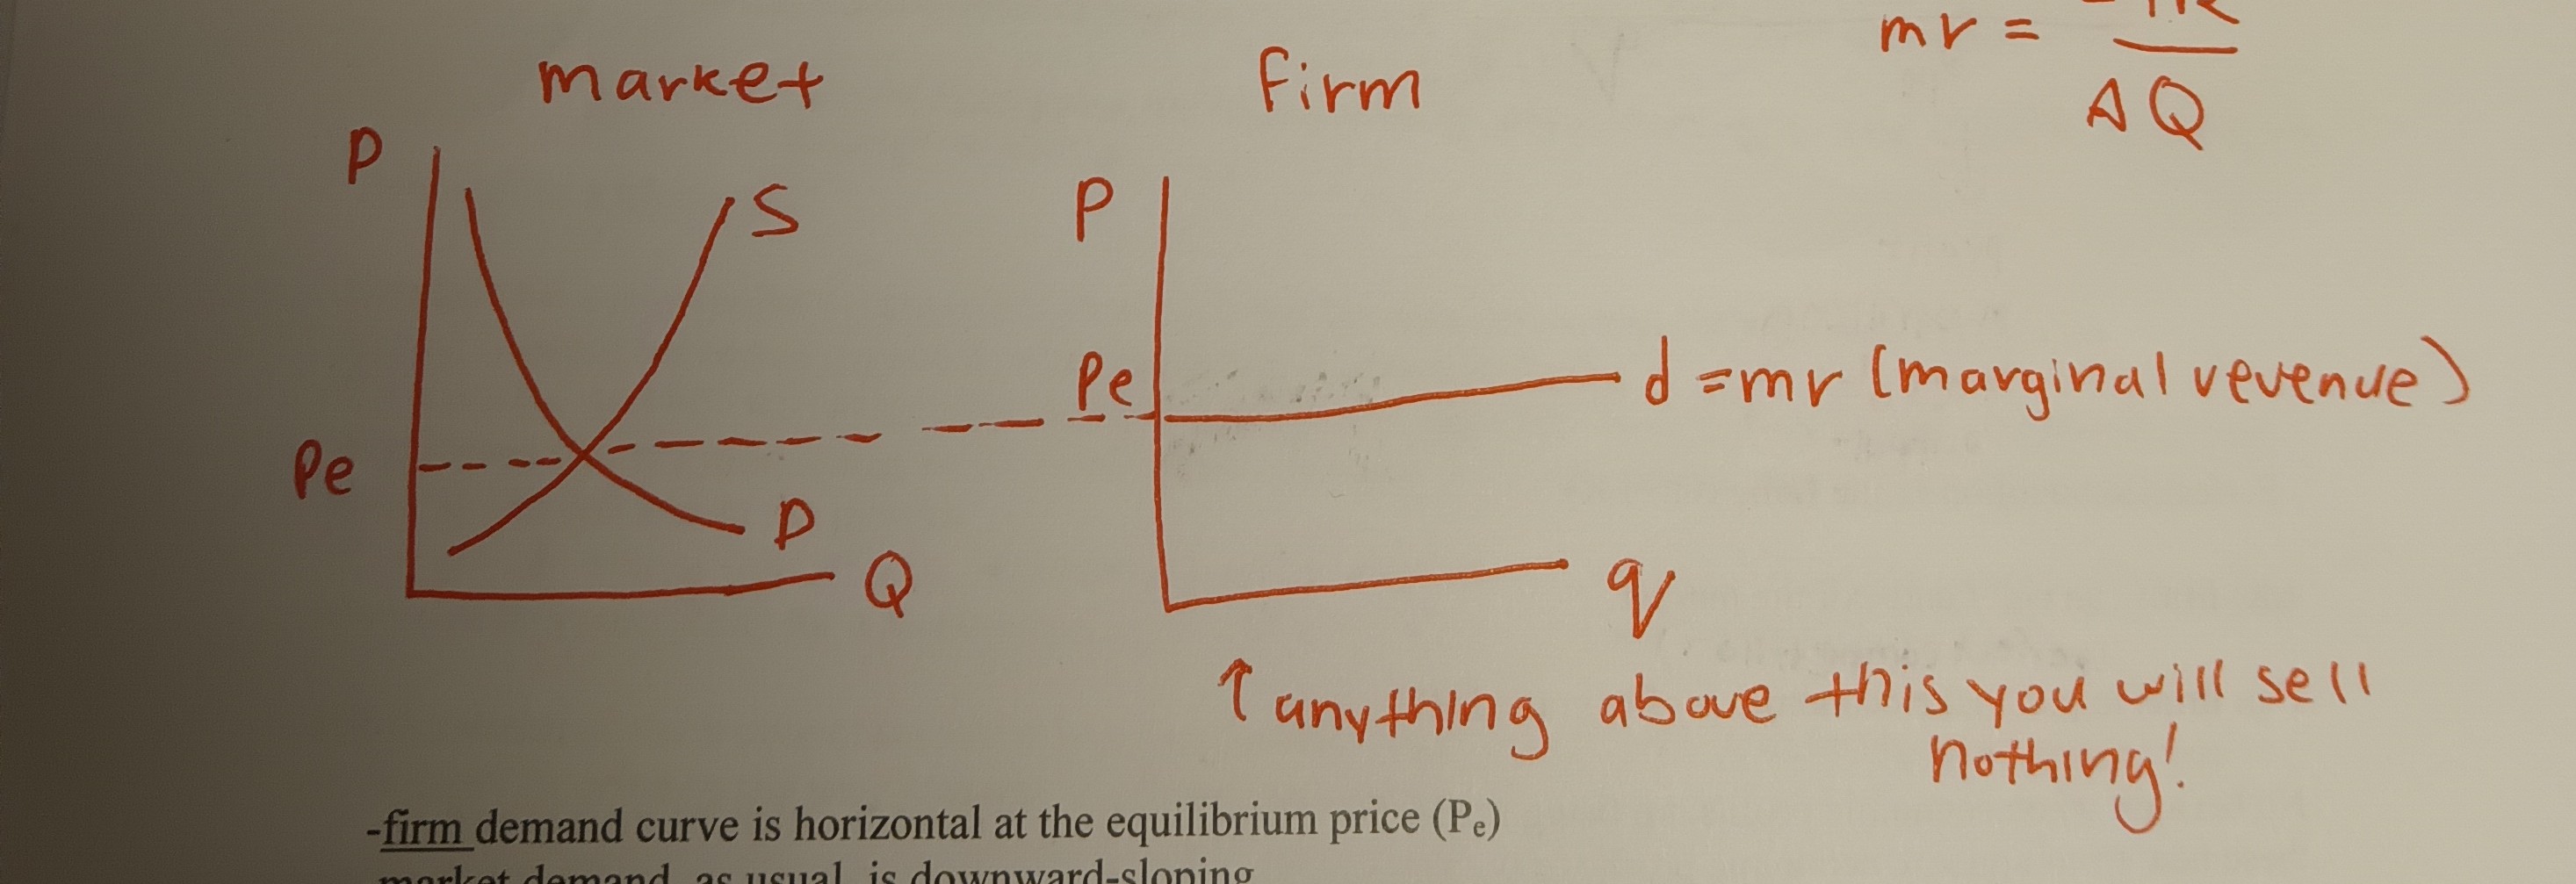
Market Demand Curve vs Firm Demand Curve
Firm demand curve is horizontal at the equilibrium price (Pe)
Market demand, as usual, is downward sloping
Marginal revenue (MR) and the firm demand curve
Marginal revenue is the increase in total revenue (TR) from the sale of another unit of output
formula for MR: MR = ΔTR/ΔQ
in perfect competition, MR = P (equilibrium price)
Thus, the firm demand curve is also the marginal revenue curve (MR-curve)
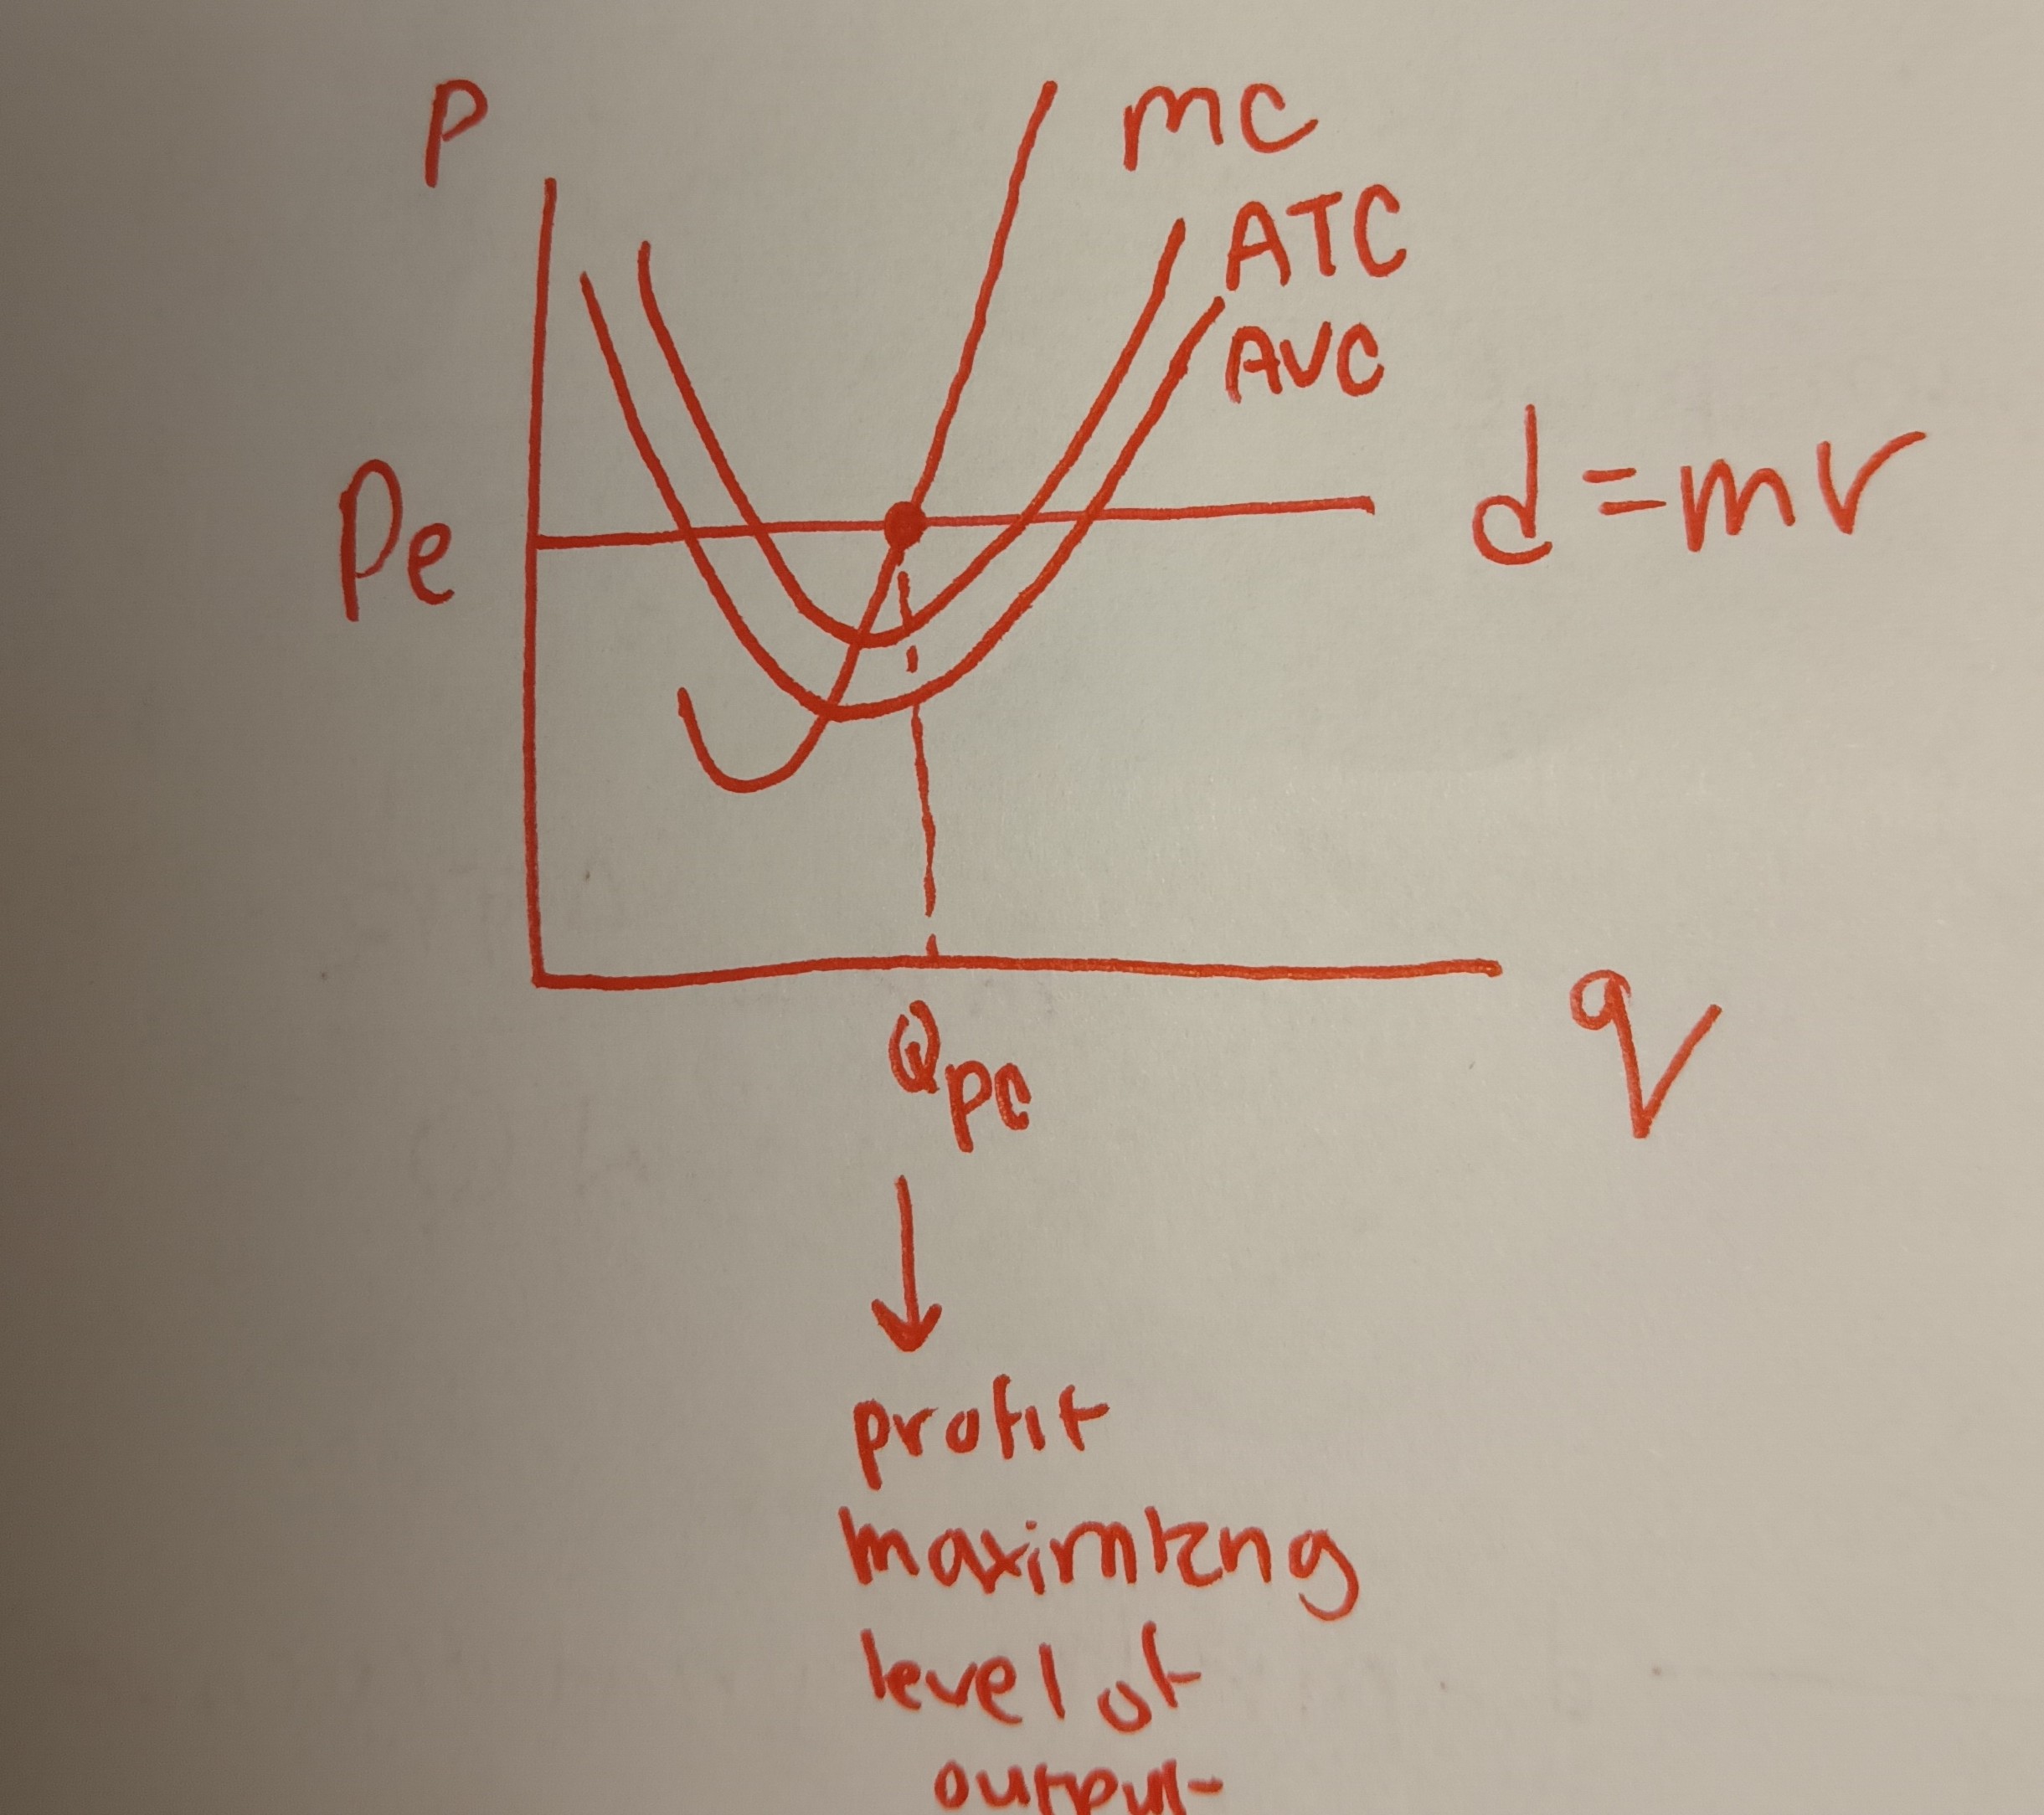
Profit Maximization in the Short Run (SR)
SR: no entry or exit of firms can occur
General profit-max rule: produce where MR = MC
Special profit-max rule for perfect competition: produce where P = MC
What is the rationale for the profit max-rule?
If a firm produces where MR > MC, it has made a profit on the last unit produced and so the firm should produce more output
If a firm produces where MR < MC, it has made a loss on the last unit produced and so the firm should produce less output
Thus, to max. profits, the firm should produce exactly MR = MC
Note: firms in the p.c. can make economic profits in the short run
Perfect Competition in the Long Run (LR)
Long Run: firms can enter and exit the market
Firms CANNOT make economic profits in the long run because when economic profits are being made, free entry allows new firms to enter the market and these new firms squeeze economic profits to 0.
Characteristics of the LR in Perfect Competition
Firms produce at lowest point on their LRATC
Because firms produce at the lowest possible cost, firm charges lowest possible price
Firms must use most efficient, least costly production techniques (will go out of buisness if you don’t do this)
Firms make 0 economic profit or a normal profit
Characteristics of a Monopoly
One seller of good or service
No close substitutes for goods or services
High barriers to entry: high barriers to entry make it difficult or impossible for new firms to enter an industry
Monopolist is a price-maker: this means that the monopolist has considerable control over the price it changes. However they cannot change it ANY way they like
There is no equilibrium or market price in a monopoly
What are barriers to entry and what are some types?
Barriers to entry: impediments that protect an established firm from potential competition
Legal barriers: these are barriers created by the government. Examples include patents, copyrights, licenses, and public franchises
Control over essential inputs: one firm keeps other firms from entering an industry by denying them a crucial input
Economies of scale: cause a natural monopoly which is when one firm can supply the entire market at a lower per unit cost than would be achieved by 2 or more firms. Examples include natural gas, water and electricity (utilities). Natural monopolies are regulated by the government b/c you can’t compete those away.
Demand for a monopolist
Demand is downward sloping because the monopolist’s demand curve is the market demand curve and that is also downward sloping.
This means that if a monopolist wants to sell more of a product, it must lower its price and if it increases its price, it will sell less of the product (ex: if they increase natural gas prices, people could use less by changing the thermostat).
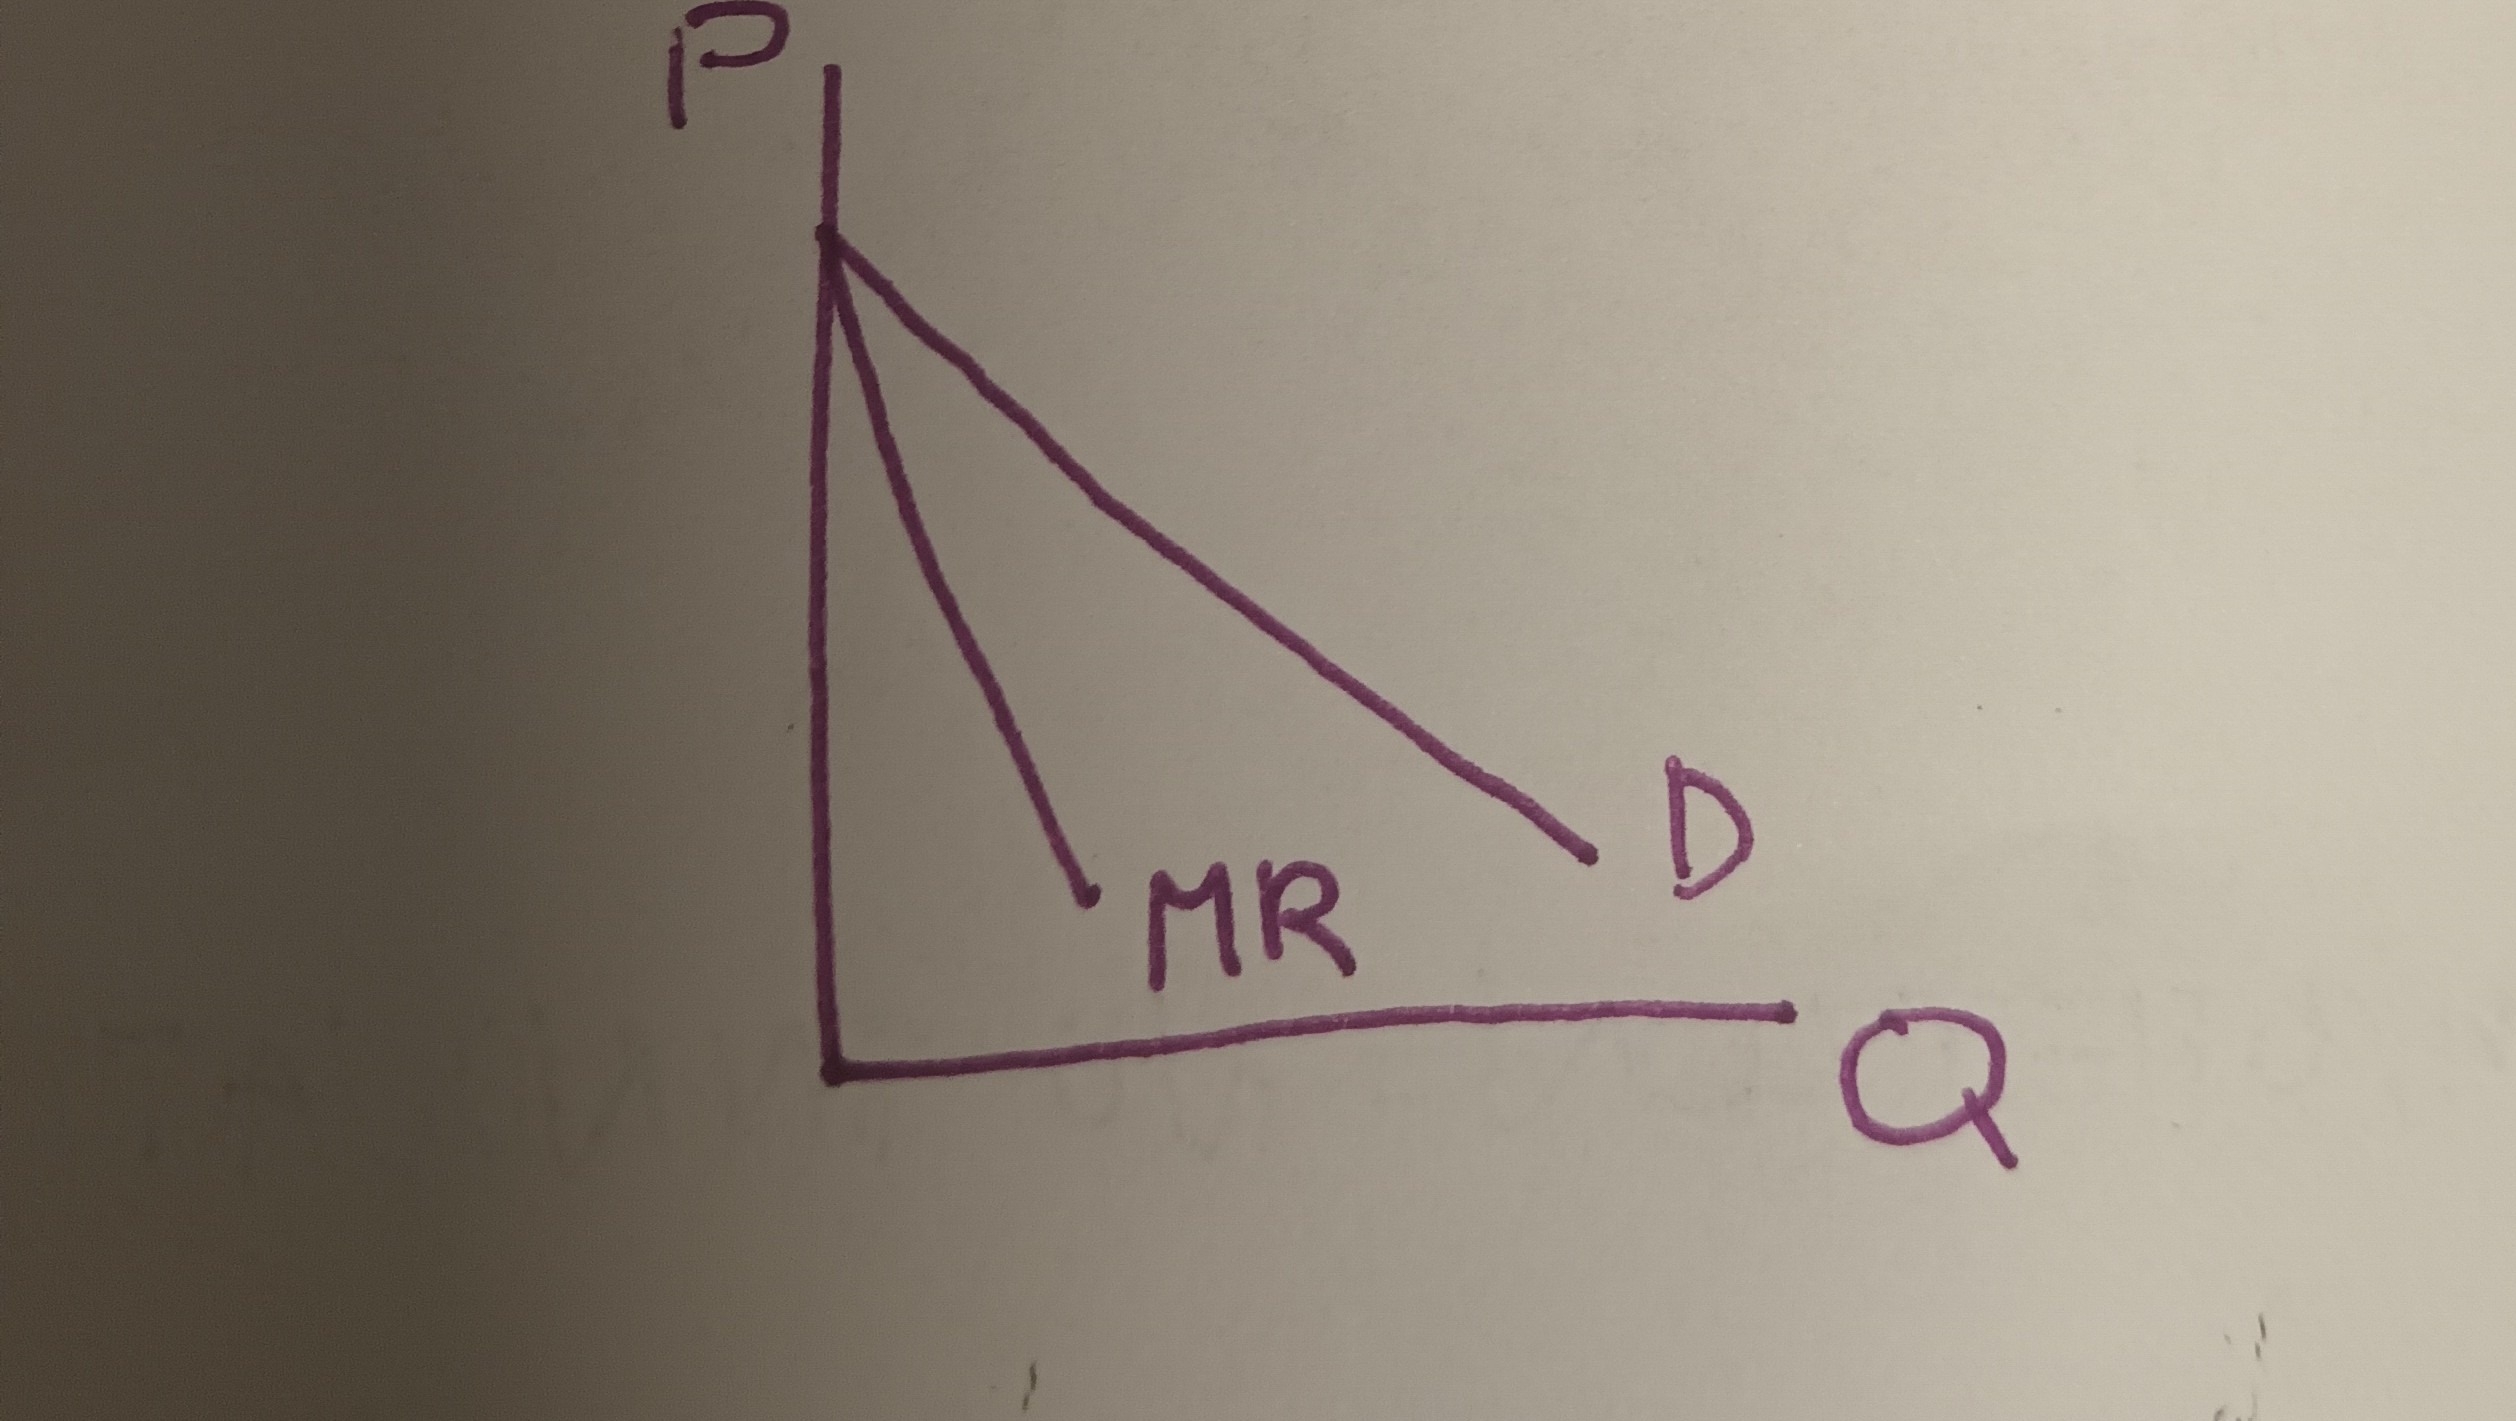
Marginal Revenue (MR) for a monopolist
MR decreases as the monopolist sells more of its product because to sell more of its product, the monopolist must lower its price on the next unit and on all previous units sold.
-This means the MR- curve is downward-sloping and is below the demand curve.
-This also means that for monopolist, P > MR
Graph of the monopolist’s demand and MR- Curves
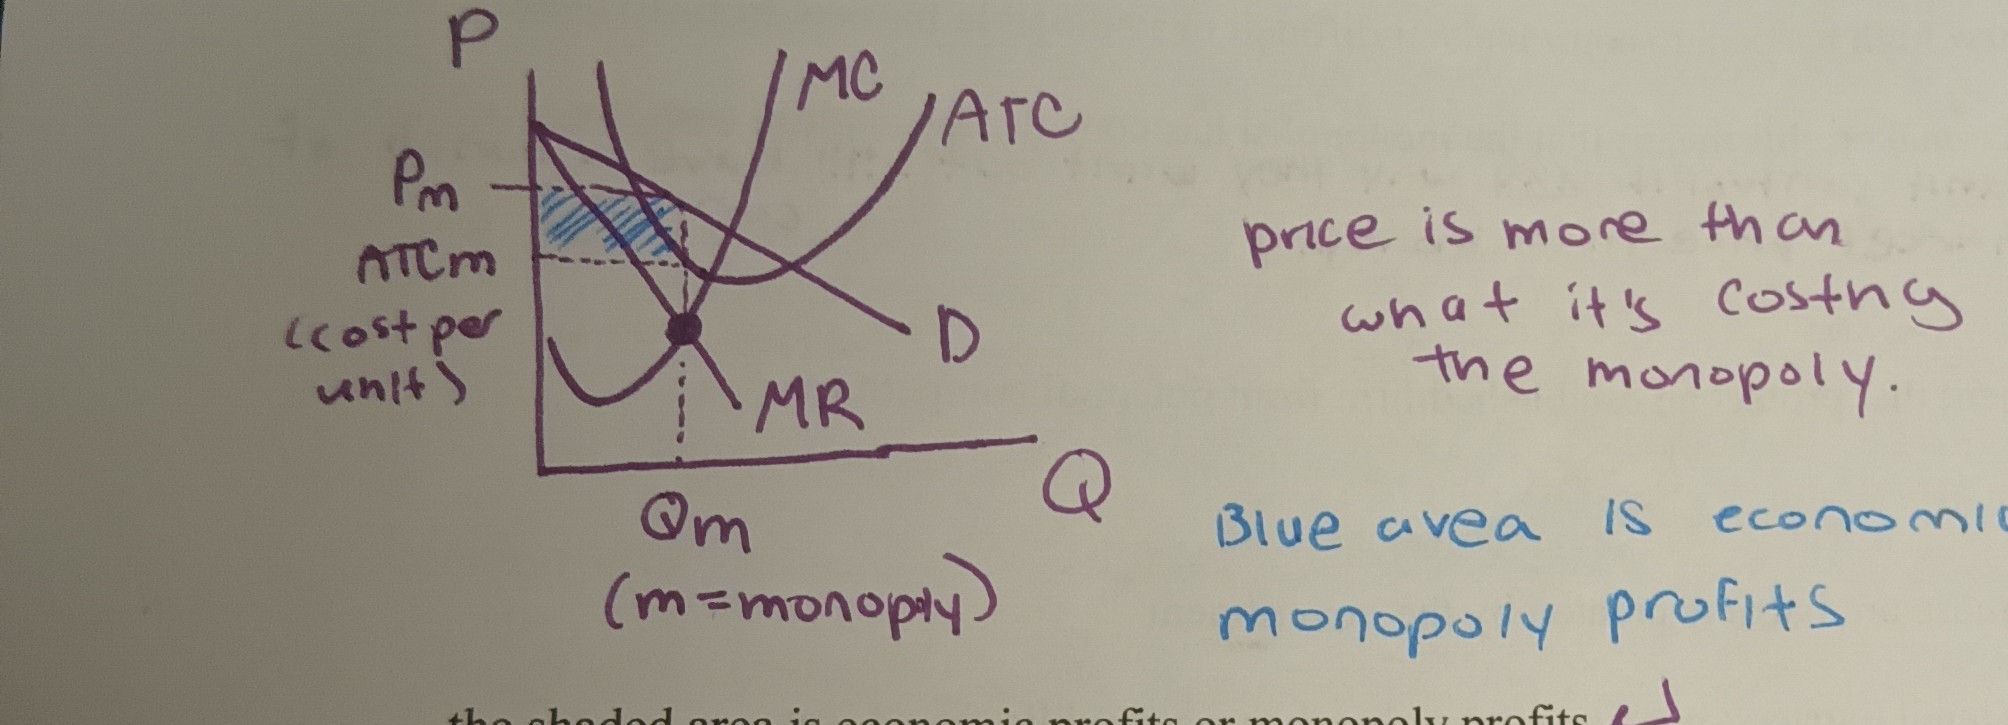
How does a monopolist max. profits?
They use the general profits max rule: monopolist produce where MR = MC
The selling price is more than what it costs monopolies and they have no competition so you can expect them to make a profit.
The blue shaded area is the economic or monopoly profits
For a monopolist, can economic profits persist in the LR?
Yes because new firms cannot enter the market because of high barriers of entry
The case against monopolies
Monopolies compare unfavorably to a perfect competition because:
price and profits are higher under monopoly than p.c.
output is lower under monopoly than p.c. Monopolists restrict output in order to increase price (monopolies are creating artificial scarcity on purpose).
Monopolists do not produce a min LRATC
Other Problems with Monopolies
Monopolists cause inequality in income because higher prices and profits under monopoly represent a redistribution of income from consumers to the monopolist
Legal monopolies waste resources by lobbying the gov to keep their monopoly: this is called rent-seeking
A Case for Monopoly: Does monopoly encourage innovation?
First, what is innovation? It is the development of new products, new tech, and cost saving production techniques
Argument that monopoly encourages innovation: monopolies have many resources to put into research and development (R&D) because they are large firms and have monopoly profits
Argument that monopoly discourages innovation: monopolies have NO INCENTIVE to innovate because of a lack of competitive pressure
Thus it isn’t clear that monopolies encourage innovation and compare to P.C., monopoly is an inferior market structure.
Market Structure Spectrum
p.c.(------M.C.----------------------oligopoly-------)monopoly
Characteristics of Monopolistic Competition
Many sellers or firms
Firms do not consider the reactions of their rivals when making price and output decisions
Insignificant barriers to entry or exit: this means that firms can freely enter and exit the market
Firms are price makers: firms have some control over price but less control than a monopolist
Product differentiation: each firm’s product is not a perfect substitute for the product of competing firms (not everyone is selling the exact same thing: similar but not identical)
-Note: it is product differentiation that gives each firm some price-making ability
Examples of M.C Industries
fast food (Wendy’s vs McDonald’s), gas stations, grocery stores, auto repair, law firms.
Demand Curve for a firm in M.C.
the firm’s demand curve is downward sloping but is more elastic or flatter than the monopolist’s demand curve because in M.C. each firm’s product has many close substitutes
Since the demand curve is downward sloping, the MR-revenue curve is downward sloping and below the demand curve which implies P > MR for a firm in M.C.
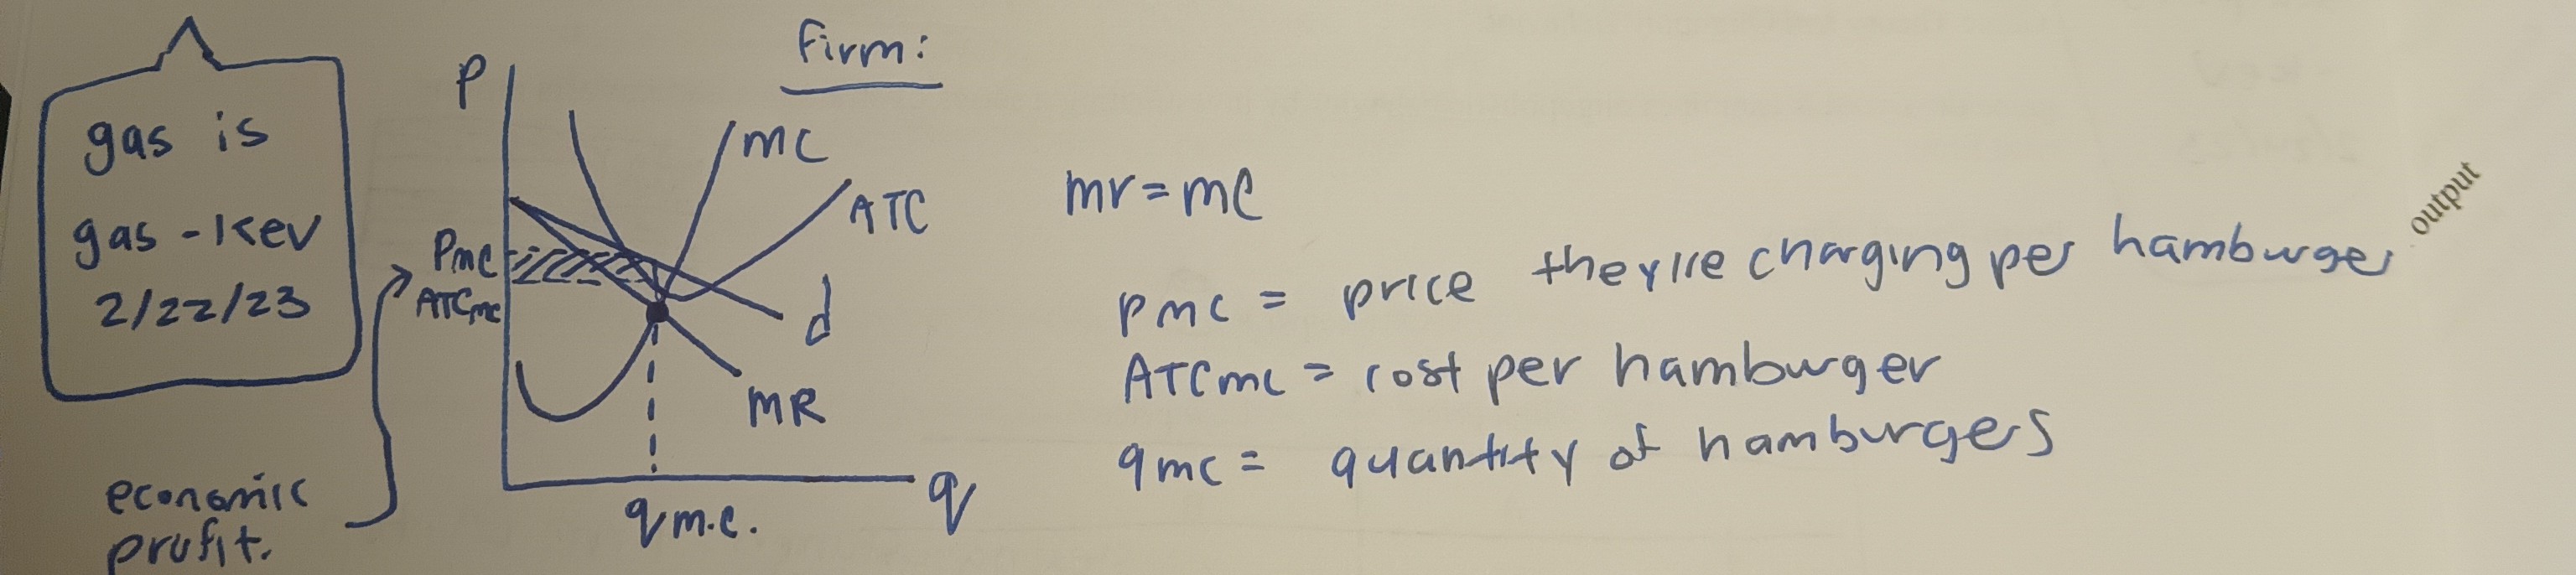
Profit Max for firms in M.C.
firms use the general case of the profit-max rule: produce where MR = MC
Monopolistic Competition in the Long Run
Firms cannot make profit in the long run because free entry in M.C. allows new firms to enter the market and this increased competition forces economic profit to 0; firms make a normal profit in the LR
The demand firm would get flatter, pmc gets lower, and then there is no profit.
However unlike P.C, firms do not produce at min. LRATC and so price under M.C. is higher than price under P.C.
Price Discrimination
Price Discrimination: The practice of charging different prices to different customers even though there is no difference in cost
Can only occur where this is imperfect competition because the seller must have some control over the price they charge.
What prices does a price discriminator charge?
firms charge price sensitive customers a low price; price sensitive customers have elastic demand (responsive to price). This could be the elderly or teenagers
Firms charge those customers who are not price sensitive a high price; those who are not price sensitive have inelastic demand (not responsive to price).
Why do firms do Price Discrimination?
Firms can increase revenues and so increase profits
Examples of Price Discrimination
movie tickets (buy earlier, they’re cheaper), airplane tickets, college tuition.
Characteristics of an oligopoly
Few sellers
Firms are price-makers: this means firms have significant control over price; more control than firms in M.C. but less than a monopolist
Price and output decisions of one firm affect the price and output decisions of other firms
High barriers to entry but barriers are lower than those for monopolist
Examples of a oligopoly: autos, aircraft production, breweries, soft drinks, breakfast cereals
What is Game Theory?
This examines oligopolistic behavior by investigating a series of strategies and payoffs among rival firms
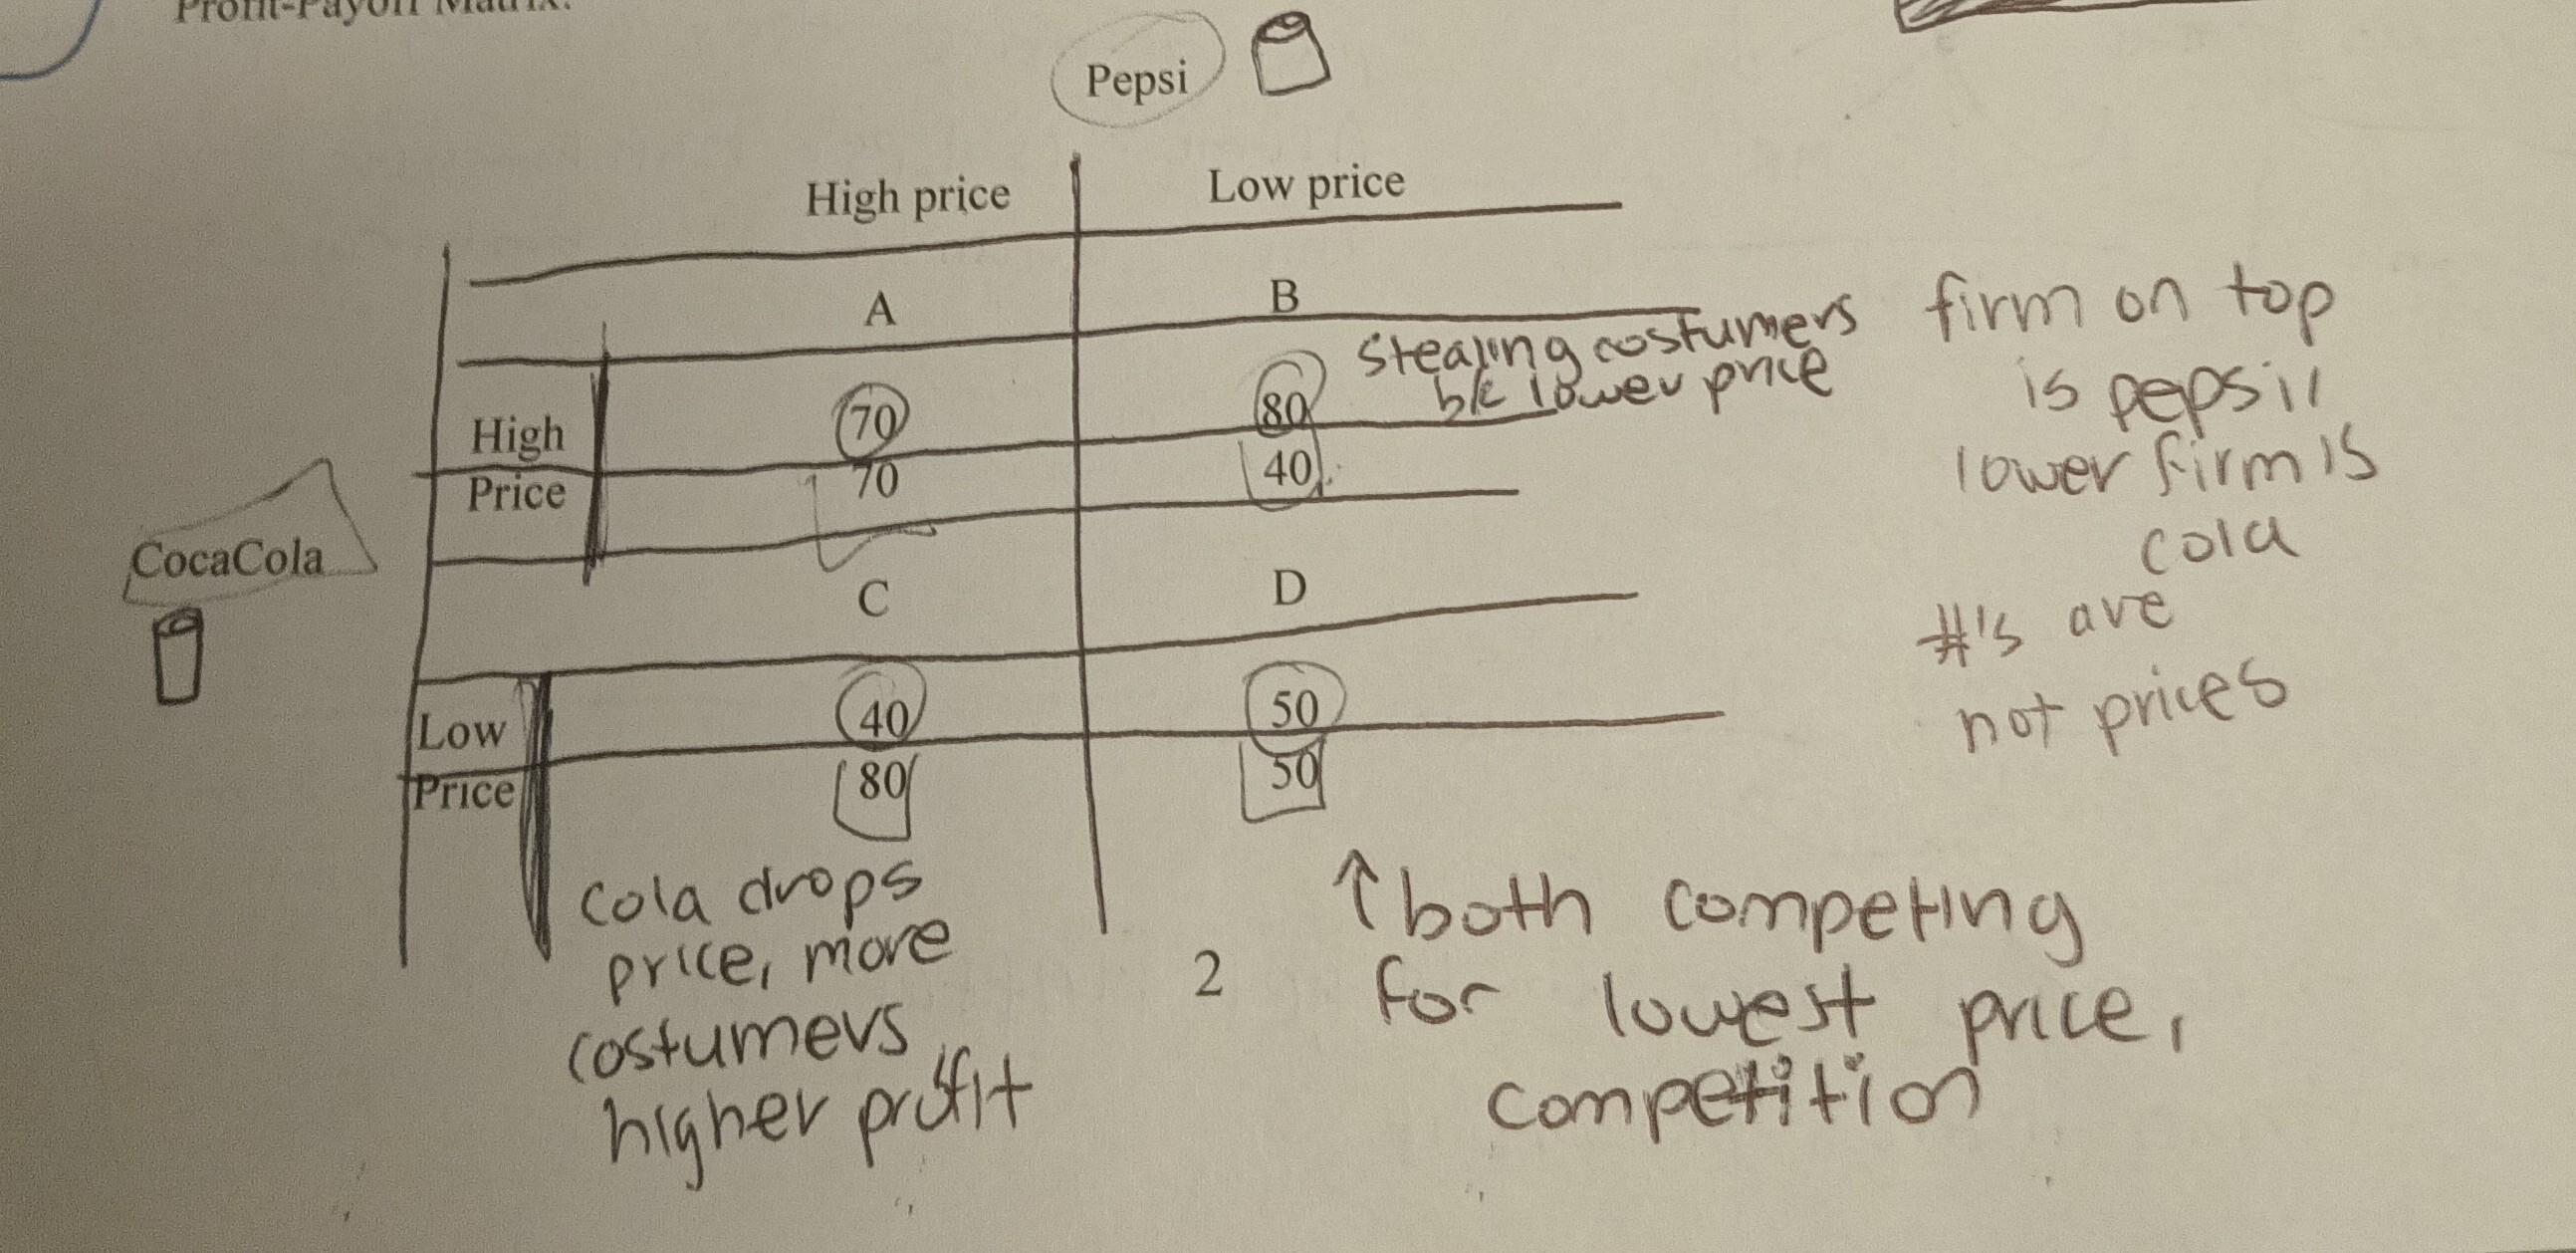
Profit Payoff Matrix
Payoff matrix has different cells which represent different price strategies for the two firms
Cell A represents the situation where both firms keep their prices high; here both firms make a high profit; this cell represents cooperative behavior by the firms; i.e., the 2 firms cooperate to charge a high price
Cell B and C represent the situation where one firm cooperates but the other doesn’t; this means one firm charges a high price while the other firm charges a low price; these 2 cells represent situations where one of the firms cheats; the cheating firm charges a low price and makes high profits while the cooperating firm charges a high price and makes low profits.
Cell D represents the situation where both firms charge a low price; both make the same low profits; this cell represents competition by both the firms.
This type of game theory represents the prisoners dilemma, where the best option is to have both people rat on each other or Cell D where both firms lower their prices.
Collusion and Cartels
In Cell A firms cooperate; another name for this is called collusion or the firms set the price together and do not compete.
When firms collude they may form a cartel, a formal organization of firms that attempts to act as if there was only one firm or acts like a monopoly
The purpose of a cartel is to reduce output, increase price and share monopoly profits *ex: OPEC
*Note: collusion and cartels are illegal in the united states
Obstacles to forming a cartel
Large number of sellers
Cost and demand differences among the firms
Existence of potential competition (ex: OPEC vs Fracking)
Cheating during economic downturn
*Note by cheating, a firm charges a price below the cartel price.
Price leadership
Another type of collusion or cooperation
This is a tacit or informal type of collusion (there is never any direct communication)
The price leader is the dominant or largest firm in the industry
The other firms follow the price changes of the price leader and by doing this the forms reduce output, charge higher prices, and share monopoly prices
Mergers and Oligopoly
Merger: combining the assets of 2 firms to form a single new firm
Mergers can reduce competition by reducing the number of competing firms
What are the 3 types of Mergers?
Horizontal Mergers: occurs when one firm combines with another firm that sells similar products in the same market (greatest chance of reducing competition). Examples include sprint and T-Mobile merging
Vertical Merger: a combo between firms in the same industry but at different stages in the production process (Disney buying Pixar)
Conglomerate Merger: these combine firm producing in different industries (mobile oil bought sears → went out of business)
What is the basic rationale for gov intervention in markets?
Market Failure: when markets fail to allocate resources efficiently.
Describe the market failure of monopoly power
A monopoly uses too few resources because it produces too little in order to increase prices
What can the government do to control monopoly power?
Use antitrust policy which are policies to increase competition and curb anticompetitive behavior
What are the two major antitrust policies and what did they do?
Sherman Act of 1890
Prohibits a particular type of market conduct, i.e., conspiring to limit competition
Outlaws a particular market structure, i.e., outlaws monopoly
Clayton Act of 1914: outlawed the following processes
price discrimination: charging buyers different prices when it was not justified by cost differences. This is business to business, not business to customer.
mergers: combinations of firms that substantially lessen competition or tend to create a monopoly
tying contracts: these prevent a buyer from using the products of a competing supplier (such as when Microsoft had to have you buy their web supporter with your computer).
interlocking directorates: these occur when the same person serves on the board of directors of competing firms (if this happens there might be collusion or forming of a cartel)
Can antitrust laws be used when there are natural monopolies?
NO! Because one firm can produce at a cheaper per unit cost than more than one firm.
What is Public utility regulation?
When the government controls the price and output of natural monopolies
How is price regulated?
Public utilities are allowed to charge a fair return price, which means that ATC = price or where ATC includes a normal profit
What are the problems with fair return price?
It tends to reduce the incentives for a public utility to innovate or contain costs (there’s no reward for becoming more efficient)
There’s no incentive or reward for this b/c the public utility makes the same profit regardless of its efforts
Describe the market failure of spillover costs
Spillover costs or cost externality: a cost imposed on people other than the producers and consumers of a good or service
Example of a spillover cost: pollution
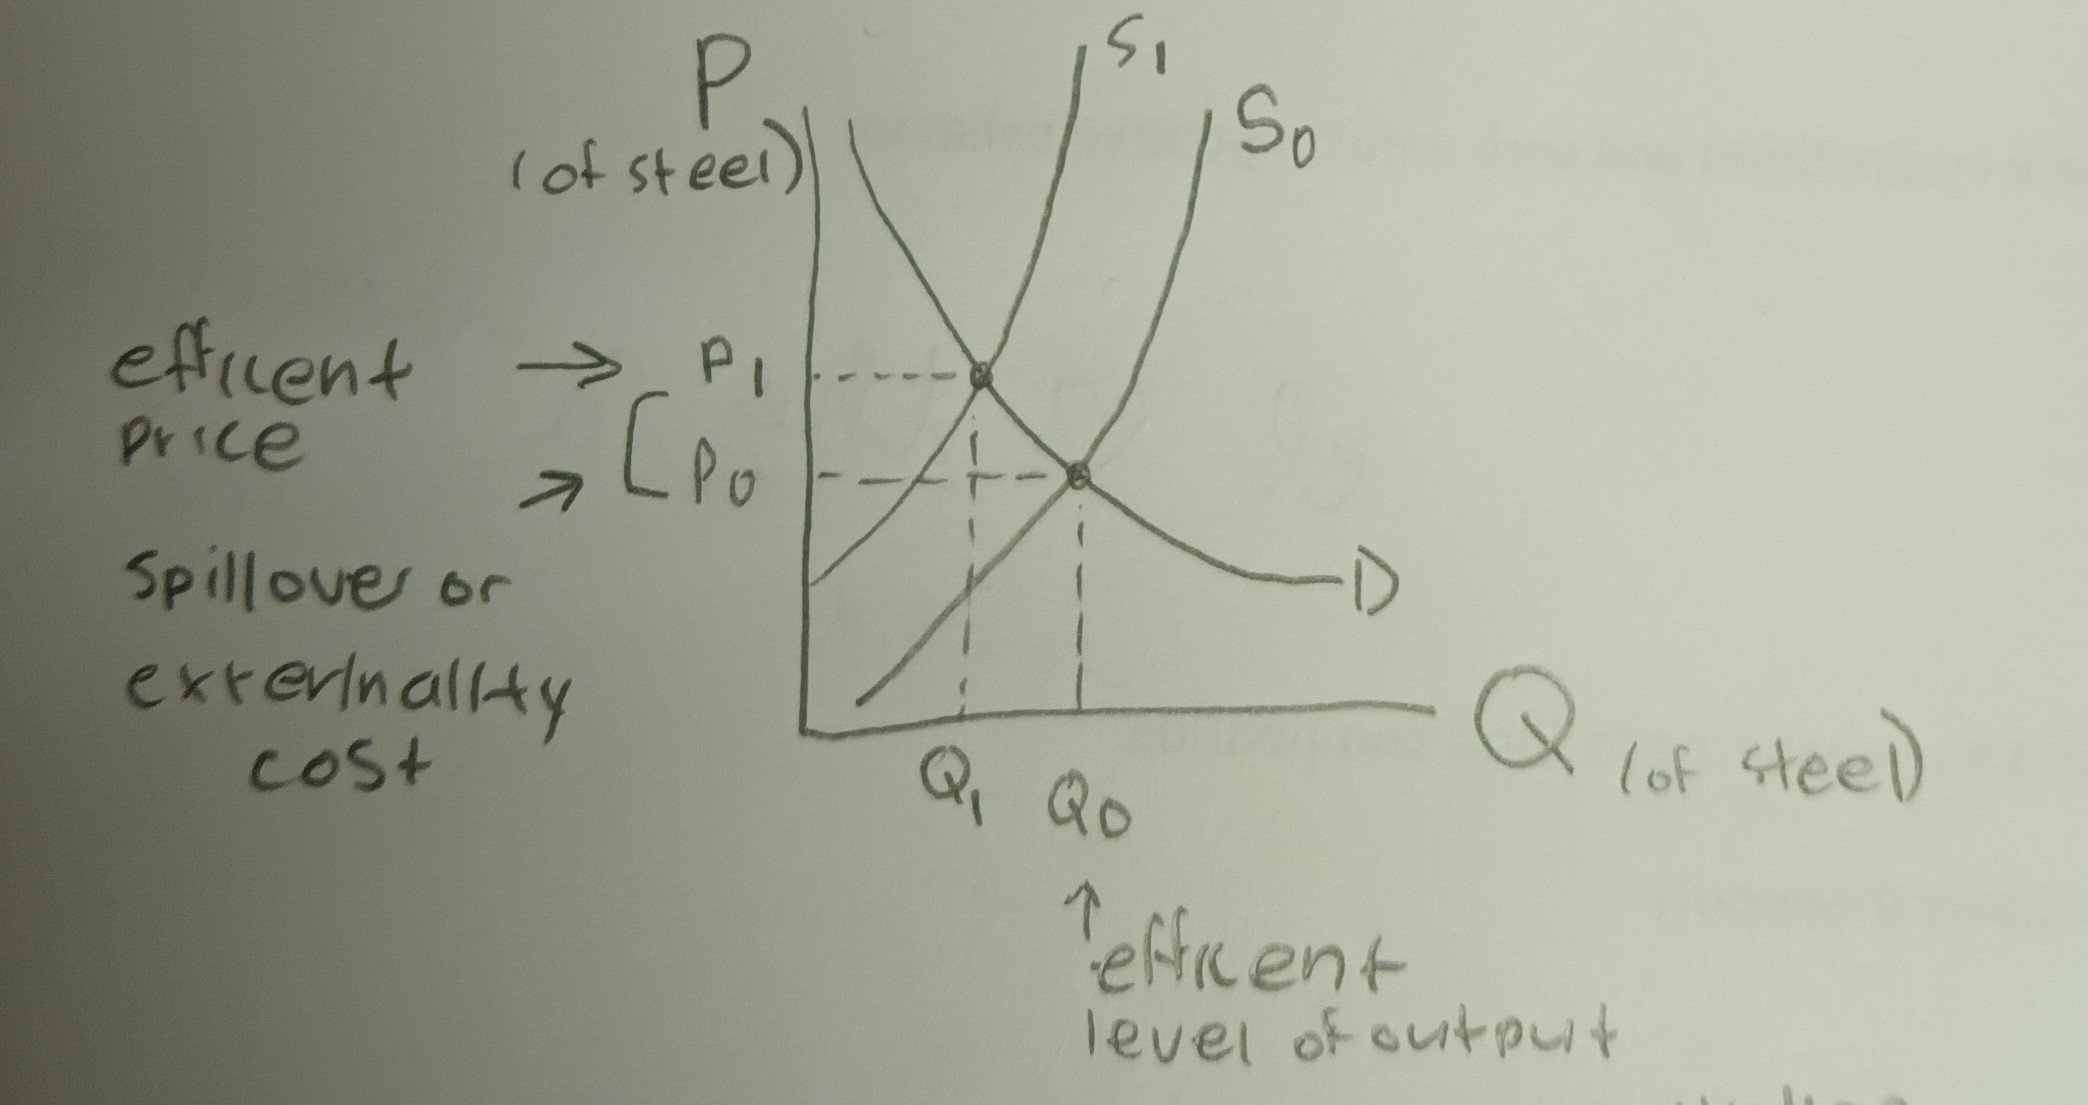
Describe the graph of spillover costs
D: Demand for the product
S0: Supply without the spillover costs
P0: Price without spillover costs
Q0: Output without spillover costs
S1: Supply with the spillover costs of pollution
P1: price with spillover costs
Q1: output with spillover costs
What is the amount of the spillover cost?
Spillover cost: P1 - P0
Without the spillover cost included there is too much pollution, the price is too low, there is overproduction, and there is an overallocation of resources
With the spillover costs included the firm produces the efficient amount of pollution, charges the efficient price and produces the efficient amount of output.
*Note: in general, the efficient amount of pollution is not 0 pollution b/c it is not economically efficient.
How can the government force firms to produce the efficient amount of output and so produce the efficient amount of pollution?
Command and control regulation: the government imposes restrictions on the amount of the polluting activity
Incentive based regulations: the government uses fees or taxes to induce firms to decrease the polluting activity.
*Note economists favor incentives b/c it allows the firms themselves to develop the most efficient way to reduce pollution; however, command and control regulation has been the most common approach to reducing pollution.
What are the 3 characteristics of private goods?
Divisible: it is possible to divide the good into units small enough to be purchased by individual consumers
Exclusion: this means that only those who purchase the good can consume the good
Rival consumption: consumption of the good by one person decreases the amount available for other consumers.
These 3 characteristics allow private goods to be efficiently produced by the market
What are the 3 characteristics of public goods?
Indivisible: it is not possible to divide the good into units small enough to be purchased by individual consumers
Non-exclusion: this means that those who do not purchase the good can still consume the good
Nonrival consumption: consumption of the good by one person does not decrease the amount of available for other consumers
These 3 characteristics lead to the free rider problem which leads to underproduction of public goods by the market
Examples of public goods: national defense, police protection, highways
Describe the market failure of Economic Inequality
The market system on its own usually leads to an unequal distribution of income with many having too little income
How does the government contribute to the income of the poor?
By giving the poor transfer payments: payments by the government to households for which no goods or services are rendered
Examples of transfer payments: social security, unemployment insurance, food stamps, earned income tax credit, welfare.