Public opinion on global warming
Most Americans think global warming is happening (70%)
A slight majority of Americans think global warming is 1º human-caused (58%)
Majority of Americans understand that most scientists think global warming is happening (58%)
Well over 95% of scientists agree global warming is happening
Intergovernmental Panel on Climate Change (IPCC)
Jointly established in 1988 the World Meteorological Organization (WMO) and United Nations Environment Programme (UNEP)
Goals:
To assess available scientific and socio-economic information on climate change and its impacts and on the options for mitigating climate change and adapting to it
To provide, on request, scientific/technical/socio-economic advice to the Conference of the Parties (COP) to the United Nations Framework Convention on Climate Change
Surface and tropospheric temperatures have increased globally over the past 2000 years
The warmest years on record in a 134+-year record have all occurred since 2000, with the last 8 (2014-2022) the hottest
2016 and 2020 were the warmest
“Hockey stick graph”- Rates of increases have themselves increased over the past 2000 years
stratosphere
10-50km above surface
includes where planes fly (at about 30km)
troposphere
first 10km above surface
just higher than Mt Everest (tallest mountain in world)
where we are, the air we breathe
Global temperature increases are widespread but not geographically uniform. Largest increases in ____
N. hemisphere (especially Arctic regions), Amazonia, and W. Africa.
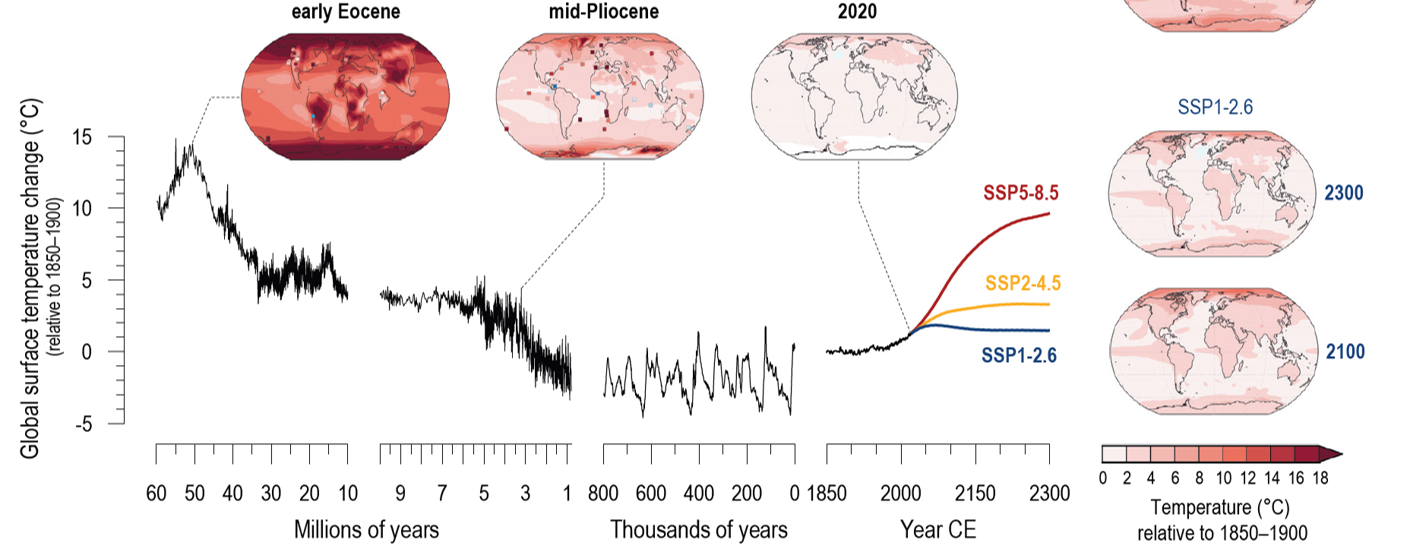
Early eocene to pilocene was relatively warm
Eocene-oligocene: time of mass extinction (when dinosaurs went extinct)
Temperatures have increased at a similar rate after industrial revolution
Ways water cycle has been affected by increasing temperatures
Tropospheric water vapor over oceans is increasing
Increase of intense tropical cyclone/hurricane activity in the North Atlantic since about 1970
Large precipitation events are a larger proportion of total precipitation on a global scale
Precipitation over land in many areas has increased or decreased significantly (changes have quickened in the last few decades)
More intense and longer droughts have been observed over wider areas, particularly in the tropics and subtropics since the 1970s (land use exacerbates this, ex. deforestation in the Amazon)
Floods have increased in intensity in many parts of the world
Changes in the cryosphere due to increasing temperatures
Sea ice is melting (arctic sea ice decreased significantly, antarctic ice increased slightly, but recently is decreasing quickly)
Ice shelves -w/ice over water and some over land- are breaking
Terrestrial glaciers have experienced huge reductions
Snow cover and permafrost in northern hemisphere are decreasing
Positive feedback
when a change has an effect that makes the original change even more marked. [here, for example, the melting of ice causes more energy absorption by water, causing more warming and more melting as a result, making it WORSE.
= tipping point
Tropospheric water vapor over oceans is increasing
The added water vapor increases the possibility of extreme storms developing over the ocean
Salinity changing (Atlantic is more saline than Pacific, salinity of Mediterranean is VERY high)
Sea ice is melting- result?
Arctic “sea ice minimum” has decreased (a POSITIVE feedback)
Doesn’t affect sea level, but changes surface from white ice to dark water, which affects reflection
Ice shelves are breaking- result?
an ice shelf is a large floating platform of ice that forms where a glacier or ice sheet flows to a coastline and onto the ocean surface
Bc ice forms over land, sea level RISES when ice shelves melt and water flows into the ocean
Terrestrial glaciers have experienced huge reductions- result?
Bc ice forms over land, sea level RISES when glaciers melt and water flows into ocean (ex. Greenland and Antarctia)
Many mountain glaciers are disappearing as well (ex. Alaska, Asia-many Himilayan glaciers will be gone by middle of this century, Africa-Kilimanjaro likely to be gone in next two decades, South America)
Snow cover and permafrost in northern hemisphere are decreasing- result?
The reduction in permafrost “activates” many microbes, which consequently can release large amounts of CO2 and methane, with large positive feedback effects.
Can turn an area from a carbon sink to a carbon emitter
A “tipping point”
Mean sea level has risen in conjunction with changes to ___
SST and loss of terrestrial glaciers
Rising at an increasing rate
Global average sea level rose .17m during 20th century
Melting of Greenland ice sheet alone could account for a ~20 foot rise considering additional increases w/thermal expansion.
Rising sea level leads to
Increased vulnerabilities during storms → susceptibility during hurricanes and windstorms
ex. East coast of USA and Asia/Australia have higher sea levels
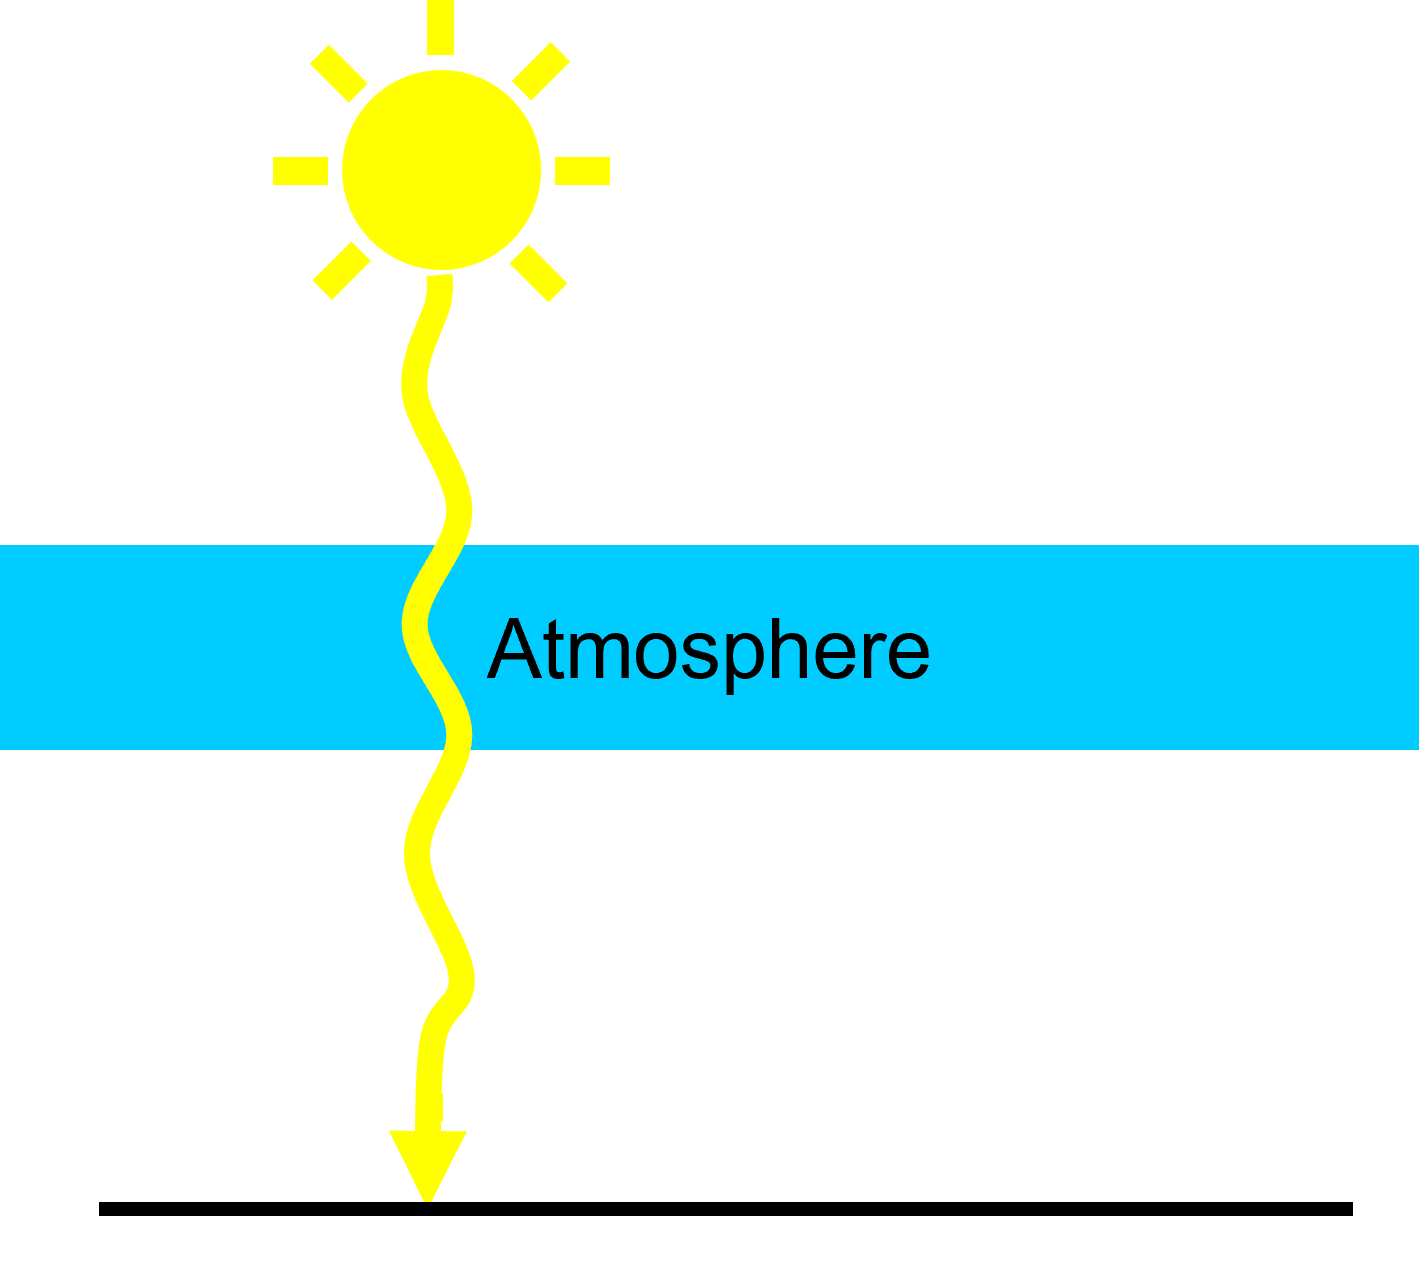
Global climate is dependent on changes in the degree to which radiation (solar most important) is “trapped”
Higher energy solar radiation gets through atmosphere, but loses energy and reflects off of earth as longer-wave/thermal radiation (lower energy) that gets trapped when it tries to go back through the atmosphere
Trapped radiation-→ heat
Electromagnetic spectrum
Shorter wavelength/higher frequency radiation has higher energy
Solar radiation includes near UV radiation, visible, and infrared
Infrared radiation (aka Thermal): what we feel as heat/warmth
Visible radiation: what we see as light (rainbow)
Ultraviolet radiation: we cant directly detect this, but can be hurt by it
Ultra=above, violet= highest radiation we can detect, so ultraviolet means highest frequency radiation
____ in atmosphere trap more radiation in troposphere
Greenhouse gases
CO2*, methane*, N20, water vapor emitted into atmosphere trap more radiation and lead to more warming of our troposphere
* key GHGs
Higher energy solar radiation gets through atmosphere, but loses energy and reflects as lower energy (longer-wave/thermal) radiation that gets trapped
Radiative forcing (RF)
measure of the net change in the energy balance of the Earth system in response to some input/perturbation. Measured as W (m-2)
Positive RFs vs Negative RFs
Positive RFs mean the change (e.g., accumulation of CO2) causes more radiation to be trapped by the atmosphere, warming the troposphere.
POSITIVE forcing
Negative RFs means more radiation reflected away so less is trapped and less warming (ex. high white fluffy clouds)
NEGATIVE forcing
Worldwide net radiative forcing has been ___
POSITIVE
(models incorporating anthropogenic + natural forcings show this pattern best)
Earth has warmed ___ since pre-industrial times (~160 years ago)
a little over 1 degree
Largest contributor to POSITIVE radiative forcing
CO2- most important contributor to both natural and anthropogenic radiative forcing
Anthropogenic sources of C02
CO2 is natural, but increases above normal atmospheric are due primarily to human activities
Combustion of fossil and biomass fuels (incl. forest fires)
Land use changes
Cement (from breakdown of limestone and E to produce).
Fossil fuel combustion is largest source
What removes CO2 from atmosphere?
Plants through photosynthesis, diffusion of CO2 into water (ex. oceans)
What puts CO2 into the atmosphere?
Animal, plant, and microbial respiration, human activities (burning fossil fuels)
How do human activities lead to imbalances in exchanges of carbon?
Fossil fuels, cement, and land use emit 9 GtC
Photosynthesis only removes 3 GtC, oceans (through acidification) only remove 2 GtC
Top producers of CO2 globally
China, US, and India
Emissions (consumption) in non-Annex 1 (i.e., “developing”) countries are generally increasing relatively faster (due to population and standard of living)
ex. China and India
Some Annex-1 countries (e.g., US, Germany, UK) have decreased their emissions, owing in part to adoption of renewable sources and better technologies
Among top producers of CO2, per capita leaders are ___
Canada, Saudi Arabia, and US
Oil producing countries generally have high per capita consumption (the highest in world is Qatar = 32.5 (but down from 45.4 in 2014!)
Other net POSITIVE radiative forcing contributors
Non-CO2 GHGs - methane most important, but also N20 (nitrous oxide), and other chemical pollutants
Halogenated gases1 (e.g., CFCs), nitrogen oxides (NOx), volatile organic compounds (VOC), and carbon monoxide (CO) combine for net positive forcing
Anthropogenic sources of methane
landfills, oil and natural gas systems, agriculture, coal mining, stationary and mobile combustion, wastewater treatment, and some industrial processes
Sources of nitrous oxide
62% natural, with rest due to anthropogenic activities (agriculture/fertilizers, burning fossil and biomass fuels, sewage)
Other chemical pollutants
Halogenated gases1 (e.g., CFCs), nitrogen oxides (NOx), volatile organic compounds (VOC), and carbon monoxide (CO)
Sources of other chemical pollutants
Primarily anthropogenic incl. refrigerants (CFCs), exhaust from combustion of fossil and biomass fuels (including forest fires), other pollution from industry
Tropospheric ozone leads to ___ forcing
POSITIVE
Several pollutants (methane, NOx, VOCs, and carbon monoxide) contribute to tropospheric ozone (”smog”), exacerbating warming
Occurs because UV radiation scattered and trapped in troposphere
Causes heath problems like asthma
Tropospheric/ground-level ozone is the BAD OZONE!
Stratospheric ozone has a ___ forcing
NEGATIVE
Crucial for blocking UV radiation and thus is protective
Stratospheric ozone is the GOOD OZONE!
Some UV radiation is reflected by ozone in stratosphere. Also protects us from some harmful UV
Sources of stratospheric ozone
Formed naturally by chemical reactions involving solar (UV) radiation and oxygen
BUT stratospheric ozone is ___
Endangered
Destruction of stratospheric ozone is a concern (‘the ozone hole”)
Chemicals/gases from both industry (e.g. halocarbons such as CFCs) and natural events (e.g., volcanoes) can find their way to the stratosphere and destroy stratospheric ozone
Aerosols and clouds typically increase ___ forcing
NEGATIVE
light colored clouds, chemicals, and dust will increase reflectance “albedo”- level of reflection
white surfaces have higher albedo, dark surfaces have lower albedo (which means they absorb more)
Land use changes and surfaces can influence albedo, leading to ___ forcing
POSITIVE OR NEGATIVE
Darker surfaces (soil, water, forests, croplands) have lower albedo and thus more positive radiative forcing (warming)
Other surfaces (dry sand, ice, fresh snow) have higher albedo and can have a lower or even negative radiative forcing (cooling)
The net effect of all radiative forcings above is a temperature ___
INCREASE of a little over 1 degree C in 2010-19 relative to 1850-1900.
1.1
Expressed as net radiative forcing, this is a net POSITIVE radiative forcing which represents an increase of 2.72(+) W m-2 in 2021 relative to pre-industrial times.
Increasing concentrations of GHGs (e.g., CO2) from current levels are predicted to lead to ____ in temperature.
INCREASES
Direct relationship between CO2 (GHGs in general) and temperature anomalies
Labels of SSP storylines
ex. SSP2- 4.5
First number references the storyline
Second number is RF (the lower the better)
Indicates how much forcing in 2100 increased relative to pre industrial times
5 families of IPCCs Shared Socioeconomic Pathways (SSPs)
SSP1- Sustainability / Green Road
SSP2-Middle of the Road
SSP3-Regional Rivalry / Rocky Road
SSP4-Inequality / Road Divided
SSP5-Fossil-fueled Development
if we want to control forcing with SSP models,
we need to be low on challenges for mitigation and adaptation
SSP1-Sustainability / Green Road
(Low challenges to mitigation and adaptation = best case scenario) most optimistic of all for human development; increasing shift toward sustainable practices; some projections lead to decreased RF
Common storylines: SSP1- 1.9 and 2.6
We are currently at 2.72 so these are a decrease
SSP2-Middle of the Road
(Medium challenges to mitigation and adaptation) historical patterns of uneven development among countries continues through the 21st century; projections here assume progress is good, so relatively low RF
Common storyline: SSP2-4.5
SSP3-Regional Rivalry / Rocky Road
(High challenges to mitigation and adaptation) worst case = most pessimistic of all; nationalistic approaches with countries going on their own and with few investments to counter environmental degradation
Common storyline: SSP3-7.0
SSP4-Inequality / Road Divided
(Low challenges to mitigation, high challenges to adaptation) high disparities among and within countries, with only some possessing the technological capability to confront problems
SSP5-Fossil-fueled Development
(High challenges to mitigation, low challenges to adaptation) relatively optimistic trends for human development but driven by an energy-intensive, fossil fuel-based economy
Common storyline: SSP5-8.5
If we continue without action, which pathway will we be on?
RFs have increased from 2.3 W m-2 to between 2.72 W m-2 or 3 W m-2 over the past ~8 years.
At this rate, RFs will be between ~6.8 -9.8 in 2100!!
We will reach +3.8 C to more than +5 C in global temperature increase relative to pre industrial times (compared to current 1 degree!!!)
SSP-RF models project pathways with higher increases in temperature have ___ changes in precipitation + soil moisture
LARGER
The extremes get more extreme (both dry and wet areas)
How does the extent of cryosphere decrease in all projections
Sea ice will be practically gone by 2100
Snow cover and permafrost projected to decrease by between 37% to 81%
If we heat up what was once frozen that contains microbes, what happens to its metabolic rate?
Metabolic rate will increase→ produce more CO2
Leads to positive feedback
Impacts of climate change on human health:
Disease burden- Respiratory and Infectious Diseases
Changes to Hydrological Cycle- Quantity and Quality of Water
Environmental Disruption– Species Distribution, Food Security \n (includes disruption of ecosystem services)
Health Effects of Temperature and Extreme Weather
Forced Migration, Conflict and Refugees
Disease burden- respiratory health
Air pollution and increasing allergens associated with increased use of fossil fuels (including tropospheric ozone) have led to increased respiratory problems
Respiratory problems exacerbated by air pollution (including pneumonia and asthma) are the largest reasons for childhood hospitalizations
Adaptation
The process of adjustment to actual or expected climate and its effects. In human systems, adaptation seeks to moderate or avoid harm or exploit beneficial opportunities. In some natural systems, human intervention may facilitate adjustment to expected climate and its effects.
Mitigation (of climate change)
A human intervention to reduce the sources or enhance the sinks of greenhouse gases (GHGs). This report also assesses human interventions to reduce the sources of other substances which may contribute directly or indirectly to limiting climate change, including, for example, the reduction of particulate matter emissions that can directly alter the radiation balance (e.g., black carbon) or measures that control emissions of carbon monoxide, nitrogen oxides, Volatile Organic Compounds and other pollutants that can alter the concentration of tropospheric ozone which has an indirect effect on the climate.
Resilience
The capacity of social, economic and environmental systems to cope with a hazardous event or trend or disturbance, responding or reorganizing in ways that maintain their essential function, identity and structure, while also maintaining the capacity for adaptation, learning and transformation.
Disease burden- infectious diseases
Climate change – and land use changes and globalization – are increasing risk for infectious diseases
In part due to distribution of vectors – agents that spread disease from host to host
Climate change affects the abundance, success, and/or distribution of vectors like ___
Anopheles- Malaria
Aedes- Dengue, Zika, & others
Eastern Blacklegged (Deer) Tick- Lyme disease
Precipitation and temperature key factors
The capacity of the local medical system also impacts the severity of diseases; in some countries, low capacities are especially worrisome
Malaria increasing in highland areas of ___ HDI countries
Low and Medium
HDI – Human Development Index \n A composite index of life expectancy, education (mean years of schooling), and per capita income (gross national income) indicators.
Development of Aedes
Reproductive potential of Aedes vectors for dengue \n increasing globally
The primary vectors of Zika (e.g., Aedes aegypti) are already present in the US and future outbreaks are expected (cases have appeared in the US)
Development of Eastern Blacklegged (Deer) Tick
Lyme disease in eastern US is rising and projected to get worse w/climate change due to expansion of tick habitat and changed dynamics of animal hosts and the disease-causing bacterium
Climate change is also affecting distribution and disease load of other diseases as well, like ___
Cholera
Caused by a bacterium (Vibrio) – proliferates in warm rivers and coastal waters and is on the rise globally owing to warming water temperatures and flooding
Increasingly high % suitable coastline in essentially all countries
Changes to water quality and quantity
Already hydrological cycles have been affected in many regions, affecting quantity and quality of water resources. Both increases and decreases (desertification) observed
Precipitation over land has already changed, with variation both spatially and temporally (more marked changes recently)
Projected to continue to change, w/larger extremes at high warming/RFs
Has potential to destabilize water supplies and agriculture
impact of fires- how many acres burned?
Dry hot conditions (and extreme heat) increase risk of fire with consequent destruction of property, increased costs, negative \n health effects, and loss of life
ex. ~46 million acres burned, thousands of structures, and several lives lost in Australia in the 2019-2020 season alone
billions of animal lives lost in the 2019-2020 season alone
The global land area affected by exceptional and extreme drought is increasing significantly, which has severe implications for ___
people dependent on the water
people and businesses dependent on hydropower
shipping and manufacturing and thus supply chains (e.g., on the Mississippi and in China)
Marine phytoplankton are being adversely affected by ___
changes to water quality and quantity
Recall phytoplankton are the primary producers in marine ecosystems, and produce ~50% of the O2 on earth
“Climate change is shifting not only the intensity of phytoplankton blooms, but their composition. Harmful algal blooms (also known as red tides) are expected to increase as the oceans warm. ... This disperses the free-floating phytoplankton deeper into the water column, limiting their access to sunlight.”
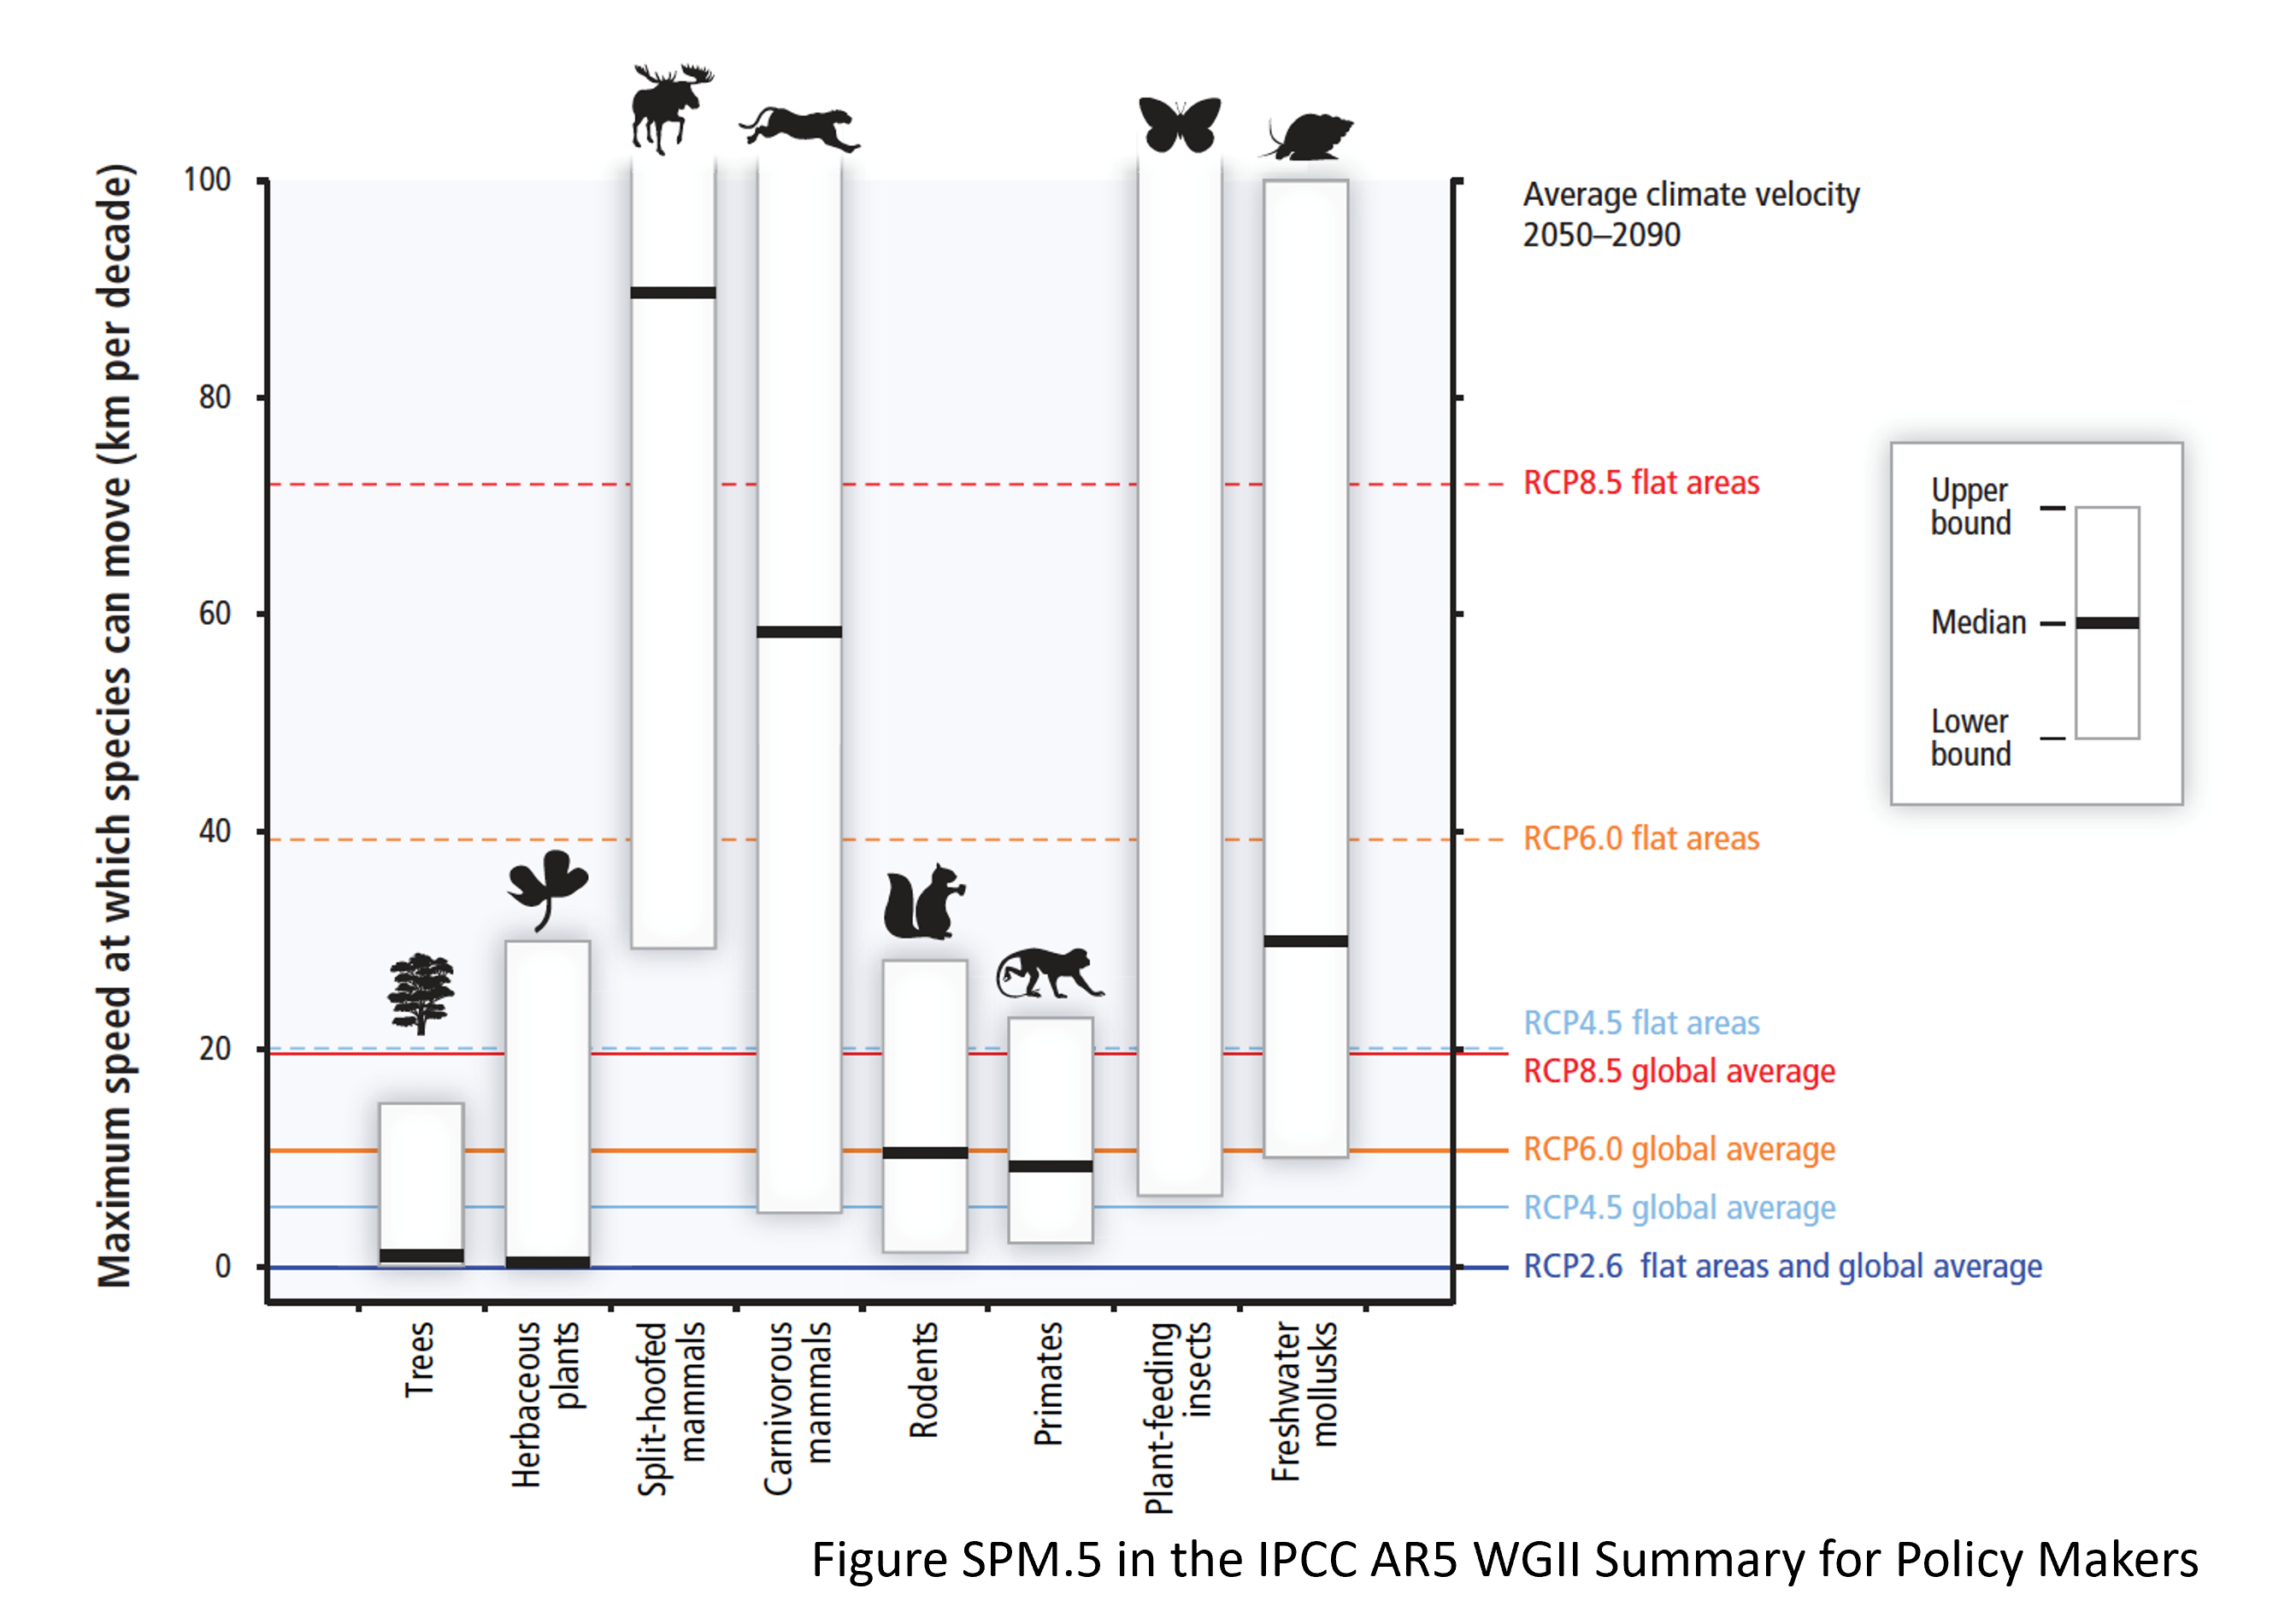
Environmental Disruption– Species Distribution and Food Security
Plant and animal species show different capabilities to move in response to changing climate. Vulnerabilities (not achieving required relocation) increase with higher RF projections
Terrestrial species (ex. trees have lower capability than pumas, ones below target line will not survive)
Many marine species have already shifted their geographic ranges, seasonal activities, migration patterns, abundances, and species interactions in response to ongoing climate change
Effects of environmental disruption impact commercial supplies/viability and thus food security. Example is:
Recent collapse of snow crabs (and lucrative market) in Bering Sea
Scientists warn that the warm conditions that led to this first-ever harvest cancelation are likely to be more common in the future.
Impacts of changes in catch potential of marine species
Some commercial fishing fleets already have longer travel times
Predators of these species (e.g., sharks!) follow!
Sharks now prevalent off coasts of NY/NJ
Consider reliance of some populations (e.g., Indonesia) on fish as food/protein source even though they have lower catch potential
As climate change causes open ocean dead zones to balloon, ____
Fish habitat deflates.
Further warming of surface waters along with expanding dead zones from deeper into shallower water can reduce habitat for marine fish and plankton (warming decreases dissolved oxygen levels)
Also occurs in freshwater fish (ex. trout in danger)
Increasing ocean acidification negatively affects marine invertebrates with shells (including some with commercial value like ___)
Clams, oysters, shrimp, crabs, lobsters
As you increase acidity, the number of these affected goes up)
“Shells on acid”
Acid dissolves the calcium carbonate in shells and corals
Shells of some plankton now 76% thinner than in 19th century
Both increasing ocean acidification and temperature are causing massive and widespread ____ of corals
Bleaching
“bleaching” is when colorful photosynthetic algae (zooxanthellae) are driven out, upsetting the mutual symbiosis between the algae and coral animals
ex. Australia’s great barrier reef
Especially rapid decline attributed primarily to rising temperatures and acidification Zooxanthellae algae driven out, causing eventual death of coral animals unless reversed
Current issue: the bleaching occurred in the year 2016 and 2017 affected a stretch of 1500 kilometers (900 miles) of the coral reef and now the scale of mortality is such that there is nothing left for the coral reef to replenish
With some exceptions, studies covering a wide range of regions and crops suggest negative impacts of climate change on ___ are more common than positive impacts
crop yields
Decrease in global crop growth duration (growing season) for a variety of important food crops
Maize, winter wheat, spring wheat, soybean, rice
Economic effect of increased temperatures
Economies in all HDI countries are already suffering from the increase in temperature (e.g., reduced work productivity; billion hours lost)
Health effects of increased temperatures
Impact on outdoor activities (losing safe average hours of physical activity)
High mortality from extreme heat, even in the US and other developed (high/very high HDI) countries
Health effects of extreme weather
Hurricanes are becoming more destructive – and in some years more numerous – w/increasing SST, water vapor, +“ocean energy”
Slow-moving large storms becoming more common – INCREASES FLOODING (e.g., Ian in 2022)
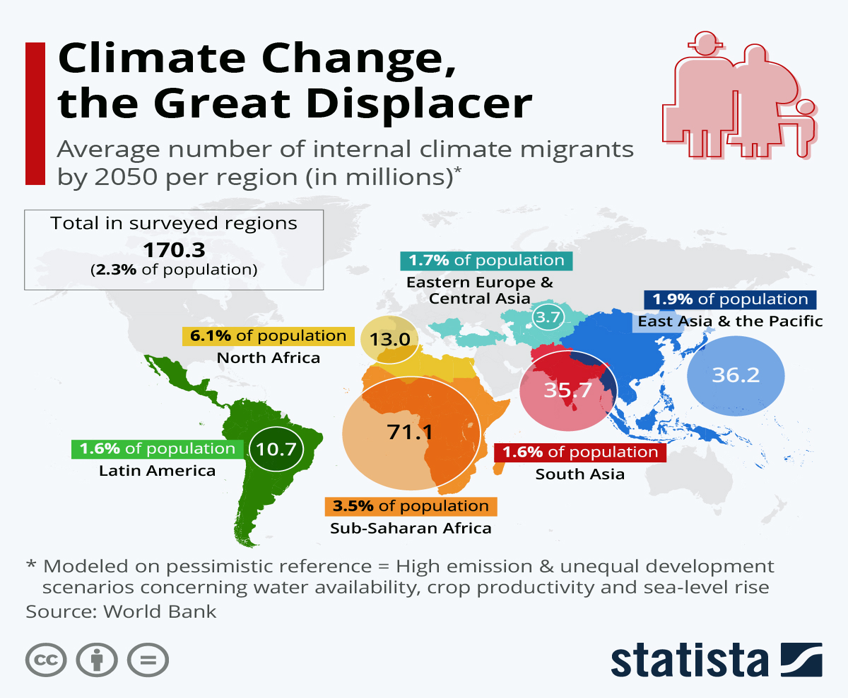
Sociopolitical implications of climate change
We are already seeing environmental refugees and projected increases are staggering
ex. report predicts 140 mil refugees by 2050 unless action is taken
What is the biggest pool/fate of carbon dioxide?
The ocean
lots of water, great place for CO2 to be absorbed
but there is an environmental cost: when water reacts with CO2, acid is formed
what are the key ways we use fossil fuels
transportation, electrical generation, and industry
To avoid large and deleterious impacts, we ___
MUST REDUCE EMISSIONS AND REDUCE ACCUMULATIONS of greenhouse gases and adapt and build resilience to changes that will happen
efficient hybrid +electric cars
Taming emissions – technologies
Technology for fuel efficiency/lower emissions exists and is already deployed worldwide, we just need to set the emission standards (CAFE)
CAFE –__Corporate __Average __Fuel __Economy
“smart growth”
Taming emissions – technologies
Designing our cities to be transit-oriented to promote public transportation and walking/biking, and to be mixed-use and compact
Decreases emissions/vehicle-miles driven (and traffic jams + stress)
with co benefits: Improves health, affect, and exercise, Increases tax base and quality of life
renewable energy for electricity
Taming emissions – technologies
Fossil fuels predominate now, but some good news…
Coal decreasing
Renewables low but increasing
China has surpassed the US in low-C energy production
[also Natural gas increasing Nuclear ~constant]
Wind and solar sectors seeing growth especially (with large increases predicted)
types of solutions to reduce emissions
technology, ecological, policy
To keep close to the +1·5°C goal for temperature increase, generation from new renewable sources (solar, wind, geothermal, wave and tidal) needs to increase by ___ per year so that generation in 2050 is larger than total global electricity use today.
9·7%
“carbon capture” (“scrubbing”)
Taming emissions – technologies
This technique removes CO2 from smokestacks BEFORE it is released
incorporates a scuba-like technology that uses chemicals to bind (“capture”) CO2 and remove it before it is released
improving energy efficiency- commercial and residential
Taming emissions – technologies
ex. in homes- solar panels, low flow water fixtures, double insulation
“carbon capture & storage”
Reducing accumulation– technologies
captures CO2 and injects it underground, where it is trapped and is stabilized after binding to brine and minerals
Best case storylines in IPCC rely heavily on carbon capture and storage strategies working to manage atmospheric [CO2].
maintain ecosystem services
Reducing accumulations– ecological
e.g., maintain good functional forests and healthy populations of phytoplankton
these remove CO2 (and produce O2) through photosynthesis and also lower other GHG
Warmer temperatures and higher CO2 levels increase rates of photosynthesis → planting trees is a carbon offset
maintain ecosystems that store carbon naturally
Several terrestrial ecosystems can store a lot of carbon belowground serve as important carbon sinks = “carbon sequestration” (peatlands)
Proper functioning water and nutrient cycles help regulate important greenhouse gases (esp. CO2, N2O, and water)
impact of maintaining ecosystems
Healthy ecosystems and soil (incl. microbes)– when functioning properly – will reduce accumulations
diet choices/ eating less meat
Taming emissions – ecological
would reduce emissions from agriculture as livestock require a lot of resources and produce methane (up to ~7.1 Gt CO2 eq/year)
50% of habitable land is agriculture
Meat production very space- and resource-intensive!
77% of agricultural land used for livestock/dairy, YET provides only ~18% of global calories and 37% protein
Also…takes about 1800 gallons of water/lb beef, and ~576 gallons/lb pork
Total consumption of meat (million metric tons) increasing in many regions and globally
INCREASING World-wide – esp. China, Asia, Central & Soth America, and Africa
US has highest consumption \n on a per capita basis
DIRECT SUBSIDIES
direct subsidies to business, tax benefits/breaks, \n coverage of R&D costs/demonstration projects through the \n Department of Energy
INDIRECT SUBSIDIES
covering infrastructure, military, and supporting the technology in general and covering any effects
the carrot (e.g., subsidies) or \n stick (e.g., taxes, lawsuits)…
Taming emissions – Policy/Regulatory solutions