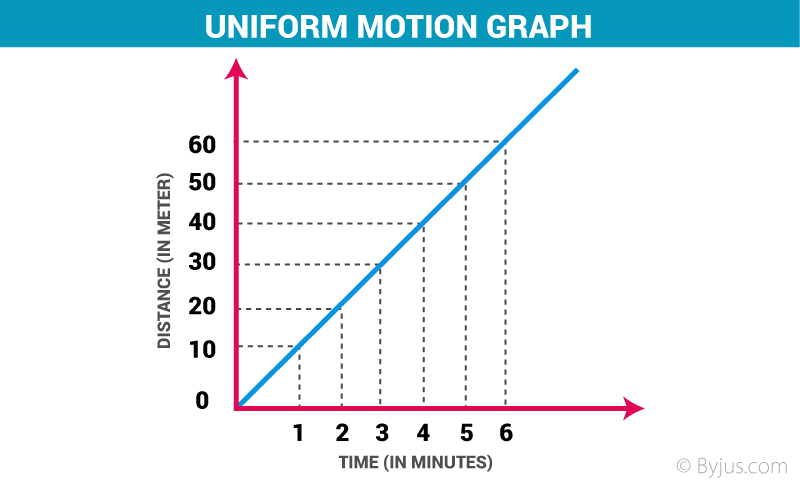
Distance-time graphs
Graphs which show how the distance (y-axis) of an object varies over time (x-axis).
Slope of distance-time graphs
Slope of distance time graphs = 𝚫y/𝚫x = 𝚫 distance/𝚫 time = speed of object
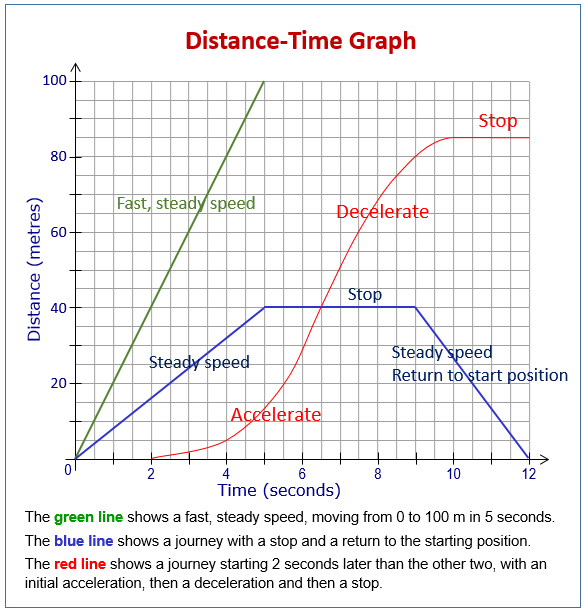
Straight, linear slope (gradient) for distance-time graphs
Straight, linear slope (gradient) → constant speed
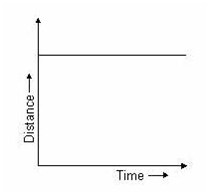
Horizontal slope (gradient) for distance-time graphs
Horizontal slope (gradient) → 𝚫y/𝚫x = 0/𝚫x = 0/𝚫 time = 0 → stationary (not moving) object
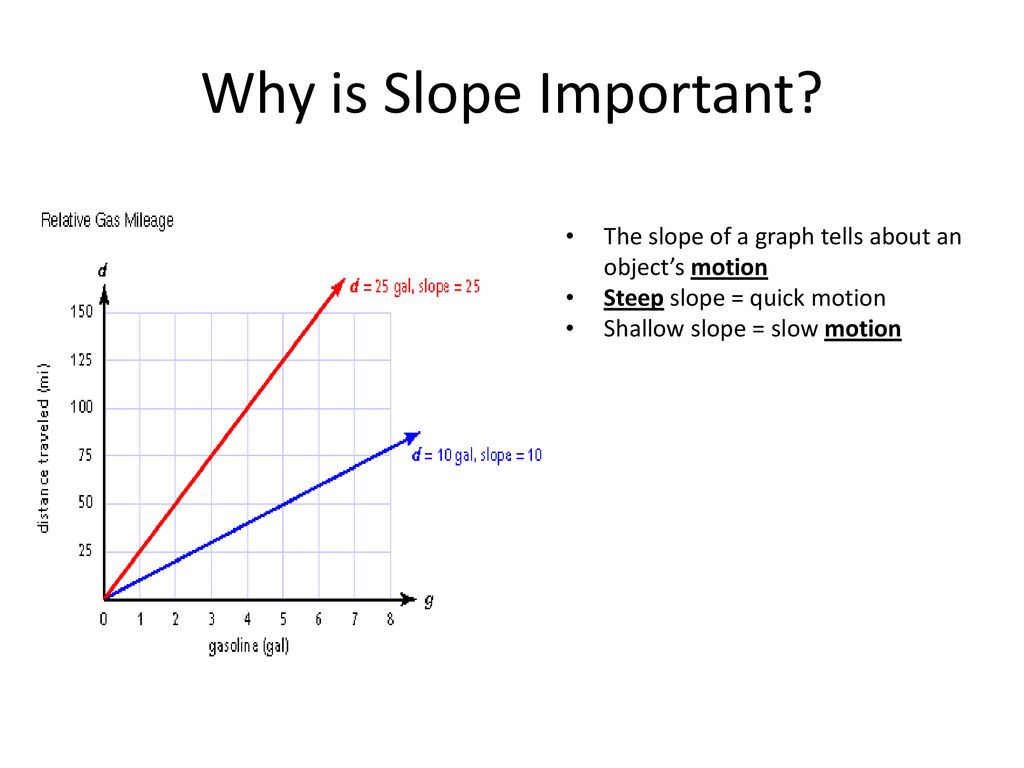
Steep slope (gradient) for distance-time graphs
Steep slope (gradient) → ↑ 𝚫y over 𝚫x → ↑ 𝚫 distance over 𝚫 time → ↑ speed
Shallow (gentle) slope (gradient) for distance-time graphs
Shallow slope (gradient) → ↓ 𝚫y over 𝚫x → ↓ 𝚫 distance over 𝚫 time → ↓ speed
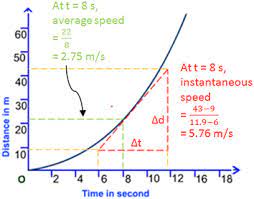
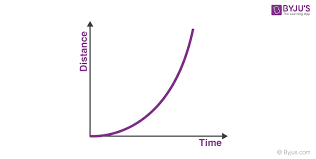
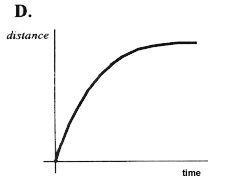
Curved line in distance-time graph
Curved line → changing velocity or speed
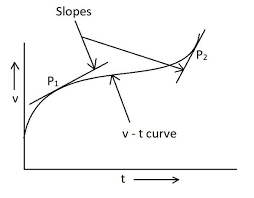
How do you find the instantaneous speed at a point on a distance-time graph?
If the point of instantaneous speed is on a linear segment of the graph, then the speed is simply the gradient of that linear segment. If the point of instantaneous speed is on a non-linear/curved section of the graph, then draw a line tangent to that point on the curve, then find the tangent’s gradient. Tangent’s gradient = Object’s speed at that instantaneous moment in time. This method also works for finding instantaneous acceleration in velocity-time graphs.
Gradient becomes steeper in curved line on distance-time graph
Gradient becomes steeper → acceleration
Gradient becomes shallower in curved line on distance-time graph
Gradient becomes shallower → deceleration
Distance = 0 on distance-time graph
Distance = 0 → Back at starting point
Negative slope (gradient) on distance time graph
Negative slope → Distance between object and starting point is decreasing → Object is traveling in opposite direction and is going back to the starting point (e.g. if object was previously traveling west, then a negative slope indicates that it is now traveling east)
Average speed definition
Total distance travelled by an object in a particular time interval. It’s a scalar quantity (because it only has magnitude and no direction).
If an object’s average speed or average velocity changes over time, what does this indicate?
Indicates acceleration has occurred.
Average speed formula
Average speed = Distance travelled / Time taken
Distance travelled formula
Distance travelled = Average speed x Time taken
Time taken formula
Time taken = Distance travelled / Average speed
Distance
How much ground an object has covered or travelled across during its motion. It’s the length of the space between 2 points (for physics, these 2 points would be the starting and ending point of the object). Distance is a scalar quantity, it has no regards to direction.
Displacement
Distance travelled in a particular direction from a specified point. Displacement is a vector quantity.
Distance VS displacement
Distance is scalar, displacement is vector.
Average velocity formula
Average velocity = Change in displacement / time taken
Average speed VS Average velocity
Average speed is scalar, average velocity is vector
Fiducial mark
Point of reference, where the same point is used when measuring.
What methods can you use to investigate the speed of an object?
Use trolley/ramp:
Heavy trolley/object used → put buffer material at end of runway (point B).
Heavy wooden ramp used → use at low level near floor rather than on benches or tables where it can fall off.
Measure AB’s length (distance trolley travels).
Use stopwatch to measure trolley’s time taken to travel across AB; human reaction time → error.
Calculate average speed using formula.
Always measure point A → constant distance AB
Change h to see height of ramp’s effect on trolley’s average speed.
Ignore anomalous results when calculating averages.
Use stroboscope in dark room to light up object at regular, known intervals (found from stroboscope’s frequency setting) with the camera adjusted so the shutter is open for the duration of the movement.
Use video camera to find distance object travelled between each frame - frame rate allows you to calculate time between each image/frame.
Use light gates. Using electronic timing devices has an advantage of removing timing errors produced from/by human reaction time.
Stroboscope
Apparatus that produces short bright flashes of light at regular intervals (at a known frequency of flashes per second); the apparatus allows the frequency to be varied. Stroboscopes are used to allow a series of images of a moving object to be captured photographically or to determine the speed of rotating objects.
Light gate
Apparatus used to measure speed. It has 2 pairs of infrared transmitters and receivers that will detect an object passing through. Average speed can be calculated as (known distance between 2 pairs of sensors) / (time taken to pass through light gate). Acceleration can also be calculated by measuring the average speed, as well as the time taken to go from resting state to traveling at the average speed (or measure differences in velocity using 2 light gates, then divide this difference by the time to get acceleration or deceleration).
Acceleration definition
Change in velocity (m/s) per unit time (s) → units of ㎨.
Acceleration formula
Acceleration = Change in velocity / time taken
a = (v-u)/t
Deceleration definition
Reduction in average velocity/speed or increase in velocity/speed in the opposite direction (hence the - sign).
Velocity time graphs
Graphs which show how the velocity (y-axis) of an object varies over time (x-axis).
Slope of velocity-time graphs
Slope = 𝚫y/𝚫x = 𝚫 velocity / 𝚫 time = acceleration of object
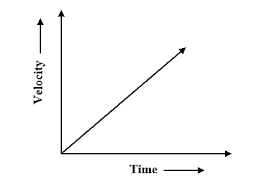
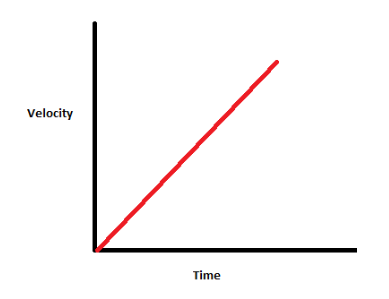
Straight, linear slope (gradient) for velocity-time graphs
Straight, linear slope (gradient) → constant acceleration
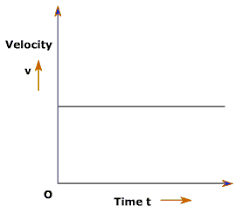
Horizontal slope (gradient) for velocity-time graphs
Horizontal slope (gradient) → 𝚫y/𝚫x = 0/𝚫 time = 0 → No 𝚫velocity → no acceleration or deceleration → constant speed
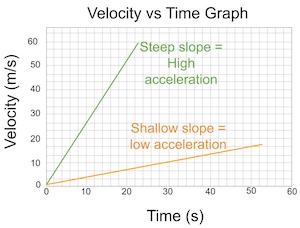
Steep slope (gradient) for velocity-time graphs
Steep slope (gradient) → ↑ 𝚫y over 𝚫x → ↑ 𝚫 velocity over 𝚫 time → ↑ acceleration
Shallow (gentle) slope (gradient) for velocity-time graphs
Shallow slope (gradient) → ↓ 𝚫y over 𝚫x → ↓ 𝚫 velocity over 𝚫 time → ↓ acceleration
Curved line in velocity-time graph
Curved line → changing acceleration or deceleration
Positive gradient in velocity-time graph
Positive gradient → acceleration
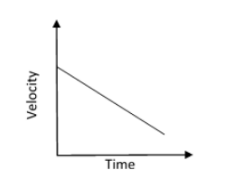
Negative gradient in velocity-time graph
Negative gradient → negative acceleration → deceleration
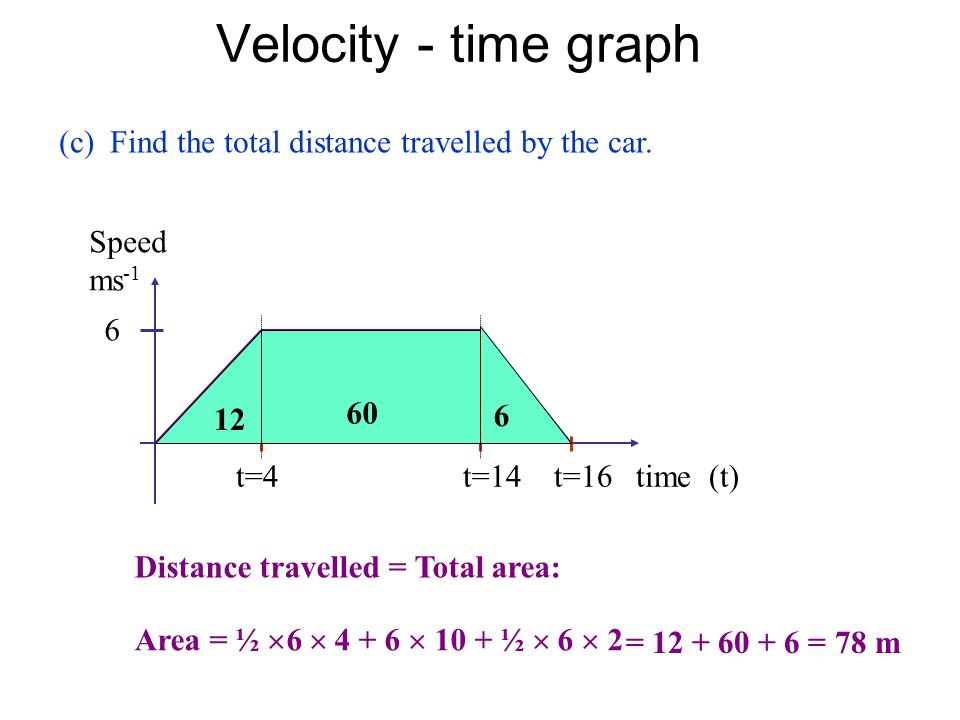
Area between point or curve in velocity-time graph and time axis
Area between point or curve in velocity-time graph and time axis = velocity x time = distance travelled
Uniform acceleration
When an object’s velocity changes at a constant rate.
When can the velocity squared equation be used?
Can be used to calculate uniform (constant) acceleration of an object when time taken is unknown.
Equation of motion (involves velocity squared)
(final speed)^2 = (initial speed)^2 + (2 x acceleration x distance moved)
v^2 = u^2 + 2as
How can directions be depicted for vector quantities?
+ for up/right.
- for down/left.
OR + for specified direction and - for opposite direction.
OR free body diagrams with arrows to show forces acting on object and the object’s direction of motion.