


Ch 15 - Monetary Thoery
(Macroeconomics)
The Equation of Exchange
The equation of exchange conveys how a change in the money supply affects macroeconomy
Formula: M × V = P × Y
Where M is the money supply
P is the price level
Y is the quantity of output of real GDP
Price level P can be measured with the GDP Deflator
M, Money supply can be defined as M1 or M2, where the velocity of money is the number of times the typical dollar of M1 or M2 is used to make purchases during a year.
Formula: M × V = Nominal GDP
Since P × Y = Nominal GDP, the equation of exchange is sometimes written in the above format.
For an economy like the US, the money supply times the velocity of money must equal the average price of all that is produced times the amount of output.
Suppose we now the money supply (M2) and p×y (nominal GDP), then we can solve for V:
M × V = P × Y
Suppose that the velocity of money and real GDP are constant, If the money supply increases by any amount, then prices would increase accordingly
↑M × V = ↑P × Y
NOTE: Velocity (V) and the quantity of output of real GDP (Y) are both constant in this case. In real life, neither real GDP nor velocity are constant, however, the changes between them are relatively small.
Money supply (M) and Price level (P) are both increasing proportionally
Velocity of Money: the number of times a typical unit of money is used for purchases in a year
The Quantity Theory of Money: the idea that inflation is almost proportional to the growth rate of the money supply
Hyperinflation: is typically known as the very high and accelerating inflation. This is harmful to consumers as they have very little purchasing power left. They will opt to use another more stable currency instead. This is usually the result of a political or economic upheaval
Classical Dichotomy: theory that states a change in the money supply will affect nominal variables in the economy but not real variables.
The Theory of Monetary Neutrality (aka the classic dichotomy)
The theory of monetary neutrality states that a change in the money supply will affect nominal variables in the economy but not real variables. This idea is based on the equation of exchange and the assumptions that V and Y are relatively stable
An increase in the money supply increases prices almost proportionally. Nominal variables are expressed in dollar amounts while ral variables are expressed in physical amounts. For example, the number of unemployed people in the economy is a real variable while the amount of M1 in the economy is a nominal figure.
A Nominal Figure: is an unadjusted rate or price, without taking inflation or other factors into account
Nominal Interest Rate: the interest rate as states and not adjusted for inflation
Most economists think that an increase in money supply will increase production and therefore employment (real variables) in the short run.
The Loanable Funds Market
Savings are essential for the macroeconomy to function properly. Businesses & the Government often take loans, however, that would not be possible without savings, as they must pay interest as well.
Financial Intermediation: is the task of getting funds from savers (lenders) to spenders (borrowers).
Financial Intermediary: any firm or institution that participates in financial intermediation
Savings and loans, banks, credit unions, mutual funds, hedge funds, investment banks, and other institutions act as financial intermediaries.
These institutions absorb savings and move the funds to borrowers willing to pay interest in order to obtain the loan of funds
Markets can help move the funds from savers to borrowers willing to pay the most interest. The rate of interest on a loan is determined by supply and demand. The greater the supply of funds are available on a specific good, the lower the interest rate. However, if the demand for a good increases, the interest rate will increase as well.
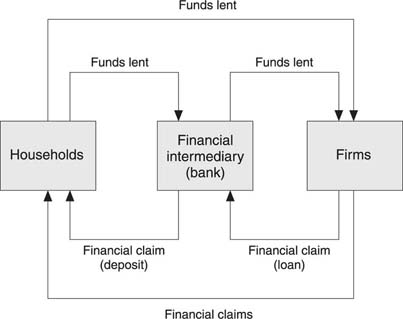
Businesses and households provide loanable funds in the form of deposits or savings held in a bank. The federal government is the demander in this case. They borrow money provided by households and businesses and often repay them with interest. The government also has a claim on the treasury bonds purchased by firms using their profits.
The market for loanable funds considers the supply and demand for all types of loans. The interest rate represents the cost or price of obtaining a typical loan.
Nominal Interest rate = Real interest rate + inflation
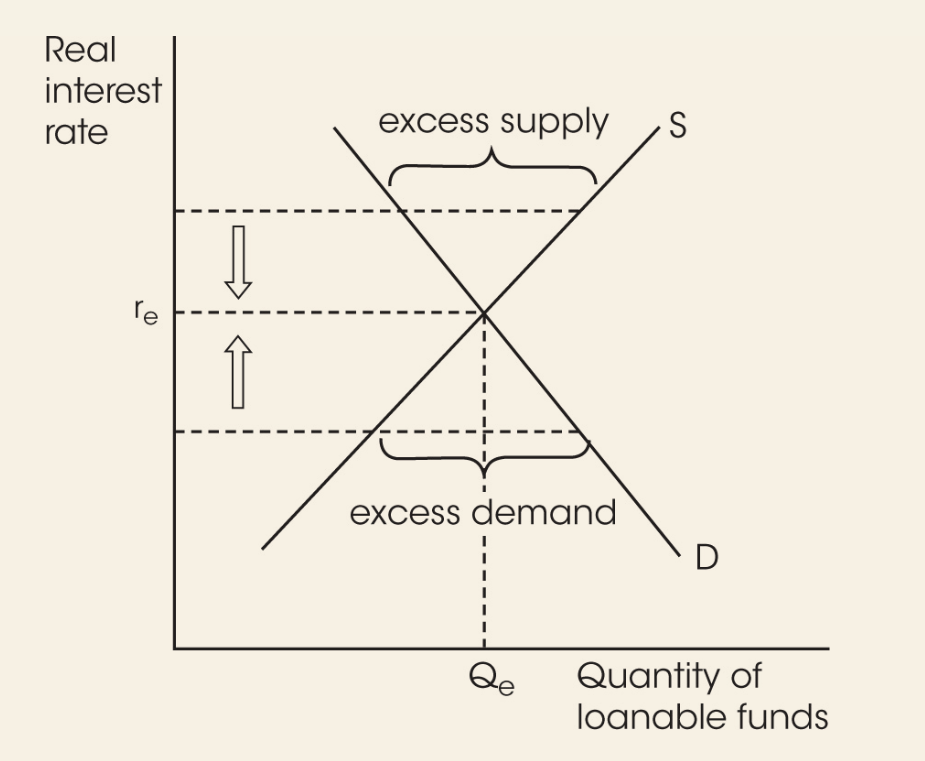
When the real rate of interest is high, the quantity of funds demanded will be relatively low. The high cost prohibits some borrowers and discourages others.
When the real rate of interest is low, the quantity of funds demanded is higher, leading the demand curve to slope downward.
The supply of funds curve slopes upward. When the real interest is high, suppliers of funds are encouraged to bring more to the market. It is the opposite if the interest rate is low, thus, the supply of funds curve is upward sloping.
When the two curves cross is the equilibrium point that determines the rate that will prevail in the market, and the quantity of funds that will be loaned out.
The quantity supplied is greater than the quantity of funds demanded. the surplus of funds drives the price and in this case, drives the interest rate down as well. If the real interest rate was lower than the equilibrium rate, then there would be an excess demand for funds.
Once there is equilibrium, there is no tendency for things to change, unless the curves shift.
Loanable funds: money available for borrowing and lending
Real interest rate: the interest rate adjusted for inflation
Real variables: things that are expressed in non-monetary units or adjusted for inflation
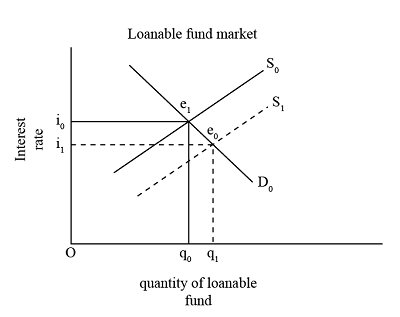
Factors increasing the supply of loanable funds:
Change in consumer preference of saving
Foreigners deciding to make more funds available
More saving due to a change in incentives
Increase in Income
The supply of funds would shift to the left if consumers decrease their savings, or any of these factors were to be reversed.
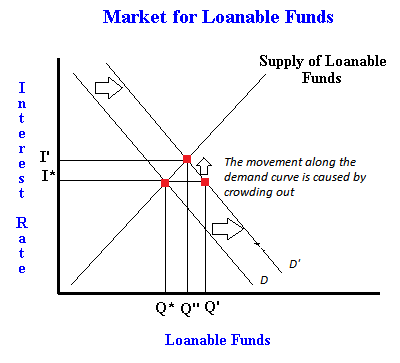
Factors Increasing demand for loanable funds:
More business opportunities present themselves
Expected future sales increase
New technologies adopted
Government borrowing increases
The Money Market
The money market is determined by the supply and demand for money. The Fed determines the supply of money in the economy. This demand is determined by how much households, firms, governments, and foreigners want to hold.
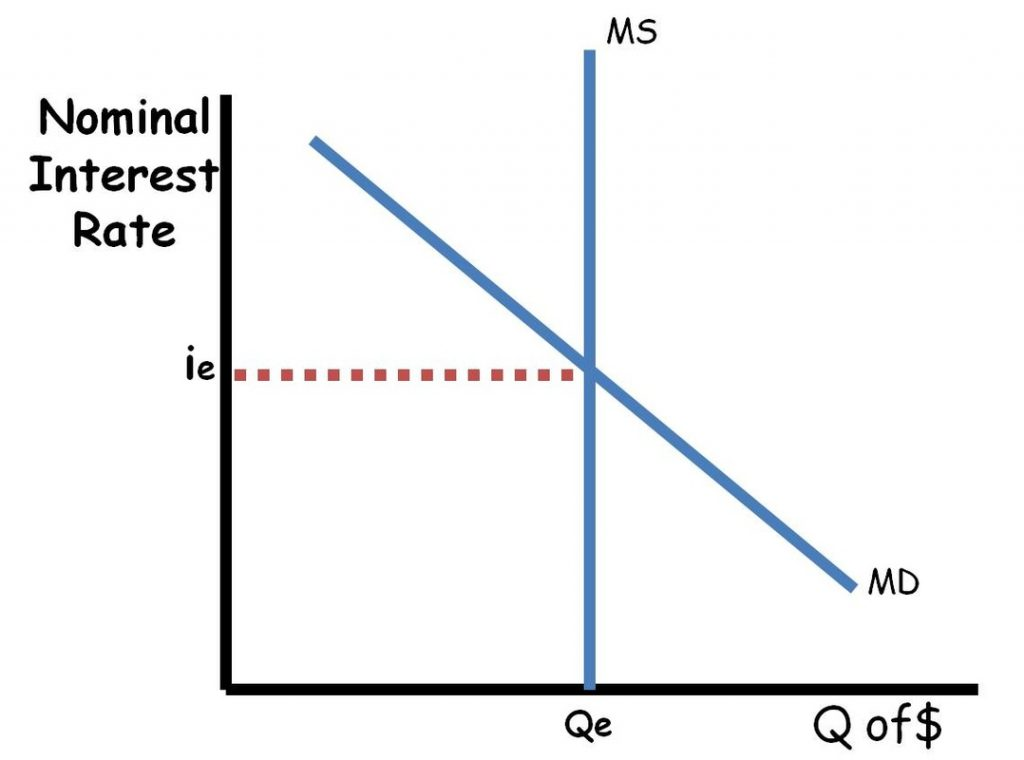
The vertical axis on the money market graph measures the nominal interest rate, and it indicates that it is not adjusted for inflation. There are many interest rates in the economy, so the nominal interest rate is an average of all these various rates. They tend to move in the same direction as well.
The horizontal axis on the diagram measures the quantity of money being supplied and demanded.
The two curves cross at an equilibrium point, where ie is the equilibrium interest rate and Qe is the amount of money supplied and demanded. Ms is the supply of money and Md is the demand of money.
The supply of money curve is vertical since it is not affected if the nominal interest rate moves higher or lower. The supply of money is determined by the Fed.
If the money supply is increased, Ms will shift to the right. If it is decreased, Ms will shift to the left.
The Supply of Money:
Why is it vertical? | The amount of money supplied to the economy which is determined by the Fed and isn’t affected by a change in the nominal interest rate |
|---|---|
What can shift it? | A change in the amount of money in the economy |
The demand for money: is the amount of money households, firms, and government, and foreign entities want to hold as currency and in their transaction accounts.
When interest rates are high, the households and firms pare down the amount of money they hold in their wallets and transaction accounts where it earns little to no interest.
When income rises, households and firms want to have more money on hand due to the fact that they conduct more transactions or more expensive transactions. Increase in income shifts Md rightward.
If prices in the economy increase, people and firms will keep more money to hand in order to conduct their business. Md shifts rightward.
The Demand for Money:
Why is it downward sloping? | A rise in the nominal interest rate induced people and firms to place their funds where it can earn the higher return. They will have less on hand due to this. |
|---|---|
What can shift it? | - Change in income- A change in price level |