
Chapter 27: Basic Macroeconomic Relationships
Income consumption + income saving relationships
Disposable income determines levels of consumption + saving
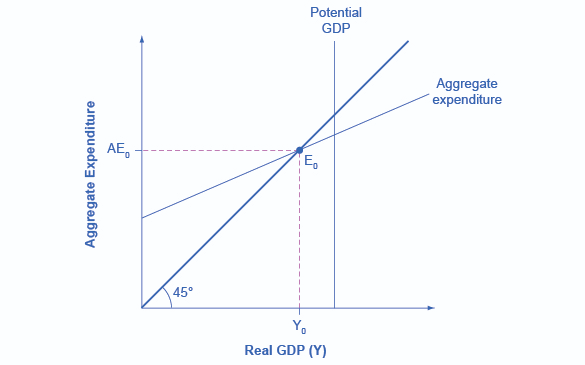
45 degree line - Reference line; the vertical distance between the 45 line and any point on the horizontal axis measures either consumption or disposable income
Consumption schedule
Consumption schedule - Schedule showing the various amounts that households would plan to consume at each of the various levels of disposable income that might prevail at some specific time
In the aggregate, households increase their spending as their disposable income rises and spend a larger proportion of a small disposable income than of a large disposable income
Saving schedule - There is a direct relationship between saving and DI but that saving is a smaller proportion of a small DI than of a large DI. If households consume a smaller and smaller proportion of DI as DI increases, then they must be saving a larger and larger proportion.
Break-even income - Income level at which households plan to consume their entire incomes
Average + marginal propensities
Average propensity to consume - The fraction, or percentage, of total income that is consumed
Average propensity to save - The fraction of total income that is saved
APC + APS = 1
Marginal propensity to consume - The proportion, or fraction, of any change in income consumed
Marginal propensity to save - The fraction of any change in income saved
MPC + MPS = 1
Non-income determinants of consumption + saving
Wealth
Dollar amount of all the assets that it owns minus the dollar amount of its liabilities (all the debt that it owes)
Wealth effect - Events sometimes suddenly boost the value of existing wealth. When this happens, households tend to increase their spending and reduce their saving.
Borrowing
When a household borrows, it can increase current consumption beyond what would be possible if its spending were limited to its disposable income
Lower consumption in future (repaying debts)
Expectations
Household expectations about future prices and income may affect current spending and saving
Real interest rates
When real interest rates (those adjusted for inflation) fall, households tend to borrow more, consume more, and save less (and vice versa)
Other important considerations
Movement b/w points on consumption schedule = Change in amount consumed
Changes in wealth, expectations, interest rates, and household debt will shift the consumption schedule in one direction and the saving schedule in the opposite direction
A change in taxes shifts the consumption and saving schedules in the same direction
The consumption and saving schedules usually are relatively stable unless altered by major tax increases or decreases
Interest-rate-investment relationship
Expected returns + interest rate determine investment spending
Expected rate of return - Anticipated revenue that will be generated
Expected rate of return > Interest rate → Investment should be done
Investment demand curve - Shows the amount of investment forthcoming at each real interest rate
Shifts of investment demand curve
Acquisition, maintenance, operating costs - When these costs rise, the expected rate of return from prospective investment projects falls and the investment demand curve shifts to the left
Business taxes - An increase in business taxes lowers the expected profitability of investments and shifts the investment demand curve to the left
Technological change - A rapid rate of technological progress shifts the investment demand curve to the right
Stock of capital goods on hand - When the economy is understocked with production facilities and when firms are selling their output as fast as they can produce it, the expected rate of return on new investment increases and the investment demand curve shifts rightward
Planned inventory changes - If firms are planning on decreasing their inventories, the investment demand curve shifts to the left
Expectations - If executives become more optimistic about future sales, costs, and profits, the investment demand curve will shift to the right
Instability of investment
Durability of capital goods - Because of their durability, capital goods have indefinite useful lifespans
Irregularity of innovation - Major innovations such as railroads, electricity, automobiles, fiber optics, and computers occur irregularly
Variability of profits - The variability of profits contributes to the volatile nature of the incentive to invest
Variability of expectations - Firms’ expectations can change quickly when some event suggests a significant possible change in future business conditions
Multiplier effect
Relationship b/w spending + GDP
Multiplier - Ratio of a change in GDP to the initial change in spending
Change in GDP = Multiplier * Initial change in spending
Mainly a Keynesian interpretation of economics
Multiplier + marginal propensities
Multiplier = 1 / Marginal Propensity to Spend
The smaller the fraction of any change in income saved, the greater the spending at each round and, therefore, the greater the multiplier