


Chapter 7: Inventory and Cost of Goods Sold
Objective 7.1: Describe the issues in managing different types of inventory
Types of Inventory
Merchandise inventory consists of products that are already made. Merchandisers then sell these finished goods to their customers.
Manufacturers have three types of inventory: raw materials, work in process, and finished goods.
These three types of inventory represent the manufacturing process.
Raw materials are materials that are waiting to be processed, such as plastic, steel, and fabric.
Work in Process goods are not up for sale yet, but are in the process of getting to that stage.
Finished goods are the inventory that are completed and ready to be sold to customers.
Raw materials are used to create the goods that are in the process of being manufactured, which results in the completed products
Consignment inventory are any products being held by a company so they do not claim ownership over the owners’ product. In the case the inventory is difficult to sell, the ownership is not under them.
Goods in transit are goods being transported to the location of the buyer, whether this is someones front door or a store getting ready to sell those items (Walmart).
Inventory Management Decisions
Inventory managers must:
Ensure there is enough inventory to meet demand.
Ensure the quality of the product is satisfactory.
Minimize costs of acquiring, transporting, and storing inventory.
Objective 7.2: Explain how to report inventory and cost of goods sold.
Balance Sheet and Income Statement Reporting
Inventory is reported on the Balance Sheet as a current asset because it will be sold to generate cash within a year.
When inventory is sold, the cost moves from the Inventory account (balance sheet) and becomes Cost of Goods Sold expense (income statement).
Equation to calculate gross profit:
Net Sales - Cost of Goods Sold = Gross Profit
Cost of Goods Sold Equation
The Cost of Goods Sold equation changes depending if it’s for periodic or perpetual updating of inventory.
Periodic Updating is used for small businesses (mom and pop shops).
It uses the Cost of Goods Equation, which is:
Beginning Inventory + Purchases - Ending Inventory = Cost of Goods Sold
Perpetual Updating is used for bigger companies (Walmart).
It uses the Ending Inventory equation, which is:
Beginning Inventory + Purchases - Cost of Goods Sold = Ending Inventory
Example (periodic): A company has 10 units in their beginning inventory that each cost $15. The company then purchases 25 units that cost $15 each. Its has 15 units in ending inventory. (COGAS = Cost of Goods Available for Sale)
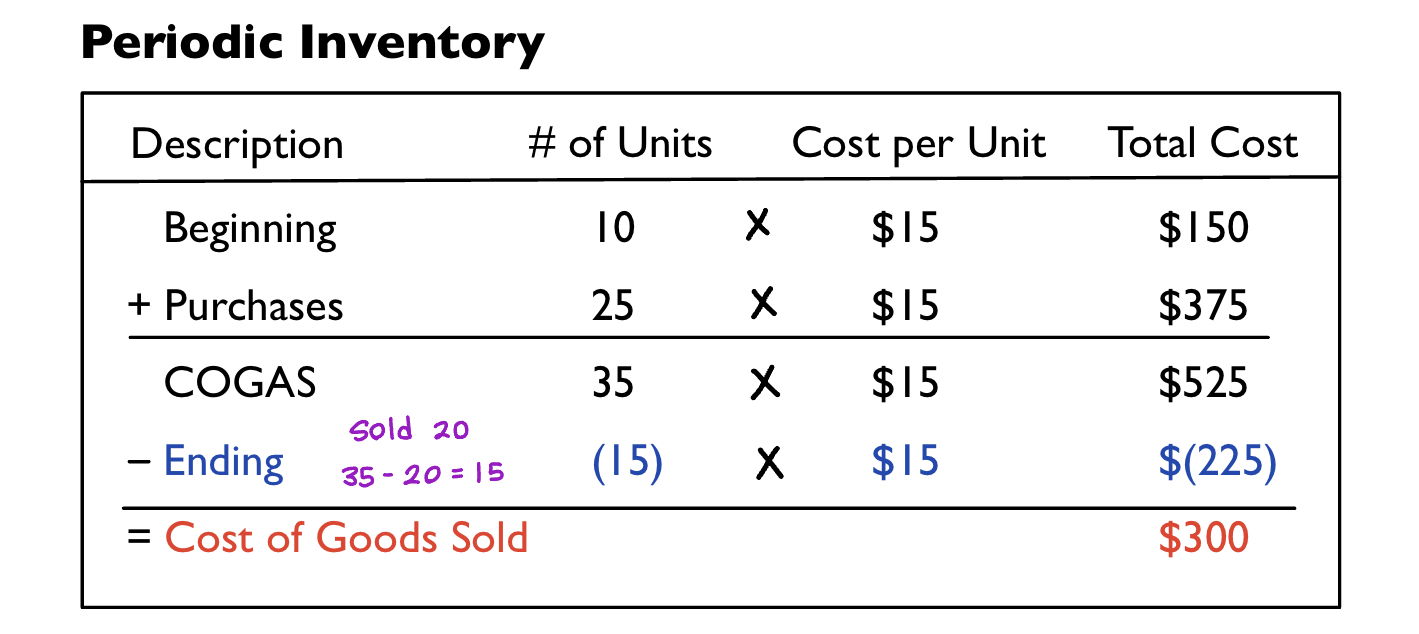
Periodic Steps
Step 1: Multiply number of units and cost per unit to find the total cost of beginning inventory and purchases.
10 x $15 = $150
25 x $15 = $375
Step 2: Add the number of units for beginning inventory and purchases to find COGAS units and total cost.
10 + 25 = 35 units
$150 + $375 = $525
Step 3: We are told that ending inventory is 15.
Step 4: Multiply ending inventory units by cost per unit to find total cost.
15 x $15 = $225
Step 5: Subtract total cost of ending inventory from COGAS to find the total cost of Cost of Goods Sold.
$525 - $225
Cost of Goods Sold = $300
Example (perpetual): A company has 10 units in their beginning inventory that each cost $15. The company then purchases 25 units that cost $15 each. It then sells 20 units.
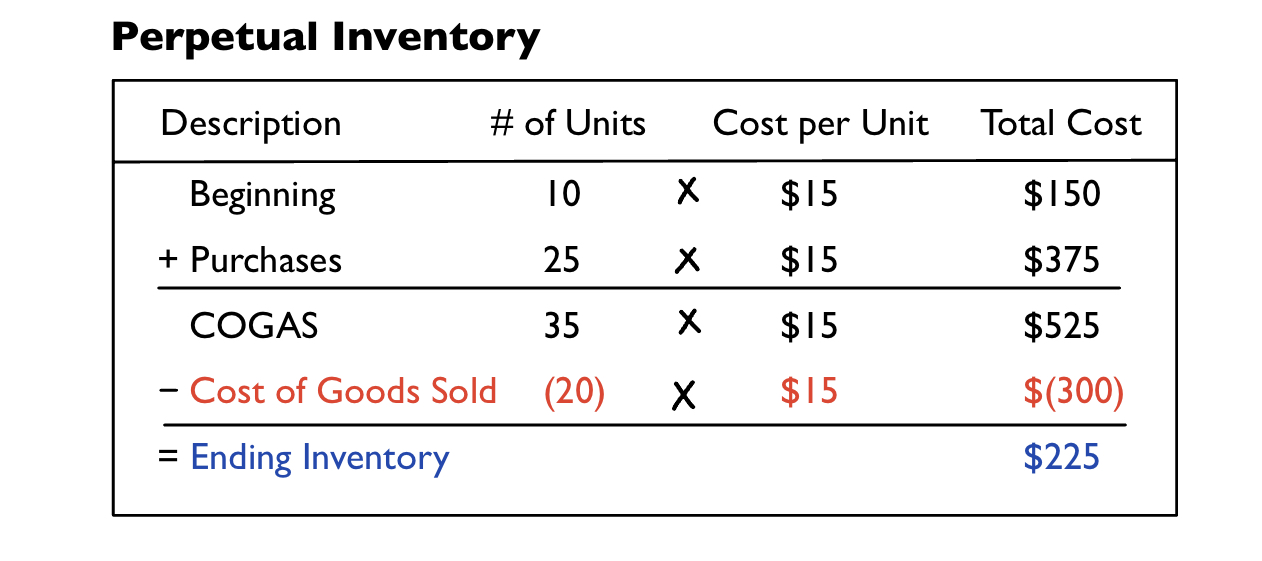
Step 1: Multiply number of units and cost per unit to find the total cost of beginning inventory and purchases.
10 x $15 = $150
25 x $15 = $375
Step 2: Add the number of units for beginning inventory and purchases to find COGAS units and total cost.
10 + 25 = 35 units
$150 + $375 = $525
Step 3: We are told that cost of goods sold is 20
Step 4: Multiply cost of goods sold units by cost per unit to find total cost.
20 x $15 = $300
Step 5: Subtract total cost of cost of goods sold from COGAS to find the total cost of ending inventory.
$525 - $300
Ending inventory = $225
Objective 7.3: Compute costs using four inventory costing methods.
Inventory Costing Methods
The four inventory costing methods tell us the value of what was sold and what should be in Cost of Goods expense.
All methods are accepted by the Generally Accepted Accounting Principles (GAAP).
Specific identification
Individually identifies and records the cost of each item sold as Cost of Goods Sold.
The cost of each item must be tracked.
This method is best used for luxury items (Cars, Jewelry)
The last three are not based on physical flow of goods, but based on Cost Flows Assumptions, which are assumptions accountants make about the flow of inventory costs.
First in, first out (FIFO) - Inventory goes out (sold) in the order the goods are received.
Last in, last out (LIFO) - The last goods received are the first to be sold.
Weighted average - The average for Cost of Goods Available for Sale is used for each good sold and for the goods that are still in inventory.
Equation to calculate weighted average cost:
Cost of Goods Available for Sale/Number of Units Available for Sale = Cost per unit
Apply the average to what was sold and what was not sold (sales and ending inventory).
Equation to calculate total cost:
Number of units x Cost per units = Total cost
After sales are made, calculate ending inventory by subtracting sales from beginning inventory.
Example: Using the following table of information, we will apply it using the specific identification method, FIFO method, LIFO method, and weighted average.
Date | Description | Cost |
|---|---|---|
November 1 (first in) | Purchased 1 Unit | $60 |
November 5 | Purchased 1 Unit | $65 |
November 7 (last in) | Purchased 1 Unit | $85 |
November 10 | Sold 2 Units | $115 per unit |
Specific Identification
The cost of each item sold is recorded as part of Cost of Goods Sold.
Example: Units from from November 1 and November 7 are sold.
$60 + $85 = $145
$145 is reported as Cost of Goods Sold
The unit from November 5th that was not sold remains in Inventory ($65).
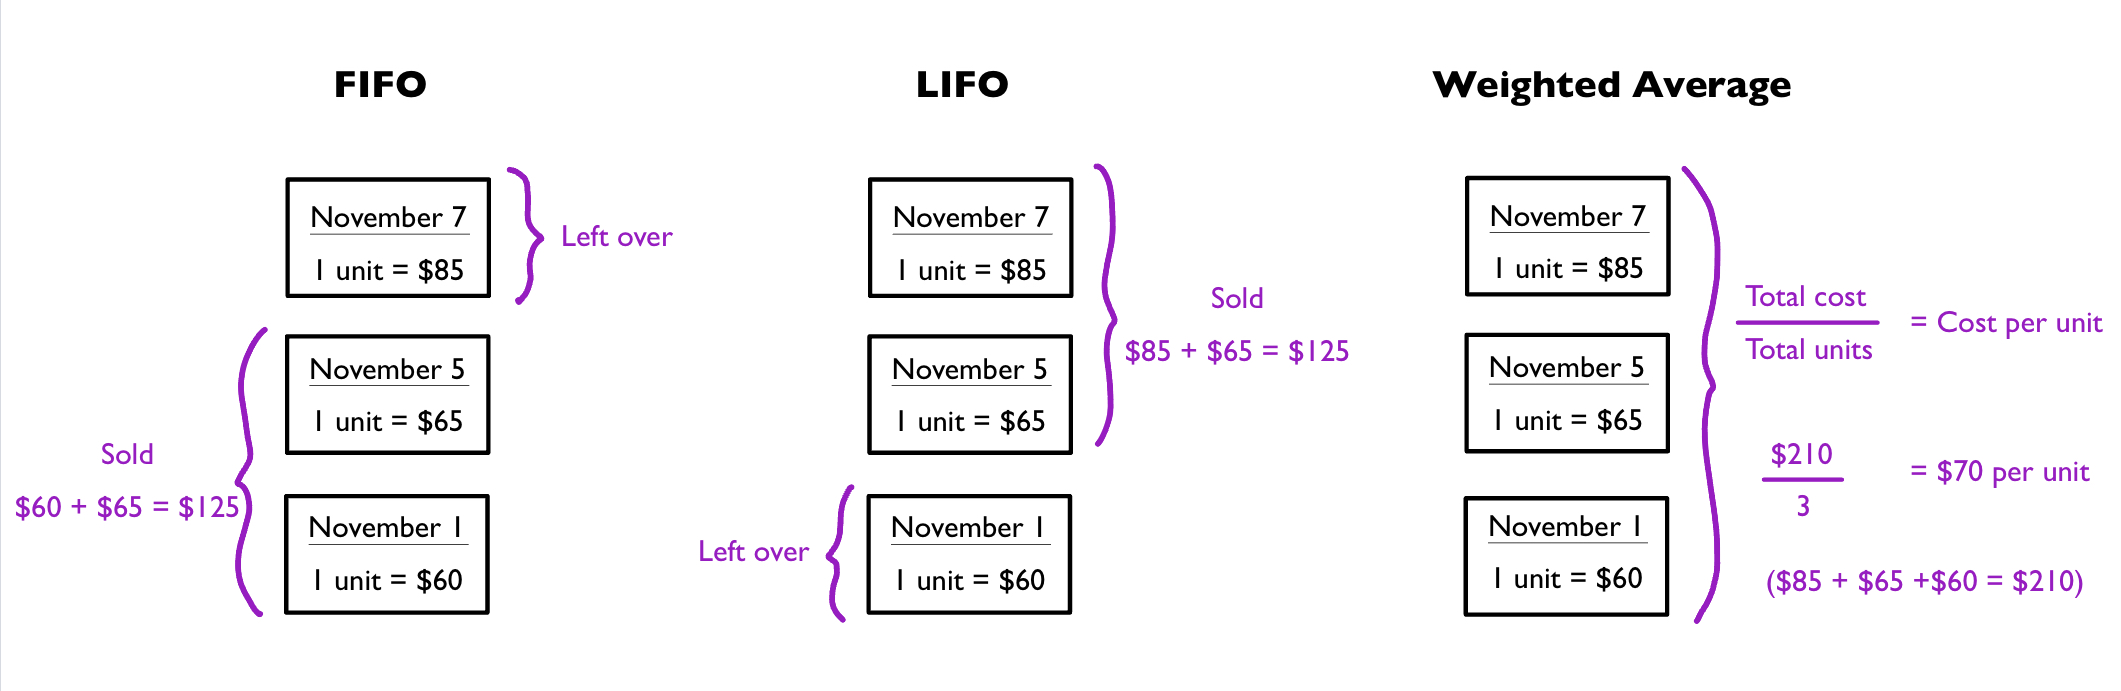
FIFO (First in, first out)
We are selling 2 units.
The first unit purchased was on November 1st, so we sell that first.
The second unit we would sell would be from November 5th.
Add those units together: $60 + $65 = $125 (Cost of Goods Sold)
LIFO (Last in, first out)
We are selling 2 units.
The last unit purchased was on November 7th, so we selling that first.
The second unit we would sell would be from November 5th.
Add those units together: $85 + $65 = $125
Weighted Average
We use the equation (total cost/total units) = Cost per unit.
Add the cost of each unit together to find total cost: $85 + $65 + $60 = $210
We have a total of 3 units.
Divide total cost by total units: 210/3 = $70 per unit
Financial Statement Effects
The inventory costing methods split cost of goods available for sale between ending Inventory and Cost of Goods Sold differently.
Cost that goes into Inventory will not go into Cost of Goods Sold.
The method that results in the highest cost in Inventory will have the lowest cost in Cost of Goods Sold.
The method that results in the highest cost in Cost of Goods Sold will have the lowest cost in Inventory.
Costs rising and falling have different financial effects
Rising costs = larger inventory and smaller cost of goods sold.
Falling costs = smaller inventory and larger costs of goods.
Tax Implications and Cash Flows Effects
Using a method that results in lower inventory and higher cost of goods sold is beneficial because of lower income tax.
A company may only switch from one method to another if it improves the accuracy of the company’s financial results.
Methods can also be used for specific types of inventory, but must be consistent with how the method is used.
The LIFO conformity rule says the method used for the company’s income tax return must also be used for the financial statement.
Objective 7.4: Report inventory at the lower of cost or market/net realizable value.
Lower of Cost or Market/Net Realizable Value
The value of inventory may be lower than the cost of the inventory because…
It is replaced by similar goods and a lower cost
The goods are outdated or damaged.
As required by the GAAP, there is a rule for reporting inventory at the lower cost or market (LCM)/net realizable value (NRV).
If the inventory value has fallen below its cost, it must be marked down to the lower value.
Market value is a replacement cost.
Net realizable value is the inventory value to be realized when sold.
Objective 7.5: Evaluate inventory management by computing and interpreting the inventory turnover ratio.
Inventory Turnover
Inventory balance can be good or bad. When you have a lot of inventory for sale, you will make good profit. When inventory builds up because of lack of sales, thats bad.
Inventory turnover is the cycle of an increasing balance when a company buys goods and a decreasing balance when a company sells goods.
To evaluate change in inventory, we use inventory turnover analysis.
An inventory turnover ratio shows how many times inventory is bought and sold. A higher ratio indicates inventory is bought and sold quickly.
Equation to calculate the inventory turnover ratio:
Cost of Goods Sold/Average Inventory
The higher the better.
Days to Sell
“Days to Sell” focuses on the length of time it takes to sell inventory.
Equation to calculate days to sell:
365/Inventory Turnover Ratio
A higher number represents a longer amount of time to sell goods.
Example of Inventory Turnover and Days to Sell
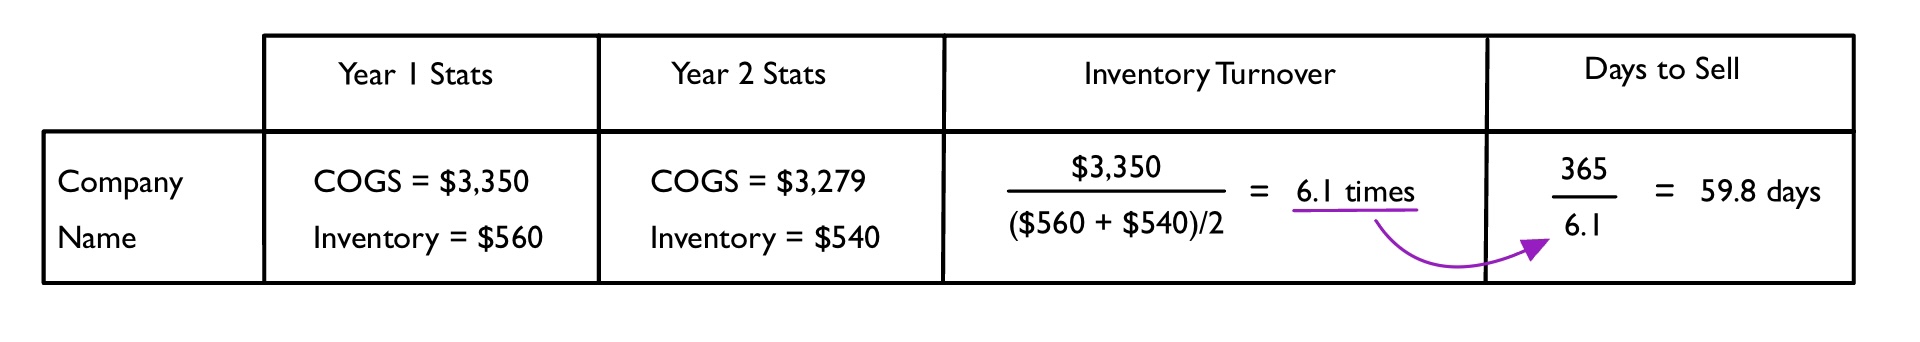
The chart shows the Cost of Goods Sold (COGS) and Inventory of a company from two different years.
Using this information, it is plugged into the inventory turnover equation.
The inventory turnover ratio is then plugged into the days to sell equation to get the final answer.