
8. Indicators and Assessment Systems
Indicators
Examples of Indicators for UNSDG
Goal Number | Goal | Indicator Used |
|---|---|---|
1 | End Poverty | Proportion of population living in households with access to basic services |
3 | Ensure healthy lives and promote well-being at all ages | Mortality rate attribute to unsafe water, unsafe sanitation and lack of hygiene |
6 | Ensure availability and sustainable management of water and sanitation | Proportion of population using safely managed sanitation services and a hand washing facility with soap and water |
7 | Ensure access to affordable, reliable, sustainable and modern energy for all | Renewable energy share in the total final energy consumption |
9 | Build resilient infrastructure, promote inclusive and sustainable industrialisation and foster innovation | Proportion of the rural population who live within 2km of an all-season road |
11 | Make cities and human settlements inclusive, safe, resilient and sustainable | Proportion of urban population living in slums, informal settlements or inadequate housing |
12 | Ensure sustainable consumption and production patterns | Material footprint, material footprint per capita, and material footprint per GDP |
13 | Take urgent action to combat climate change and its impacts | Total greenhouse gas emissions per year |
There is voluntary national review of progress towards sustainable goals. UK data for the Global indicators from the Office of National Statistics. Data is open, transparent and accessible via the National Reporting Platform. It sets out which data is available, its source, disaggregation and any other relevant information.
Mineral Products Association Sustainable Development Report
MPA is the trade association for aggregates, asphalt, cement, etc, and other industrial mineral industries. Covers a huge proportion of mineral and concrete production in the UK.
Measures the use of primary materials year on year, in tonnes, and the CO2 emissions from different mineral productions.
The data measured shows that primary material use has been decoupled from GDP and development in the UK.
The report is to a broad set of stakeholders, so many indicators to show lots of information, e.g. percent of aggregate sites with certified EMS for the natural environment, lost time incident frequency rate to measure health and safety, number of recorded complaints to measure community related stakeholders, etc.
Company Indicators
A companies chosen indicators to use in reports can tell us about their priorities, and which stakeholders they are referring to.
Why use indicators?
Tracking policies
Comparing trends
Measuring and managing performance
Benchmarking and target setting
Reporting
Compliance
Association of Chartered Certified Accountants (ACCA) said that sustainability reporting helps all stakeholders to gauge non-financial risks, and identify poor performance.
Who are the indicators for?
Actors and stakeholders who are interested and who can make a difference
People that can act to change the indicator value
People affected by indicator measures
People whose opinion could be changed by the data
e.g. policy makers, planners, clients, staff, neighbours, etc.
Environment Indicators
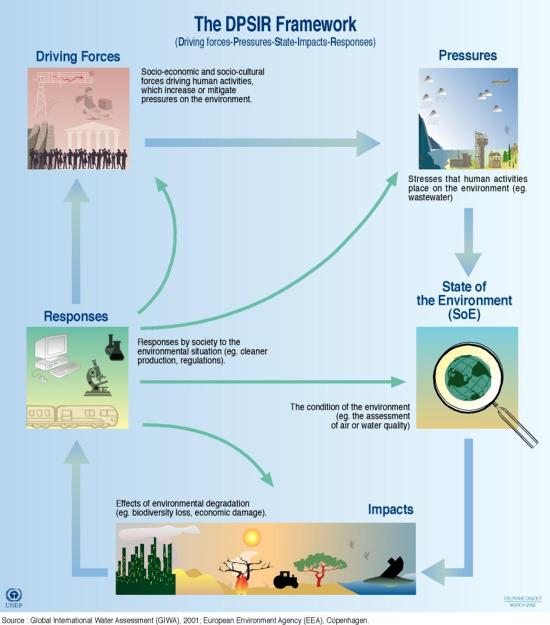
DPSIR elements are Drivers, Pressures, State, Impact and Responses. Information from indicators links these elements. e.g. need good indicator of the pressure on the environment to link to the state of the environment, and indicators of both are used to understand this link.
Good indicators are associated with actions, actors and stakeholders.
Key Points on Indicators
Have to measure to manage
Indicators important at all levels and stages
Good indicators associated with clear objectives, stakeholders, and actions to manage performance
Uses of indicators in management, marketing, benchmarking, target setting, compliance and reporting
Indicators are important in raising standards
Assessment Systems
Construction Products Association (CPA)
CPA used to benchmark performance using Key Performance Indicators but now discontinued, as organisation developed their own systems.
Used a performance improvement cycle and reporting tool to:
Decide what to measure
Collect data
Calculate KPIs
Report results
Analyse results
Take action
Measure again
CPA focused on customer related, environment related and people related data.
Radar plots are used to show all the data on one plot:

Benefits of Radar Plot: Compares different measures in a single plot, Benchmarks company performance against sector
Limitations of Radar Plot: No comparison to environmental limits or targets
Code for Sustainable Homes (discontinued)
This code was discontinued but is used as a benchmark by some clients and authorities.
There are a set of indicators with graded values corresponding to points, with baselines for minimum requirements being met.
The graded values are weighted and combined into a single star rating system which is easy to use for marketing.
Uses inputs from Ecopoints.
Minimum standards are being set by local authority planners and social housing developers.
Energy is considered the biggest issue in this code. BUT there is no comparison to environmental limits so don’t know what level of energy use is sustainable.
Limitations of Code for Sustainable Homes:
Single score looses detail
Weightings are subjective
Weightings may change
No comparison to environmental limits
Is it measuring sustainability or just improvement?
BRE LCA and Ecopoints
Communicates the results of an LCA to those who need it. Provides an LCA and certification of construction products.
Based on a 60-year lifetime and 13 environmental impact categories which are normalised and weighted into Ecopoints, to give an A+ to E rating.
Different construction components considered in different building types.
BREEAM Infrastructure (formerly CEEQUAL)
This is a much broader sustainability rating system for civil infrastructure.
OBJECTIVES:
Improve sustainability awareness within the industry and continuous improvement
Promote the importance of a sustainability driven strategy for the project or contract
Promote improved sustainability performance in specification, design and construction in the project or contract
Recognise and promote the achievement of high economic, environmental and social performance in all forms of civil engineering
The assessment shouldn’t be limited to any one section, as the broad spectrum will be lost.
Category 7: Resources is the most relevant to civil engineers.
There are five different assessment types, which include different combinations of assessment stages included in the scope of the assessment.
The rating levels are from Outstanding to Pass, or Unclassified, depending on the overall score.
The assessment process includes many steps, starting from appointing an assessor, gathering evidence and allocating credits for each assessment issue, getting this verified then double checked, all before receiving the certificate. Each category has a weighting which calculates the max. available credits, and the credits achieved is given as a percentage. These are all averaged to determine the overall BREEAM score as a percentage.
Limitations of BREEAM Infrastructure:
Concentrates on design and construction
No considerations of environmental limits
Are the same weightings appropriate to all projects?
BREEAM
BREEAM = Building Research Establishment Environmental Assessment Method, a sustainability assessment and rating principally for buildings
BREEAM sets standards for the environmental performance of buildings through all stages and operation phases. Can be used for new developments as well as refurbishment schemes.
Focuses on sustainable value in a range of categories, e.g. Energy, Water, Pollution, Waste, etc.
It provides solutions in:
net zero carbon
whole life performance
health and social impacts
circularity and resilience
biodiversity
disclosures and reporting
New Approach to Appraisal (NATA)
NATA: Government’s method of appraising the impacts and benefits of transport schemes.
It is currently not used, but key elements of the framework remain in the guidance. It is built on cost-benefit analysis and environmental impact assessment techniques.
Assessment criteria includes:
Environment
Engineering feasibility
Economy
Accessibility
Integration into existing infrastructure
Safety
This is carried out for different options and compared.
BedZED
BedZED = Beddington Zero Energy Development
zero fossil fuel energy
reclaimed land
mixed use homes
thermal mass, well insulated, south facing, water recycling buildings
locally sourced materials
green transport plan
All 10 One Planet Principles are considered:
Health and happiness
Local and sustainable food
Equity and Local economy
Sustainable materials
Culture and community
Sustainable transport
Land use and wildlife
Zero waste
Sustainable water
Zero carbon