
Biostatistics, Chapters I & II
Sampling
Population: complete collection of all measurements or data that are being considered.
Sample: sub-collecion of members selected from a population
Simple Random Sample: each member of the population has the same change of being included, and samples are chosen independently
Cluster Sampling: dividing the population into groups by a category. All of the individuals within the single group are the sample.
Stratified Random Sampling: divide the population into groups (strata) based on one+ classification criteria. Then perform a simple random sample within each strata
Sampling Bias: some members of the population have a higher chance to be selected than others.
Variables
Categorical Variables: two+ categories, but no intrinsic ordering (ex: blood type)
Ordinal Variable: categorical variables but with a clear ordering (small/medium/large)
Numeric Variables
Discrete Variables: a numeric variable for which we can list the possible values (think: integers)
Continuous Variable: a numeric variable that is measured on a continuous scale (temperature, height)
Bar Charts: frequency distribution for categorical variables
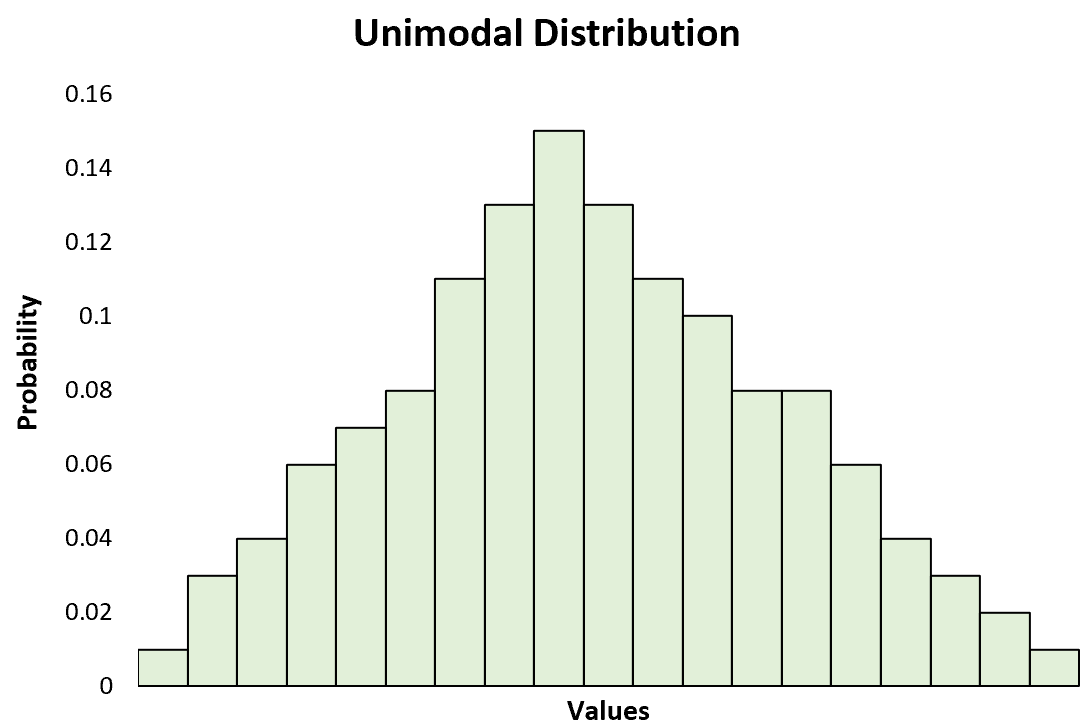
Histograms: frequency distribution but no spaces
Frequency Variables
Mean, denoted by ȳ
Mean: The average of the observations
Only for discrete or continuous data
ȳ = (Σ yi)/(n)
Sensitive to outliers
Median, denoted by ỹ
N is odd: (n + 1)th largest value
N is even: average of (n/2)th largest value and (n/(2) + 1)th
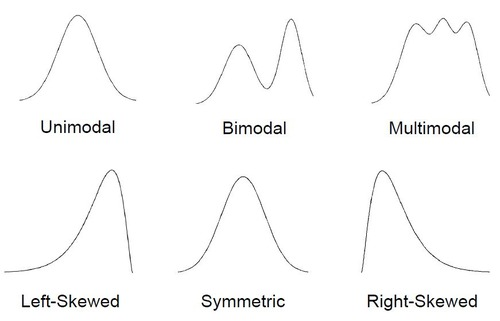
Symmetric and Unimodal Curve
Symmetric and Multimodal Curve
Box Plots
Quartiles
Q1 = 25th Percentile
Q2 = 50th Percentile (Median)
Q3 = 75th Percentile
Fences
LF = Q1 - h
UF = Q3 + h
h = 1.5(Q3 - Q1)
Outliers are any points that lie outside of the LF and UF
Drawing a Box Plot
Central box from Q1 to Q3
Line in the middle is Q2
Whiskers extend to the point CLOSEST to the LF & UF (not the actual values of the fences)
Outliers are marked by small circles
Label y axis
Variance
Sample variance
s^2 = Σ(yi - ȳ)^2 / n - 1
Remember to subtract one from n
Simple Standard deviation
Sqrt(s^2)
Same unit as the original data value