
7 & 8 Computed Tomography
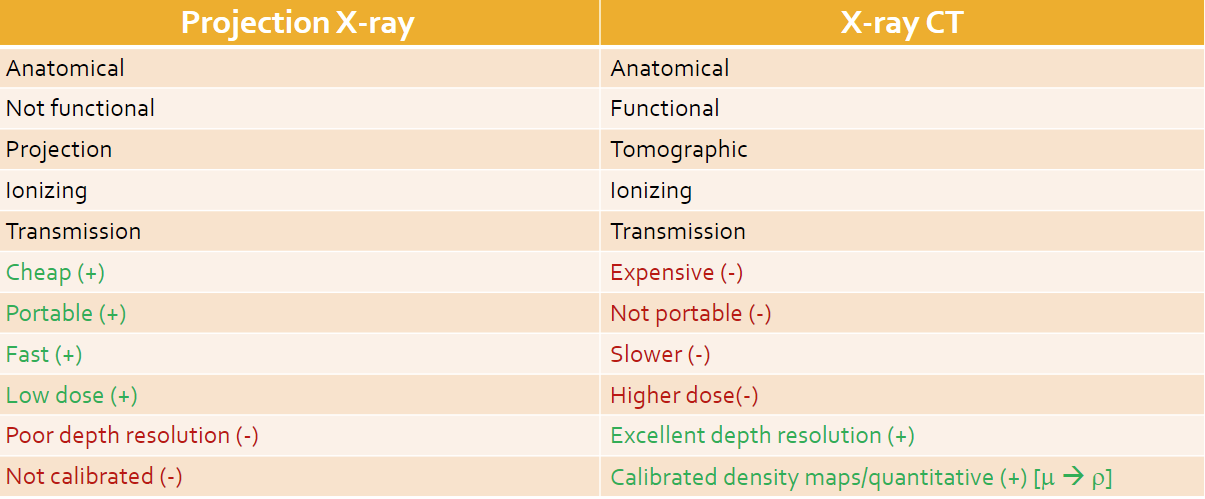
X-Ray CT vs Projection X-Ray
Introduction
CAT: Computed Axial Tomography, same as a CT
Scanner Generations
First generation CT scanner
One detector
Pencil-like x-ray beam
Translate/rotate movements
Usually lasted 25-30min
Second generation CT scanner
2-30 detectors
Fan-shaped x-ray beam
Translate/rotate movements
Lasted less than 90 seconds
Third generation CT scanner
288 sometimes over 1k scanners
Fan-shaped x-ray beam
Rotate-rotate movement
Lasted only 5 seconds
Fourth generation CT scanner
More than 2k scanners
Fan-shaped x-ray beam
Rotate-fixed
Lasted only a few seconds
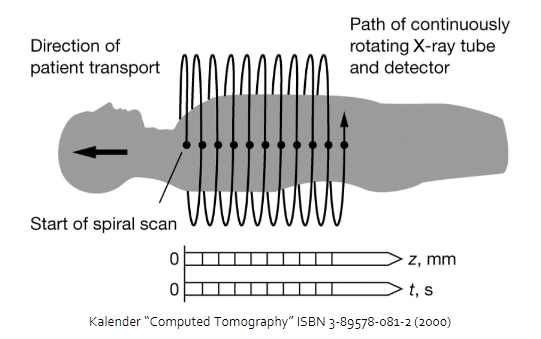
Spiral CT
Spiral x-ray rube and detector around the patient
Uses slip ring technology, brushes along the fixed part of the machine so that cables wouldn’t get wound up in the CT
Data Measurement
The projection function sums the attenuation of the X-ray beam along line t in the s-direction
(perpendicular to the axis t).The one-dimensional Fourier Transform of the projection function at an angle θ , ( ) P t θ , can be
written as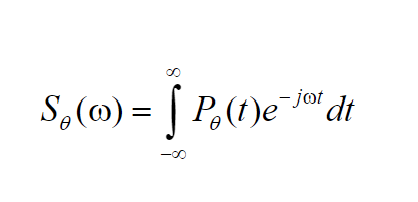
If we take these projections at many angles, then we can get the 2D Fourier transform of the projections at many such lines inclined at various angles. If the number of angles is large enough, we will get many lines of 2D Fourier transforms of the object.
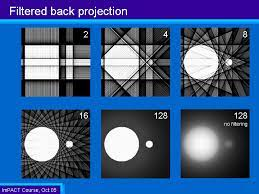
The most commonly used algorithm for actually reconstructing a medical image from projection data is the filtered backprojection algorithm
the magnitude of the filter increases with frequency (compensates for lack of data)
More projections yields an increase in the accurately of the reconstructed image (but it can increase radiation delivered to the patient)
The conventional way to image a 3D object is to use a 2D reconstruction algorithm on successive
planes, and stacking the planes. A more efficient method is to illuminate the object from a point
source, and the X-ray flux is measured on a plane.Cone Beam reconstruction: illuminate the object from a point source, and the X-ray flux is measured on a plane to create a 3D image
Measure signal intensity and convert to attenuation
Line integram: integral of mu as a function of time (negative natural log of I over I0)
Sinogram
Forward projection: Generate the singogram from all line integrals stacked as a attenuation vs projection angel
The sinogram is a x’-Φplot of the projection data PΦ (X’)
0 to 180 degrees
Depicts how object(s) appear when viewed from different angles
Shows the shadows an object makes on the detector at an angle Φ
Shows the attenuation profile of the object at angle Φ
Shows the line integral at angle Φ
Can be used to estimate internal object structure (location, size, etc.)
CT Image Reconstruction
Filters are used (convolution kernels) to smooth the attentuation profiile
More angles means more clear determining of objects in an image
The image produced is an array of density values
2D image is a 2D density matrix
3D image is a 3D density matrix
Matrix is numbers in Hounsfield units
Hounsfield units: Values calculated to represent the attenuation of differed substance of a diagnostic image
HU = 1000 x (initial mu - mu of water all divided by mu of water)
The HU of water is zero
CT number is proportional to physical density, which produces contrast between different tissue types