Chapter 19: SL textbook: Lessons A-C
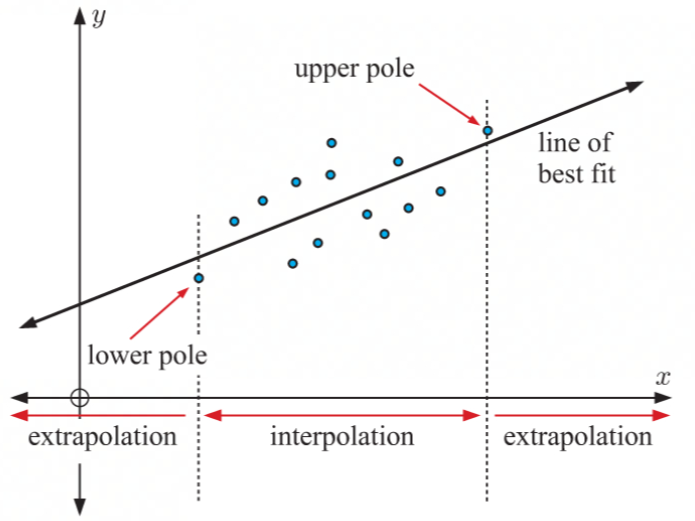
Poles
the highest and lowest data values
Interpolating
when predicting that the x and y values would lie between the poles
the accuracy of the prediction is determined by the fit within the linear model
Extrapolating
when predicting that the x and y values would lie outside of the poles
the accuracy of the prediction is determined by the linear fit and under the assumption that the trend will pass the poles
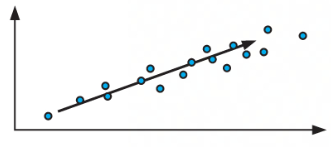
Line of Best Fit
only worth drawing when there is a strong correlation between variables
How to draw:
calculate the mean values of both x and y
mark the mean points
draw a line between the mean points which best fits the data so the points are equally distributed around the line
Line of Best Fit by Eye
when drawing a line by observation
will vary from person to person
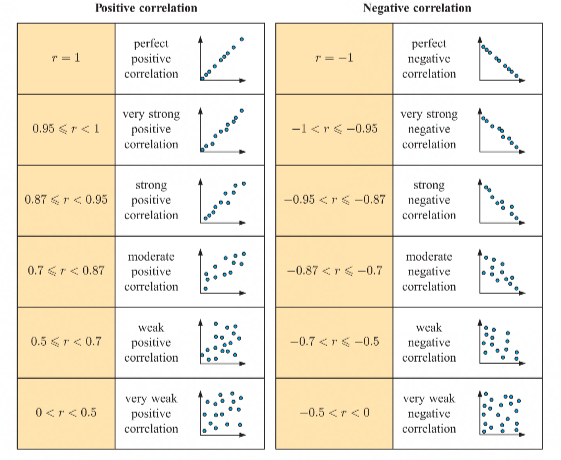
Correlations of r
sign indication of r
when + r = positive correlation
when - r = negative correlation
when 0 = r = no correlation
size indication of r
when r is close to + 1 or - 1 then there will be a strong correlation
when r is close to 0 then there will be a weak correlation
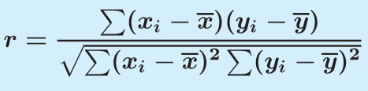
Pearson”s Product-moment Correlation Coefficient
Causal Relationship
AKA: explanatory variable/response variable
if a change in one variable explains the change in the other variable
independent variable explains the dependent variable
a causal relationship can not be determined based on high occurrence alone
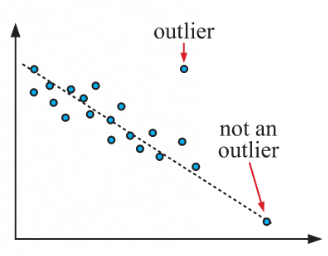
Outlier
isolated points from the trend formed by the main data body
discard if it is a result of a recording error
keep if it is genuine data
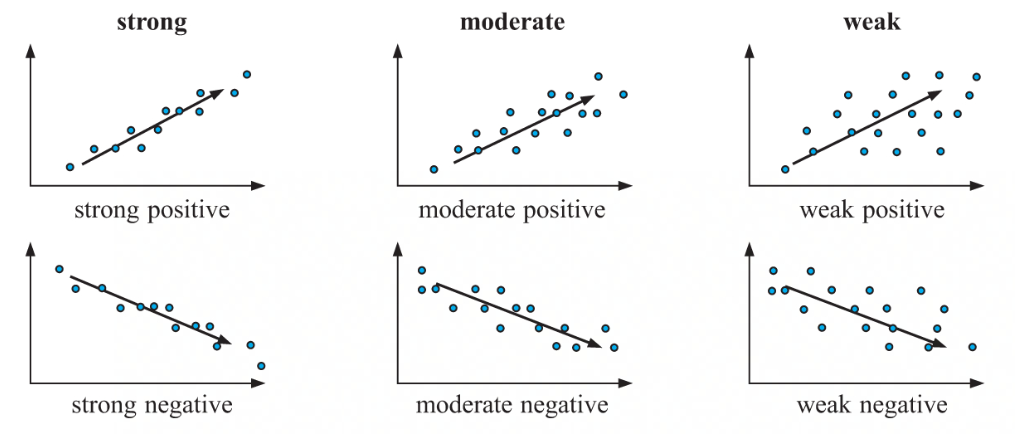
Strength
used to determine how closely a trend is followed
correlation will be described as either:
strong
moderate
weak
subjective way to determine data trends
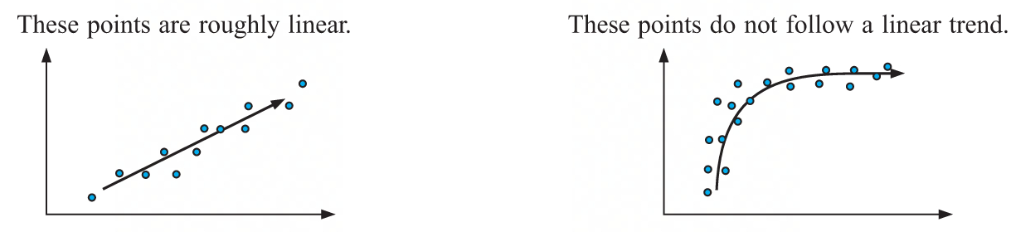
Linear
when a trend exists
the points will form an approximately straight line
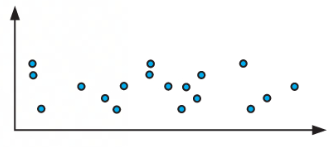
randomly scattered
no correlation
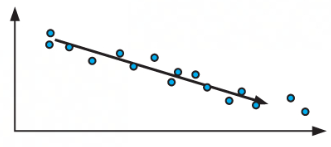
Downward Trend
a negative correlation
an increase in the independent variable
a decrease in the dependent variable
Upward Trend
a positive correlation
an increase in the independent variable
an increase in the dependent variable
Correlation
the relationship or association between two numerical values
one variable does not inherently cause the other
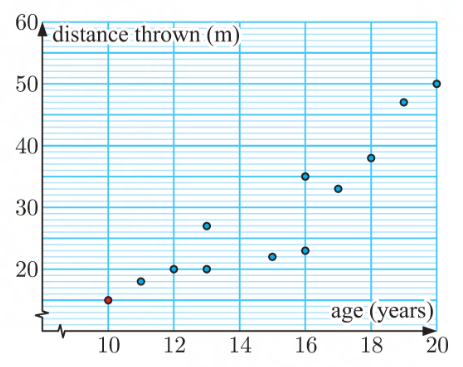
Scatter Diagram
shows the relationship between two numerical values
the independent variable is on the horizontal axis
the dependent variable is on the vertical axis