What is a Frequency Table?
Shows the number of individuals having each value.
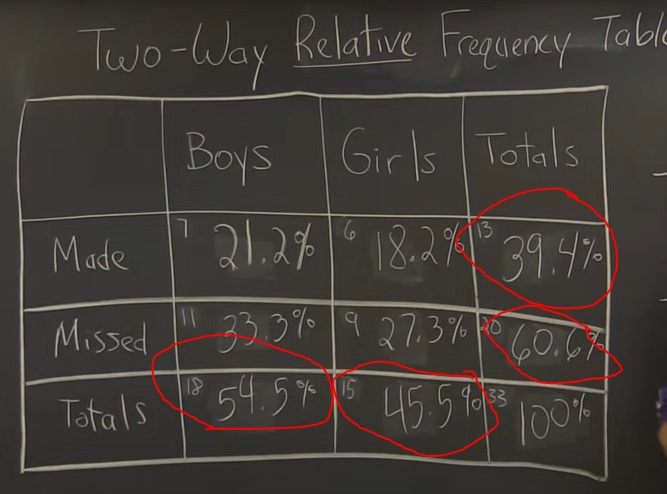
What is a Relative Frequency Table?
Shows the proportion (percent) of individuals having each value within a table.
What is a Bar Graph?
Shows each category as a bar. The heights of the bars show the category counts or relative frequencies (percent).
What is a Pie Chart?
Shows each category as a slice of the “pie.” The areas of the slices are proportional to the category percentages. MUST ADD UP TO 100%, this might include adding an “other” category.
What is a Two-Way Table?
A table of counts that summarize data on the relationship between two categorical variables for some group of individuals.
What is Marginal Relative Frequency?
Gives the percent/proportion of individuals that have a specific value for one categorical variable. Percent on the outside
EX: 13/33 = 39.4%; think of another one.
What is Joint Relative Frequency?
Gives the percent/proportion of individuals that have a specific value for one categorical variable and a specific value for another categorical variable. Percent’s in the middle of the table (not on the outsides) out of the whole.
What is Conditional Relative Frequency?
Gives the percent/proportion of individuals that have a specific value for one categorical variable among individuals who share the same value of another categorical variable. Percent’s down a column/row
What is a Side-by-side Bar Graph?
Displays the distribution of two categorical variables. The bars are grouped together based on the values of one of the categorical variables and placed side by side. Just a split up segmented bar graph.
What is a segmented Bar Graph?
Displays the distribution of a categorical variable as segments of a rectangle, with the area of each segment proportional to the percent of individuals the corresponding category.
When comparing groups of different sizes, be sure to use ________ when analyzing categorical data.
relative frequencies (percentages)
What does association mean?
There is an association between two variables if knowing the value of one variables helps predict the value of another variable. If this is not the case, then there is no association between two variables.
Remember that all tables and graphs MUST have…
LABELS, KEYS, maybe titles.
What is a variable?
An attribute that can take different values for different individuals.
What is a categorical variable?
Assigns labels that place each individuals into a particular group.
What is a quantitative variable?
Takes number values that are quantities-counts or measurements.
What is distribution?
Tells us what values the variable takes and how often it takes those values.
EX: The distribution of the amount of carpets and the amount of cats someone has is roughly symmetric with a mean of 20 and a standard deviation of 3. The distribution varies from 10-50 with 1 unusual outlier at the 50 mark.
What is a discrete variable?
A quantitative variable that takes a fixed set of possible values without gaps between them. (EX: result of a rolling dice)
What is a continuous variable?
A quantitative variable that can take any value in an interval on the number line. (EX: Age, height, weight).
What is a dotplot?
Shows each data value as a dot above its location on a number line.
When describing a distribution what do key points do you say?
Shape: ROUGHLY/SLIGHTY Symmetric, skewed right/left, PEAKS (Bimodal, Unimodal, Multimodal)
Center: What is the middle of the distribution?
Variability: Goes from what to what? EX: Range is 80 units/varies from 110-190
Outliers: Are there any unusual features (suspected outlier)?
A histogram displays the distribution of a _______
quantitative variable.
What does Resistance mean?
A statistical measure is resistant if it is not sensitive to extreme values. The measure resists extreme values.
What is used for skewed distributions? Symmetric?
Mean is used for symmetric while median is used for skewed.
Standard deviation is used to measure variability about the _
mean
When finding the center of a skewed-right/left distribution you should always use…
median
In a skewed right distribution ____ and ____ go together
In a symmetric distribution ____ and __ go together
Median and IQR
Mean and Standard Deviation