All Models and Theories presented in the AP Human Geography course, with definitions and matching.
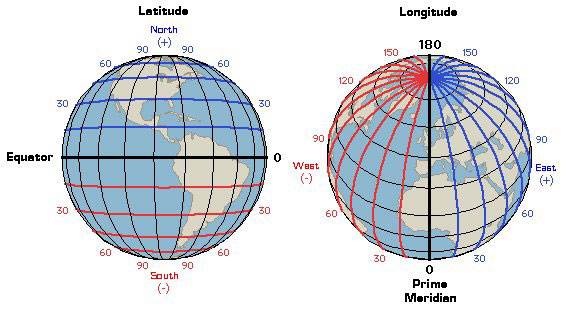
Latitude
The horizontal lines on a map or globe that measure north and south.
Longitude
The vertical lines on a map or globe that measures west and east.
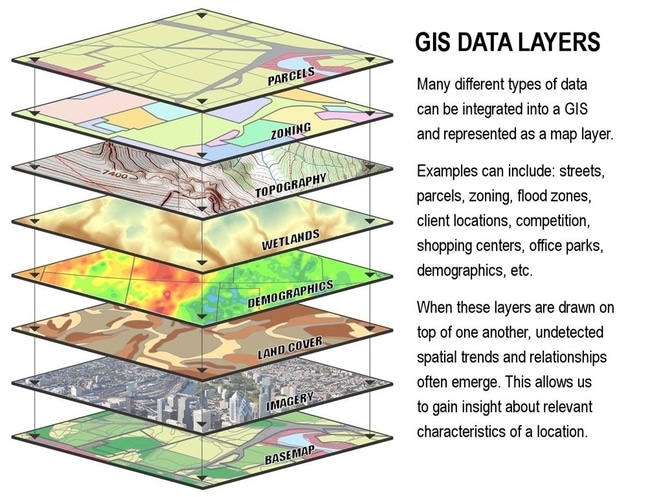
Geographic Information System (GIS)
A technological tool used by geographers to analyze data on maps using layers.
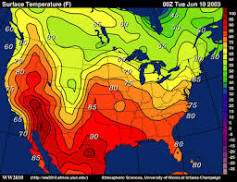
Isoline Map
A map showing lines of equal value of a given variable, such as temperature or elevation. These lines connect points with the same value and form a continuous surface that represents the distribution of the variable.
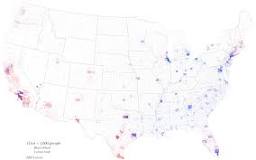
Dot Map
A map in which each dot represents a specific quantity or value, usually related to a geographic location. Dot maps are useful for showing patterns or distributions of data across a region, and are often used in demographic or statistical analysis.
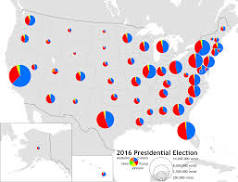
Proportional Circle/Symbol Map
Flashcard for Proportional Circle/Symbol Map:
A thematic map that uses circles or symbols to represent data. The size of the circle or symbol corresponds to the value of the data being displayed. It is commonly used to show population, income, or other quantitative data by geographic area.
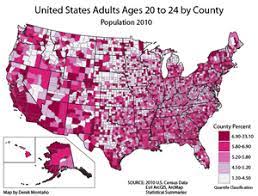
Choropleth Map
A type of map that shows data through shading or coloring of predefined areas, such as countries or states, based on numerical values or categories.
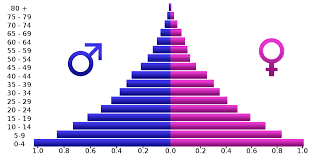
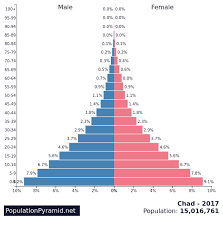
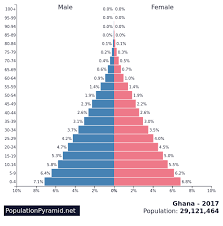
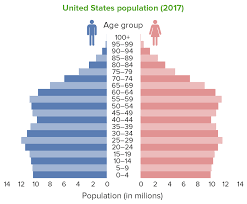
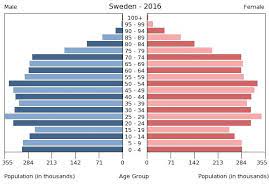
Population Pyramids
A graph that is used to analyze the demographic makeup of a country or population based on age and gender.
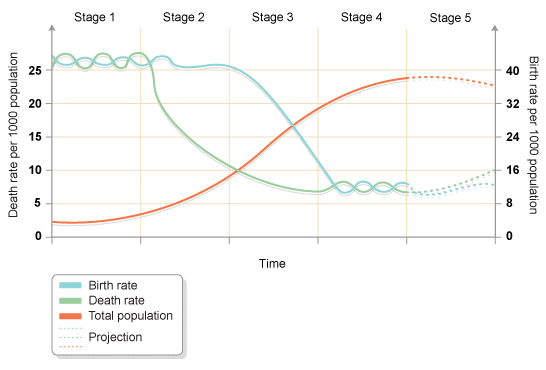
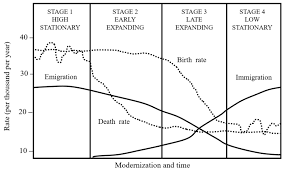
Demographic Transition Model
The visual theory that all states transition through five stages that are based on markers including birth rate, death rate, and natural increase of population.
Stage One of Demographic Transition
High birth rates and high death rates, resulting in a low population growth rate. This stage is typically associated with pre-industrial societies where infant mortality rates are high and life expectancy is low.
Stage Two of Demographic Transition
Characterized by high birth rates and declining death rates due to improvements in healthcare and sanitation. This leads to rapid population growth and a young population age structure.
Stage Three of Demographic Transition
In this stage, birth rates decline due to increased access to contraception, women's education, and urbanization. Death rates continue to decline, leading to a higher population growth rate. This stage is characterized by a shift towards smaller family sizes and an aging population.
Stage Four of Demographic Transition
This stage of demographic transition is characterized by low birth rates and low death rates. It often indicates a stable population, with a higher proportion of elderly individuals. This can lead to a decrease in workforce and economic growth, as well as increased pressure on healthcare and social security systems.
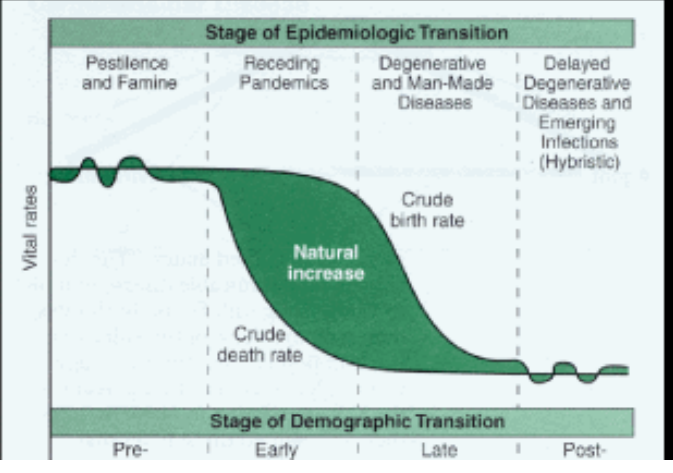
Epidemiologic Transition Model
A visual graph that depicts different diseases that affect the population according to their stage on the Demographic Transition Model. It depicts living conditions, health care access, and life expectancy.
Stage One of Epidemiologic Transition
Characterized by high birth and death rates, with most people living in rural areas and relying on subsistence agriculture. Infectious diseases are the leading cause of death, and life expectancy is low.
Stage Two of Epidemiologic Transition
High population growth rate, high birth rates and declining death rate, infectious diseases remain a major cause of death, and improved sanitation and nutrition leads to longer life expectancy. Example: Industrial Revolution-era Europe and North America.
Stage Three of Epidemiologic Transition
Characterized by a decrease in infectious diseases and an increase in chronic diseases. This is due to improvements in healthcare, sanitation, and nutrition. Examples of chronic diseases include cancer, heart disease, and diabetes.
Stage Four of Epidemiologic Transition
A stage of epidemiologic transition characterized by a low birth rate, low death rate, and an increase in chronic diseases and degenerative disorders.
Stage Five of Epidemiologic Transition
This stage is characterized by a high level of chronic and degenerative diseases as well as an increasing level of infectious diseases due to globalization.
Ravenstein’s Law of Migrations
This law states that most migrants travel short distances, and that there is a trend of urbanization and migration from rural to urban areas. It also suggests that migration is driven by economic factors and that migrants tend to be young adults.
Zelinsky Model of Migration Transition
A model that explains the patterns of migration in a country as it undergoes economic and social development. It suggests that migration patterns change from high mobility in earlier stages to low mobility in later stages of development.
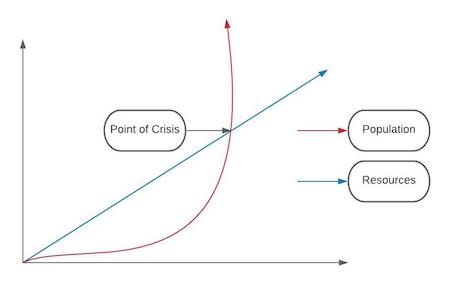
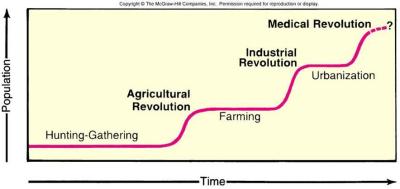
Malthusian Theory of Population Growth
Theory by Thomas Malthus that population growth is exponential and will always grow, but agricultural production is linear. At some point the population will not be able to be sustained by agriculture and will cause a period of disease and death before the population levels out again.
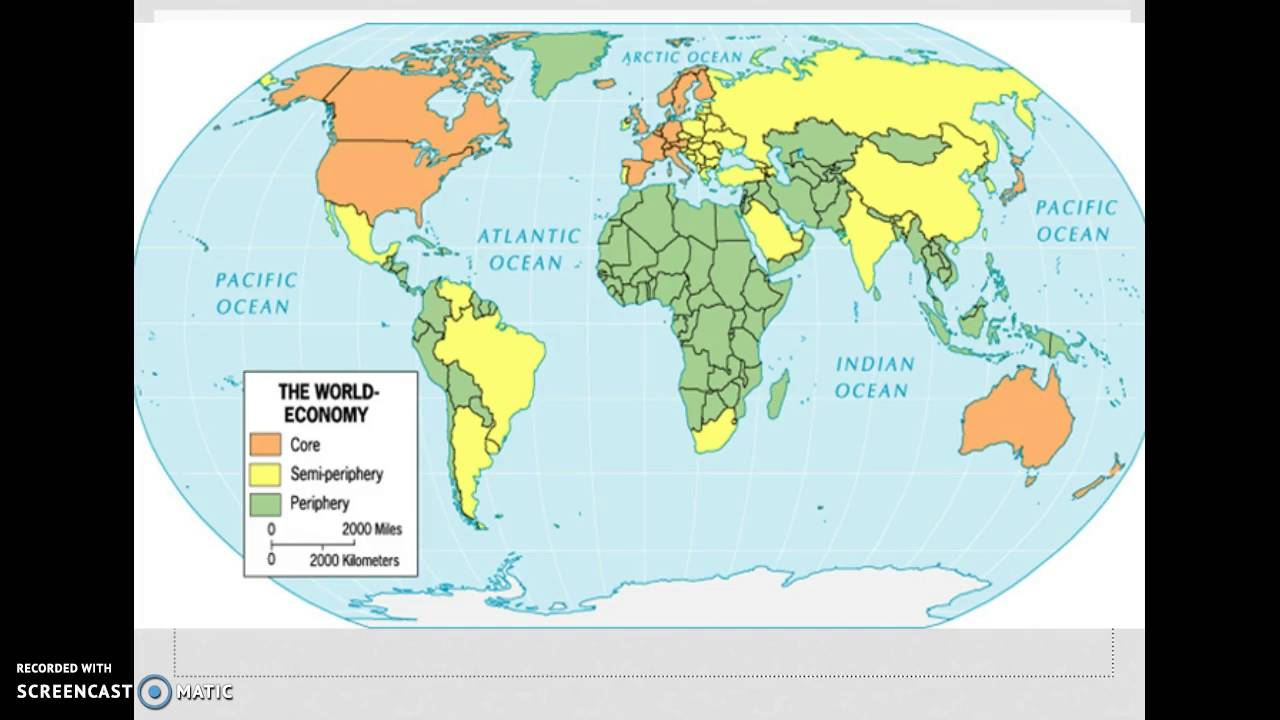
Core-Periphery Model
Type of model that describes how economic power is unequally distributed between developed, wealthy "core" regions and less developed, poorer "periphery" regions. The core exploits the periphery for resources and labor, leading to a cycle of underdevelopment.
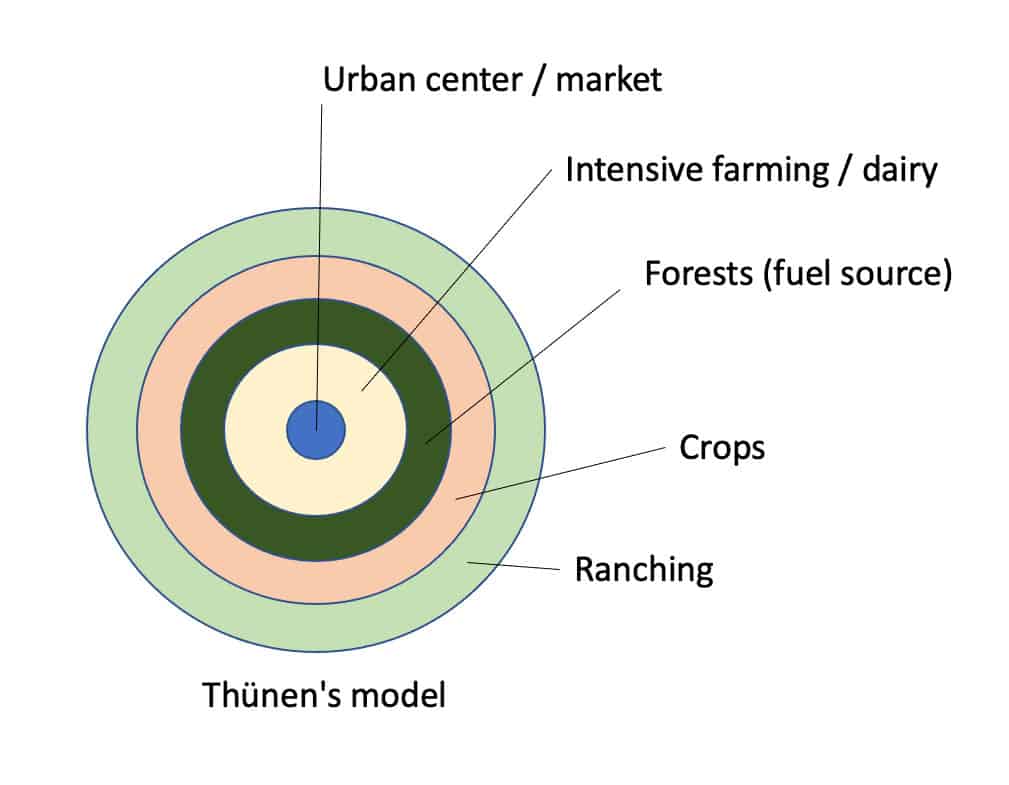
Von Thunen Model
A model that explains the spatial distribution of agricultural activities based on transportation costs and land values. It assumes a central market and a flat, uniform plain. Different agricultural activities are located in concentric rings around the market, with the most intensive and perishable crops located closest to it.
Ester Boserup’s Theory
A revision to the Malthusian theory that describes food production as an industry that increases in conjunction to population growth because of innovation, such as the Agricultural Revolution and the Industrial Revolution.
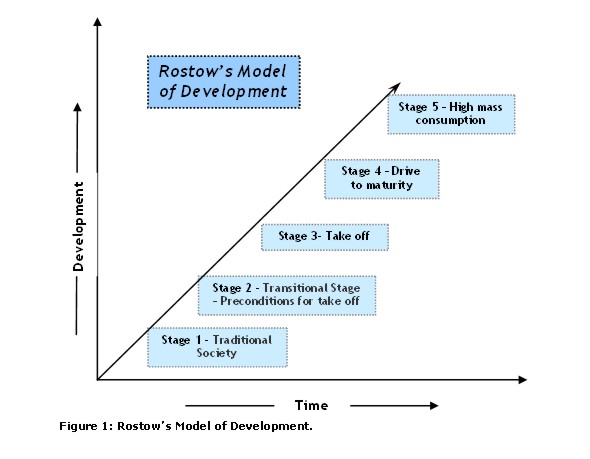
Rostow’s Stages of Growth
A model of economic development in five stages that depicts a traditional society, preconditions for takeoff, takeoff, drive to maturity, and high mass consumption. However, it assumes all countries can follow the same path and is criticized for being Eurocentric and not accounting for external factors.
Stage One of Rostow’s Stages
Land- traditional economy
Stage Two of Rostow’s Stages
preconditions for takeoff
Stage Three of Rostow’s Stages
Takeoff
Stage Four of Rostow’s Stages
Drive to maturity
Stage Five of Rostow’s Stages
Maturity
Wallerstein’s World Systems Theory
The theory that the relationship between core and periphery countries is related to industrial development, with cor countries selling high-profit goods to semi- and peripheral countries, and semi- and peripheral countries selling cheap labor and raw materials to produce the goods that go to core countries.
Dependency Theory
The theory that core countries depend on the periphery for labor and raw materials while the periphery depends on the core for goods. The relationship between countries is often in place due to previous colonial ties.
Weber’s Least Cost Theory
Industries will either locate near the source of their resources or near the market area of their product depending on their provided service. This is due to an attempt to lessen the amount of transportation cost.
Christaller’s Central Place Theory
An explanation of the size and spacing of cities. Goods and services are located within a “range” (how far are people willing to travel for the provided service) and “threshold” (how many people are needed to support the industry) distance of the urban center.
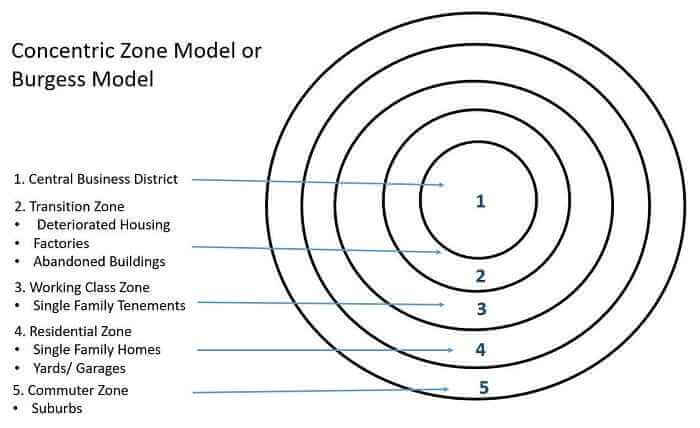
Burgess’ Concentric Zone Model
A description of the layout of an American city where people live, with the CBD in the center and concentric rings expanding outward from it. CBD, industrial centers, and residential areas with lower-class people closer to the center and upper-class people located farther away.
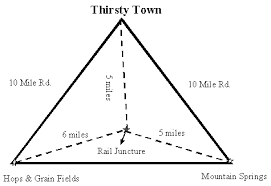
The Gravity Model
The movement of people between two places is based on factors of population size and distance. Big cities are likely to attract commuters from a large radius, but the farther away from the city you get, the more people will be attracted to other cities.
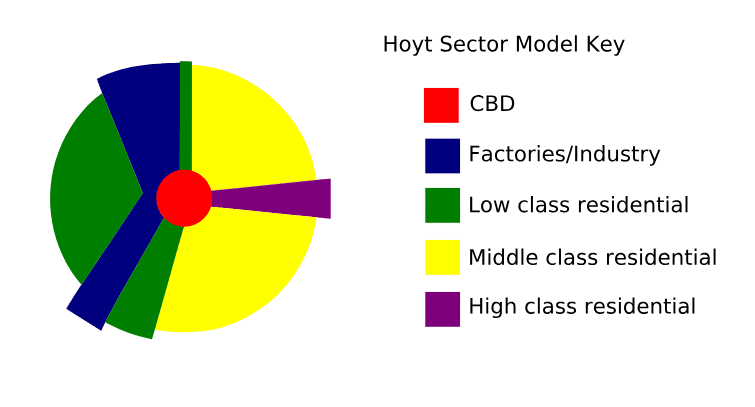
Hoyt’s Sector Model
An American city layout with the CBD and major transportation in the center, and wedges of other sectors spreading out from there.
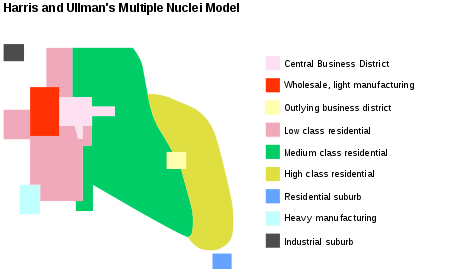
Harris & Ullman’s Multiple Nuclei Model
An American city layout in which the city formed around a CBD, but other, smaller, business districts have sprouted up along the outskirts of the city and created multiple “nuclei” of business activity.
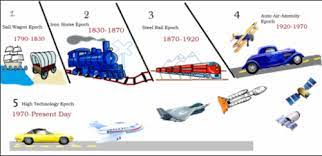
Borchert’s Transportation Theory / Evolution of the American Urban Systems
A model that depicts the epochs of American urbanization through innovations of transportation, beginning with Sail/Wagon and ending in Automotive/Air.
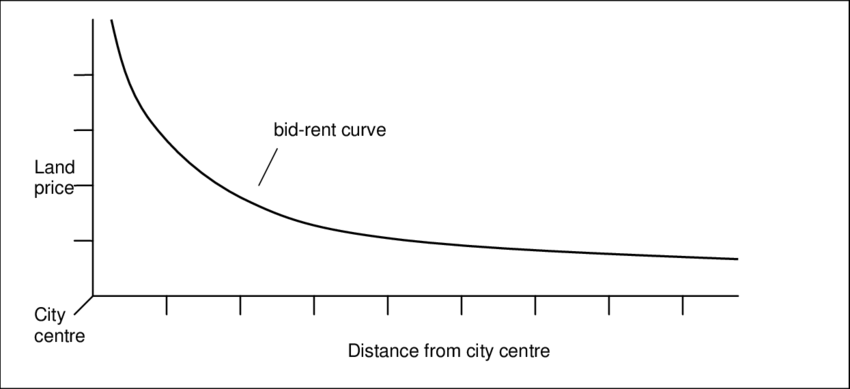
Bid-Rent Theory
The closer you are to a city, the more expensive land is.
OR
The farther you are from a city, the less expensive land is.
Demographic Transition Model
Epidemiologic Transition Model
Zelinsky Model of Migration Transition
Malthusian Theory of Population Growth
Core-Periphery Model
Von Thunen Model
Ester Boserup’s Theory
Rostow’s Stages of Growth
Wallerstein’s World Systems Theory
Weber’s Least Cost Theory
Christaller’s Central Place Theory
Burgess’ Concentric Zone Model
Hoyt’s Sector Model
Harris & Ullman’s Multiple Nuclei Model
Borchert’s Transportation Theory
Bid-Rent Theory