Arithmetic (crude) density
The total number of people per unit area of land
provides average density with no information about distribution patterns
Physiological density
The total number of people per unit of arable land
helps understand the capacity of land to support the population
Ties to carrying capacity
Arable land
Land that can be used to grow crops
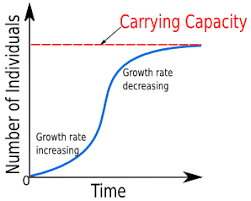
Carrying capacity
The number of people that a region can support without environmental degradation
Agricultural density
The total number of farmers per unit of arable land
reveals information about the amount of subsistence agriculture
Gives insights to country’s wealth
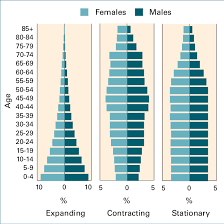
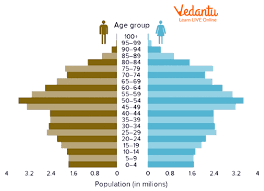
Population (Age-sex) pyramid
Shows age and gender distribution within a country
typical shapes include: expansive/growing, stationary/stable, and constrictive/declining
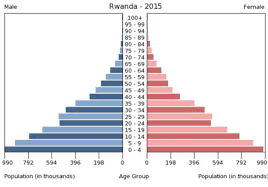
Expansive population pyramid
Population pyramid when the population is consistently expanding
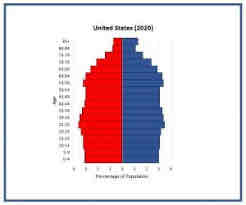
Stationary population pyramid
Population pyramid where the population is not increasing or decreasing by a significant rate
Constrictive population pyramid
population pyramid where there are significantly more elders than there are people being born (and is shrinking or soon to shrink)
Dependency ratio
The number of people in a dependent age group divided by the number of people in the working age group time 100
top of population pyramid plus bottom of the population pyramid
Crude birth rate (CBR)
The number of births in a given year per 1,000 people in a given population
Total fertility rate (TFR)
The average number of children one woman in a given country or region will have during her childbearing years
Crude death rate (CDR)
The number of deaths in a given population per year per 1,000 people
Causes of high CDR
Unclean water, poor health care, elderly population, natural disaster, disease, war, etc
Infant mortality rate (IMR)
The number of deaths of children under the age of 1 per 1,000 live births
often considered a better indicator of health/healthcare than CDR
Life expectancy (longevity rate)
The average number of years a person is expected to live
Replacement fertility
The level of fertility at which a population exactly replaces itself from one generation to the next
TFR = 2.1 in developed countries
Zero population growth (ZPR)
A condition of demographic balance where the number of people in a specified population neither grows or declines
the number of births plus in-migrants equals the number of deaths plus out-migrants
Doubling time
The amount of time it takes for the population to double
number is based on the annual increase in population as a percentage of the original population
Rate of natural increase
The difference between the number of live births and the number of deaths occurring in a year
can be used to calculate growth
Demographic balancing equation
future population = current population + (births-deaths) + (immigration-emigration)
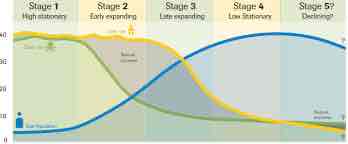
Demographic Transition Model (DTM)
How the crude birth rate and crude death rate as well as the rate of natural increase changes over time as countries go through industrialization and urbanization
Stage one of the DTM (high stationary)
Stabilized population, high birth and death rates
Stage two of the DTM (early expanding)
Population explosion, high birth rate, decreasing death rate
Stage 3 of the DTM (late expanding)
Decreasing growth, rapidly declining birth rate
Stage four of DTM (low stationary)
Low birth and death rates, low growth population
Stage five DTM (declining)
Death rates outpacing birth rates, declining total population
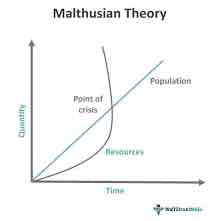
Malthusian Theory
The theory that the world population would exceed the carrying capacity and result in mass starvation
Cornucopian theory
States that as the population grows so will agriculture outputs, resulting in:
increased economic growth
Improved quality of life
Increased innovation
Greater social and economic equality
Environmental conservation
Sustainability
The practice of using natural resources responsibly, so they can support both present and future generations
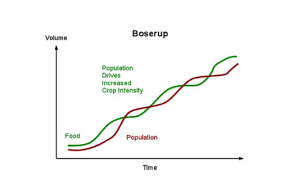
Boserup theory
Maintains that population growth is the cause of rather than the result of agricultural change and that the principal change is the intensification of land use
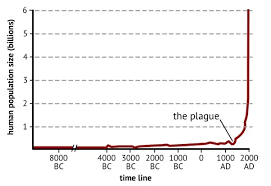
J-curve
When the projection population show exponential growth
S-curve
Traces cyclical movements upwards and downwards in a graph
Anti-natalist
Policies intend to discourage population growth
eg. China’s one child policy
Pro-natalist
Policies intended to encourage population growth
migration
A permanent move
Reasons for immigration
Improved economical, social, political, and environmental situations
Emigrant
Someone leaving their country
Immigrant
Someone arriving in a new country
Lee’s model of migration
Based on the idea that people move from areas where push factors outnumber pull factors to areas where the opposite is true
push factors
Negative aspects of an area
Pull factors
Positive aspects of an area
Intervening opportunity
A feature that causes a migrant to choose a destination other than his original one
Intervening obstacles
An object that interferes with how human
Ravenstein’s Law of Migration
majority of migrants don’t move far from their homes
Migration proceeds in steps - as one leaves, another enters
Migrants who choose to move far go to cities with more opportunities for jobs
Every migration generates a counter migration or return
People from rural areas are more likely to migrate than people from urban areas
Young adults are more likely than families to migrate internationally
The majority of migrants are adults
Cities tend to grow by migration and not by natural increase rate
Men are more likely to travel long distances
Those men are more likely to travel by themselves and not with their families
Most people migrate for better economic activities
Voluntary migration
People make the choice to move to a new place
Forced migration
People are compelled to move
Eg. Transatlantic slave trade
Transnational migration
People migrating to a different country
Internal migration
People who migrate within a country
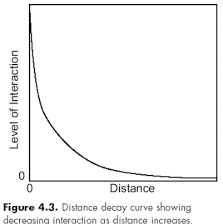
Distance decay model
Describes how the strength of a relationship between people, places, or systems decreases as the separation between them increase
Migration stream
The total number of moves made during a given migration interval that have a common area of origin and a common area of destination
Migration corridor
The hypothetical connection between two places, through which people may or may not migrate
Guest workers
Temporary laborers in another country
may engage in circular migration
Often sends remittances to their families
Refugees
People who are forced to leave their country for fear of persecution or death
have the right to request asylum or protection in another country
Internally displaced persons
People who have fled their homes but remain within the borders of their country
generally move because of political or environmental causes
Human trafficking
People taken through abduction, fraud, or coercion
often illegally sold
Remittances
Money earned by an emigrant abroad sent back to the home country
Chain migration
A situation in which migrants from a particular place follow other migrants to a particular location
Urban ethnic enclaves
a high concentration of an ethnic group within a geographic space
Diaspora
Involuntary mass dispersions of a population from its home territories
The Atlantic slave trade
During the 16th-19th centuries millions of Western and Central Africans were captured and sent to the Americas
Chinese diaspora
1850s-1950s when large numbers of Chinese workers left China in search of jobs in Southeast Asia
1950s-1980s wars, starvation, etc. caused the destination of Chinese diaspora to more industrialized areas (North America, Europe, Japan, Australia, etc.)
Mexican diaspora
After the Mexican Revolution of 1910, many Mexicans migrated to the US looking for economic opportunities and political stability
Step migration
Gradual migration from farm to village to town to big city
Circular migration
The temporary and usually repetitive movement of a migrant worker between home and host areas, typically for the purpose of employment
Naturalization
Legal process of becoming a citizen