Types of sampling techniques
Census
Random Sample
Simple Random Sample (SRS)
Cluster Random Sample
Stratified Random Sample
Systematic Random Sample
Multistage Sample
Convenience Sample
Census
collects data from all individuals in a population
best way to measure median household income
very hard to do
the US only attempts to pull it off once every 10 years :0
Random Sample
Easier than census
Should be representative of the general population if done well
tends to provide unbiased estimates
easy to explain
can be easy to perform or not
may not be as precise as other methods
Simple Random Sample (SRS)
Every group of a given size (“n”) has an equal chance of being chosen/of selection
1) Number all blank from blank to blank
2) random number generator to select #’s between blank and blank, without replacement (no repeats)
Samples are representative but it is very difficult to collect this data
ex: List of all students at my school
Random sample vs. SRS
In a random sample: each member of the entire population has an equal chance of being selected.
In a Simple Random Sample: a group of size n is selected and every possible group has the same chance of being selected.
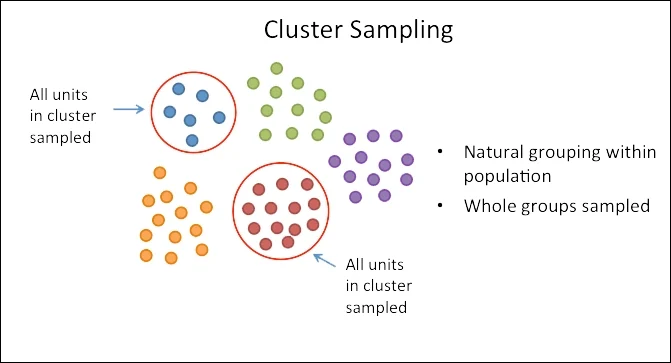
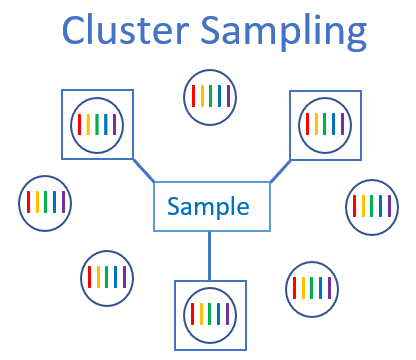
Cluster Random Sample
Population is divided into clusters of individuals that are near one another
SRS of clusters is taken
All individuals within each cluster are sampled (entire groups)
Much easier to collect sample data than with census or SRS
There has to be difference BETWEEN the groups
Heterogenous subgroup → sample all
Sampling is effective when clusters are heterogeneous and similar to one another
Unbiased, high variability
Bad if clusters are homogenous but are very different between clusters because that would lead to high variability and may get statisticians an estimate that is very far from the “truth” aka the true mean
ex: Randomly pick a cafeteria at school and ask everyone (aka all individuals are sampled!) there your question
this would be heterogenous because there are all different grade levels in one lunchroom
the clusters would be North A,B,C, South A,B,C cafeterias
then label them 1-6 and randomly select from those #’s
Stratified Random Sample
Population is divided into strata based on a similar characteristic (homogeneous grouping)
SRS within each stratum is taken
Selected individuals are combined into a larger sample and then the median is found of this group
It is very difficult to collect this data/implement, even more so than with SRS
unbiased and low variability
ex: homogenous within regions, each possible sample has a similar mix of inomes
ex: Split the school by grade and randomly select 50 students from within each group
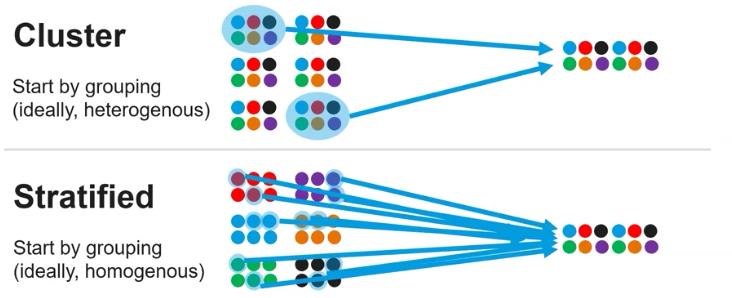
Cluster v. Stratified (just to really cement this in your head)
Cluster
Heterogeneous grouping
SRS of groups
Sample all individuals aka entire groups
Stratified
Homogeneous grouping
SRS within each group
Sample selected individuals from each strata into one larger group
think:
cluster those bad guys (the bad guys movie because all the bad guys are dif animals but work together as a team so they are sampled as a team ;))
stratified: think ecology, all those same trees together but median found separately as they are all their own but same at the same time.
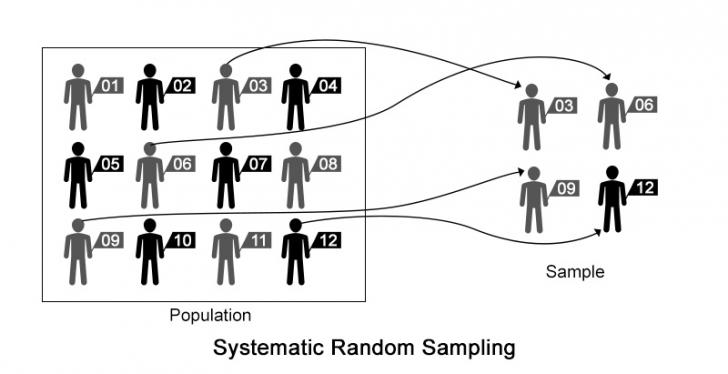
Systematic Random Sample
Randomly choose a start point, then sample at a fixed periodic interval
It is easy to collect the sample especially if the individuals in the population are “lined up”
ex: assign people numbers 1-20 and then every 20th person is sampled afterwards
to remember:
Start at a randomly selected point, Yield samples at fixed intervals, and Stick to this system until you're done
yass 3rd syster
ex: Pick every 20th person in the list of students at my school
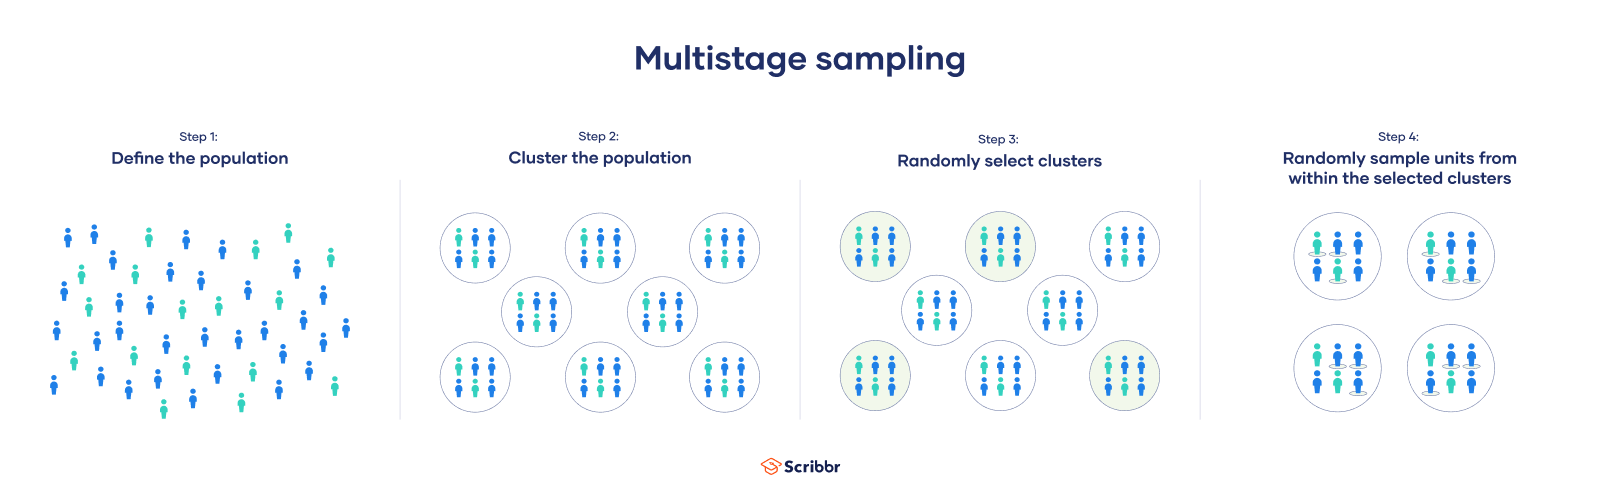
Multistage Sample
Combination of multiple sampling methods
you draw a sample from a population using smaller and smaller groups at each stage
used when the population is very large
commonly
startified → systematic
clustered → systematic
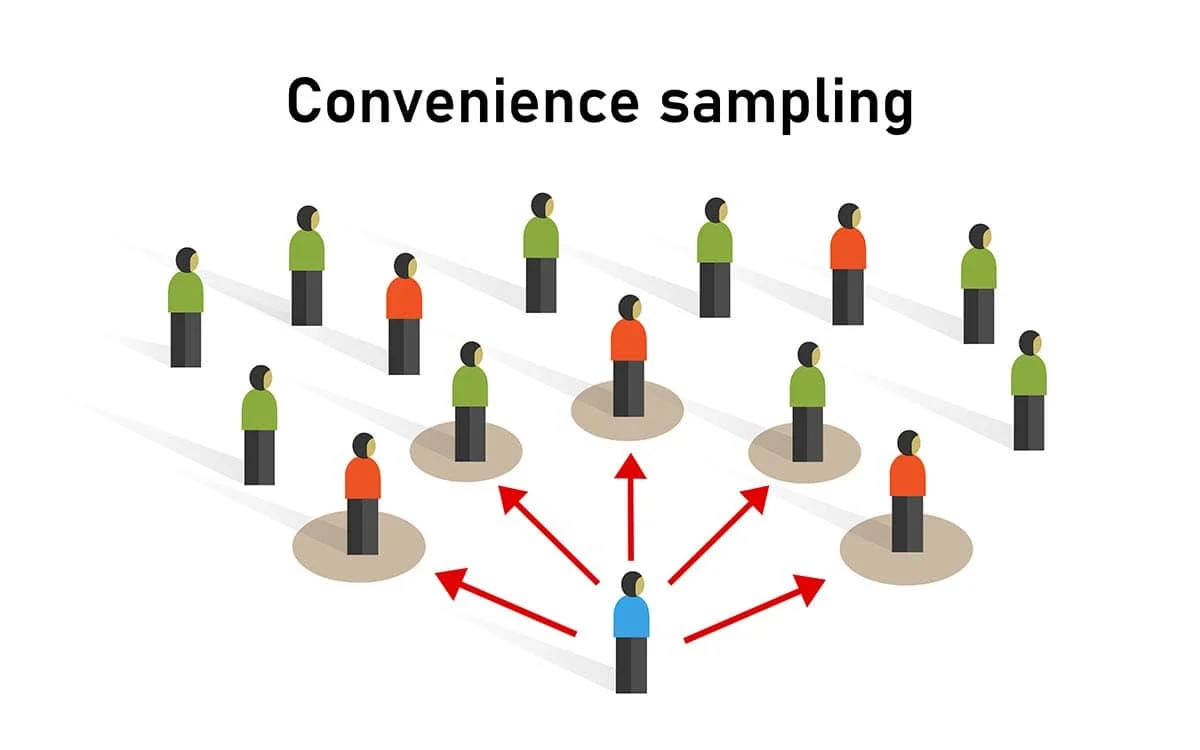
Convenience Sample
Those sampled are those conveniently available
Often fails to be representative of the population
can result in biased results
for ease of the researchers
Bias
Accuracy
are you centered at the true value (ex: the median) you want to be estimating?
A systematic tendency to favor certain responses over other
Something researchers ant to get rid of
It is deliberately or accidentally introduced to samples when we use bad surveys or experiments
Bias is bad, error is normal
unbiased(low bias)=accurate
biased (high bias)=inaccurate
Variability/variation
Precision
How much distance is there between the different estimates you may have gotten?
Low variation/variability=precise
High variation/variability = imprecise
is this error? if so..
Error comes from randomness, it is an expected change/deviation from the mean that can be measured
Bias is bad, error is normal
#goals
Unbiased and low variatation/variability
Types of bias
Undercoverage
Non response
Voluntary response
Response
Undercoverage bias
When part of the population has a reduced chance of being included in a sample
ex: landline survey, younger people don’t use landline phones so they have a reduced chance of being included in the sample and more old people will be sampled which will lead to an overestimate of the age of the population
Non response bias
When individuals chosen for a sample don’t respond
Leads to bias if these individuals differ from the respondents
ex: Homework email, all students have a chance to respond but they refuse to respond because they don’t want their teachers to know they didnt do their homework
Hot tip: When writing about bias in an FRQ quiz or test,,,
Identify the population and the sample and describe the bias
Explain how the sampled individuals might differ from the general population aka what is wrong with the survey, how this bias arises
ONLY talk about bias, not error (aka sampling variability)
(ex: why people did not respond to the survey)
Explain how this will lead to an overestimate or underestimate of the population
ex: What is wrong with this survey?
Do you think the Mayor will over or underestimate the true mean age of people in Springfield? Why?
Voluntary Response Bias
When an invitation is sent to all individuals in a population to participate.
Those who choose to participate (volunteers) may differ from individuals who do not choose to participate
ex: voluntary would be filling out a survey afterschool in main office, only those with strong positive or negative views will respond to the survey and actually go to the main office
Response bias
How the question is worded or who asks the question
Anything in a surgery design that influences responses
ex: boy scouts, the boyscout is wearing his unfirom so of course someone wont say they hate boyscouts
Types of response bias
Question Wording Bias
Self-reported response bias
Question Wording Bias
When survey questions are confusing or leading
Self-reported response bias
When individuals inaccurately report their own traits
ex: I can deadlift 10000 pounds
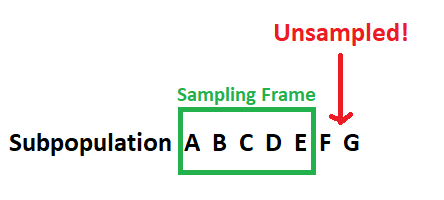
Sampling frame
List of individuals from whom the sample is drawn
note that: those in the population of interest but not in the sampling frame cannot be included in the sample
Sample
Piece of a population
Has statistics
Have both error and bias
Never take more than 10% of the population as a sample
as long as your sample is representative of the population you do not need to sample more.
If you go above 10% of the population there is a greater chance of the sample having similar opinions and the same ideas
ex: Sample size (ex: 100 students at my school) is NOT connected to the population size (every student at my school
Population
Have parameters but
although we rarely talk about them because they are from censuses which we know are extremely hard to conduct
Stratified Sampling can…
show how stratified sampling can reduce the variability in the response variable (which in this case is the proportion of students in the sample who like the mandatory pep rallies) compared to a simple random sample.