The ligands in signal transduction pathways may be hydrophobic or hydrophilic.
(a) Describe where in a cell the receptors for hydrophilic ligands and the receptors for hydrophobic ligands are located.
(b) Explain why hydrophobic ligands can cross the cell membrane unassisted.
(c) A mutation in the gene for adenylyl cyclase renders the enzyme ineffective. Predict the effect this would have on the cell.
(d) Justify your prediction from part (c).
(a) Receptors for hydrophilic ligands are found on the cell membrane. Receptors for hydrophobic ligands are found in the cytosol.
(b) The cell membrane is made of a phospholipid bilayer. Hydrophobic ligands can slide between the hydrophobic phospholipids of the bilayer and enter the cell.
(c) A mutation in the enzyme adenylyl cyclase (that rendered if ineffective) would result in a cell that could not make the secondary messenger cyclic AMP. This would disrupt any cell signaling process that contains a step that requires cyclic AMP.
(d) Adenylyl cyclase catalyzes the conversion of ATP into cAMP, so an ineffective adenylyl cyclase would result in no cAMP production.
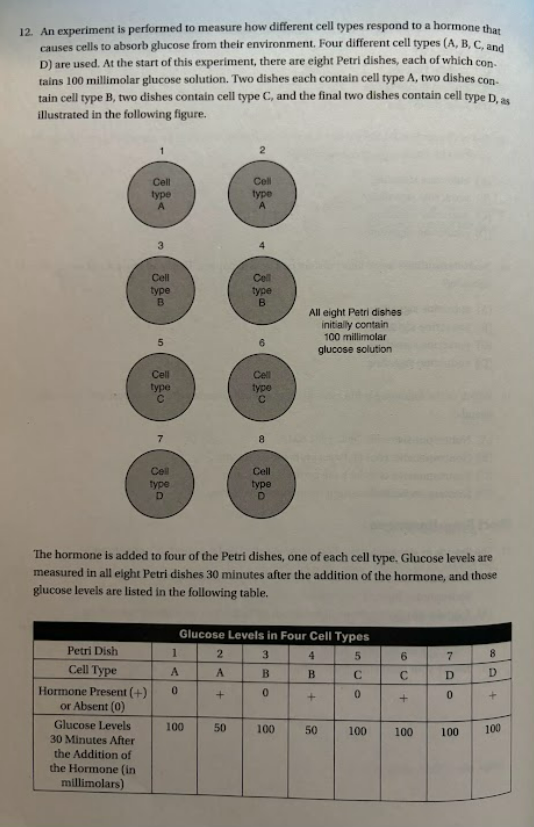
(a) Describe the most likely reason why cell types C and D did not respond to the presence of the hormone.
(b) Identify the function of Petri dishes 1, 3, 5, and 7 in the experimental procedure.
(c) A molecule is added to Petri dish 4 before the hormone is added. This molecule irreversibly binds to this hormone, preventing the hormone from binding to any receptor. The hormone is then added to Petri dish 4. Predict the effect this molecule will have on the glucose concentration in Petri dish 4 at 30 minutes after the addition of the hormone.
(d) Justify you predictions from part (c).
(a) Cell types C and D did not respond to the presence of the hormone because they most likely did not have the receptor for the hormone.
(b) Petri dishes 1, 3, 5, and 7 are the experimental controls for each of the four cell types in the experiment.
(c) If a molecule that irreversibly binds to this hormone was added to Petri dish 4 before the hormone was added, the level of glucose in the Petri dish would most likely remain unchanged after 30 minutes.
(d) The irreversible binding of the molecule to the hormone would prevent the hormone from binding to its receptor in the cell. Without the binding of the hormone/ligand, the signal to absorb glucose from the Petri dish would not occur, and the glucose level in the Petri dish would remain unchanged.
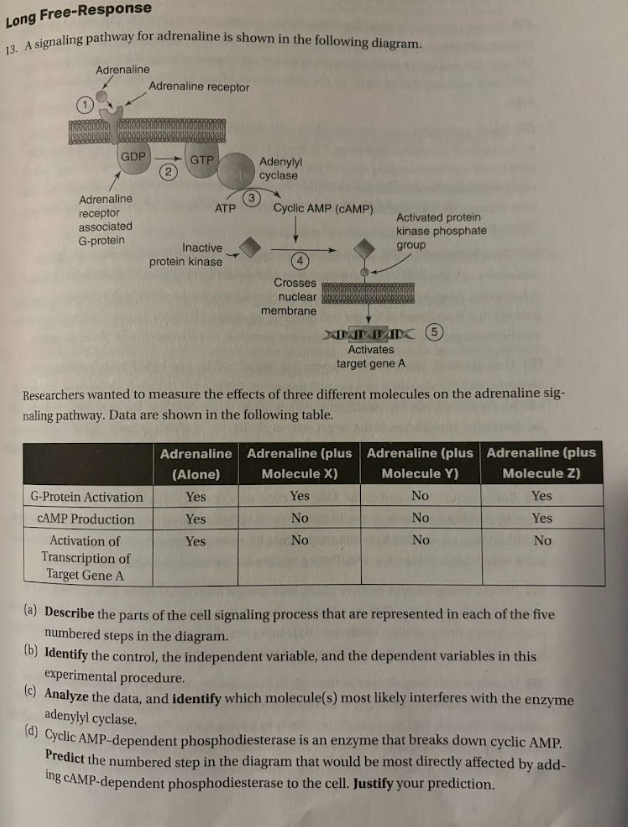
(a) Describe the parts of the cell signaling process that are represented in each of the five numbered steps in the diagram.
(b) Identify the control, the independent variable, and the dependent variables in this experimental procedure.
(c) Analyze the data, and identify which molecule(s) most likely interferes with the enzyme adenylyl cyclase.
(d) Cyclic AMP-dependent phosphodiesterase is an enzyme that breaks down cyclic AMP. Predict the numbered step in the diagram that would be most directly affected by adding aAMP-dependent phosphodiesterase to the cell. Justify your prediction.
(a) Step 1 represents reception of the signal. Steps 2, 3, and 4 represent transduction, Step 5 represents the response.
(b) The control is the cell in which adrenaline alone has been added. The independent variable is the presence or the absence of molecules X, Y, or Z. The dependent variable are the activation of the G-protein, the production of cAMP, and the activation of transcription of target gene A.
(c) Molecule X and molecule Y most likely interfere with adenylyl cyclase because no cAMP was produced when those molecules were added to the cells. Molecule Y also most likely interferes with the GDP on the G-protein receptor since it was never activated.
(d) If cAMP-dependent phosphodiesterase was added to the cell, the conversion of the inactive protein kinase to activated protein kinase (step 4) would most likely be affected since that step is dependent on the presence of cAMP.
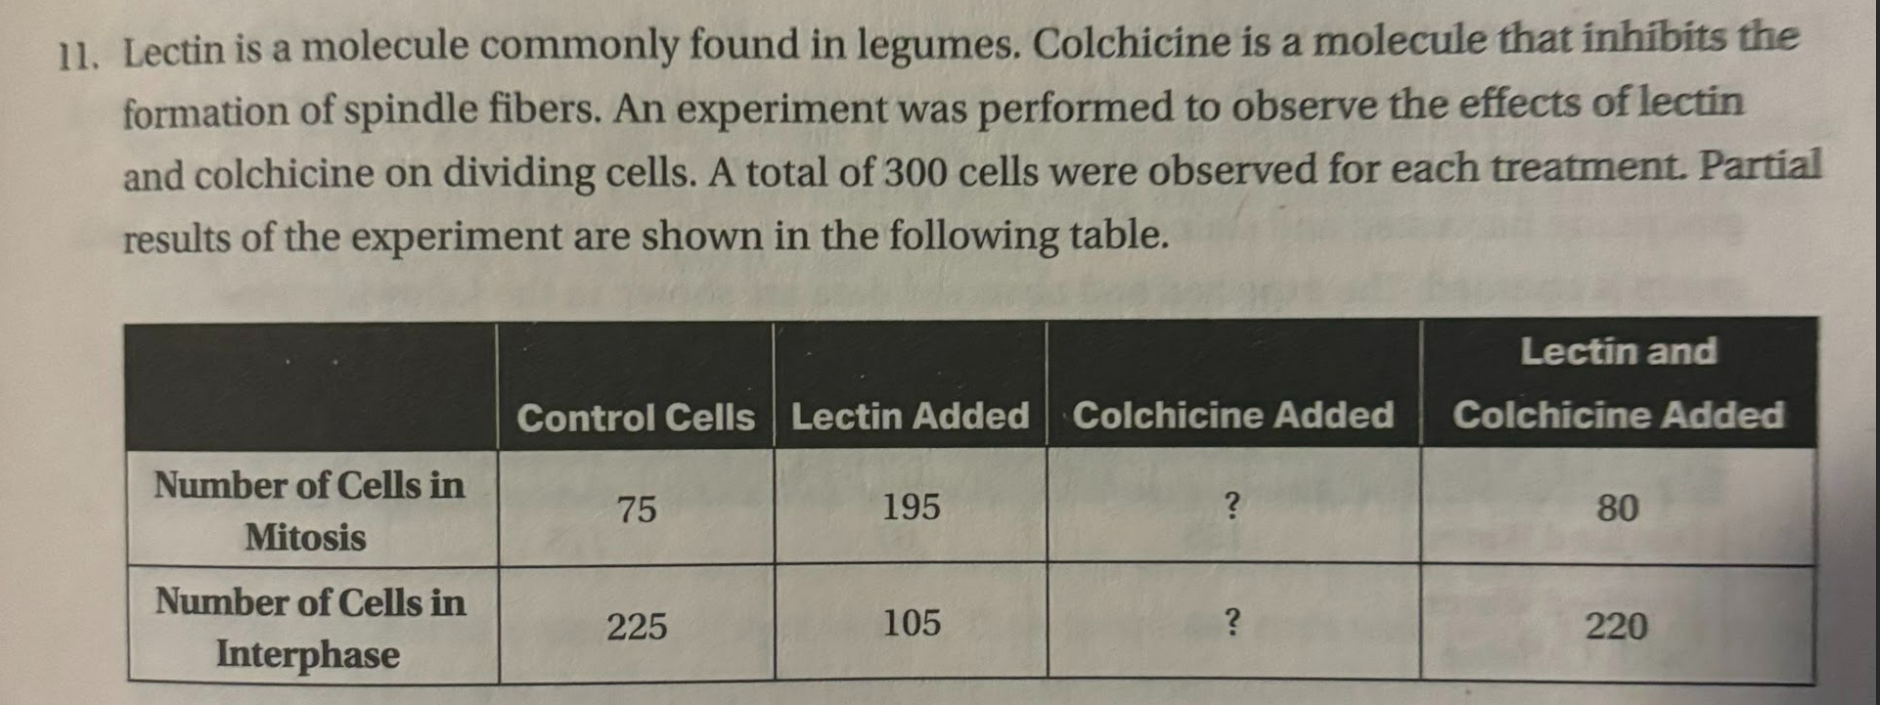
(a) Describe the effect of adding lectin to the cells.
(b) Identify the independent variable and the dependent variable in this experiment.
(c) Based on the data presented, predict the most likely effects of adding only colchicine to the cells.
(d) Justify your prediction from part (c).
(a) Lectin stimulates call division, as shown by the increased number of cells in mitosis for the treatment with only lectin added (compared to the number of control cells in mitosis).
(b) The independent variable is the presence or absence of lectin and/or colchicine. The dependent variable is the number of cells in mitosis or interphase .
(c) The most likely effects of adding only colchicine to the cells would be that the number of cells in mitosis would be less than that of the control group and the number of cells in interphase would be more than that of the control group.
(d) The addition of lectin alone increased the number of cells in mitosis (compared to that of the control group). The addition of both lectin and colchicine resulted in a number of cells in mitosis that was much closer to that of the control group than it was to that of the group with only lectin added. So colchicine most likely reduces that number of cells in mitosis, and thus a group with only colchicine added would have even fewer cells in mitosis than the control group had.
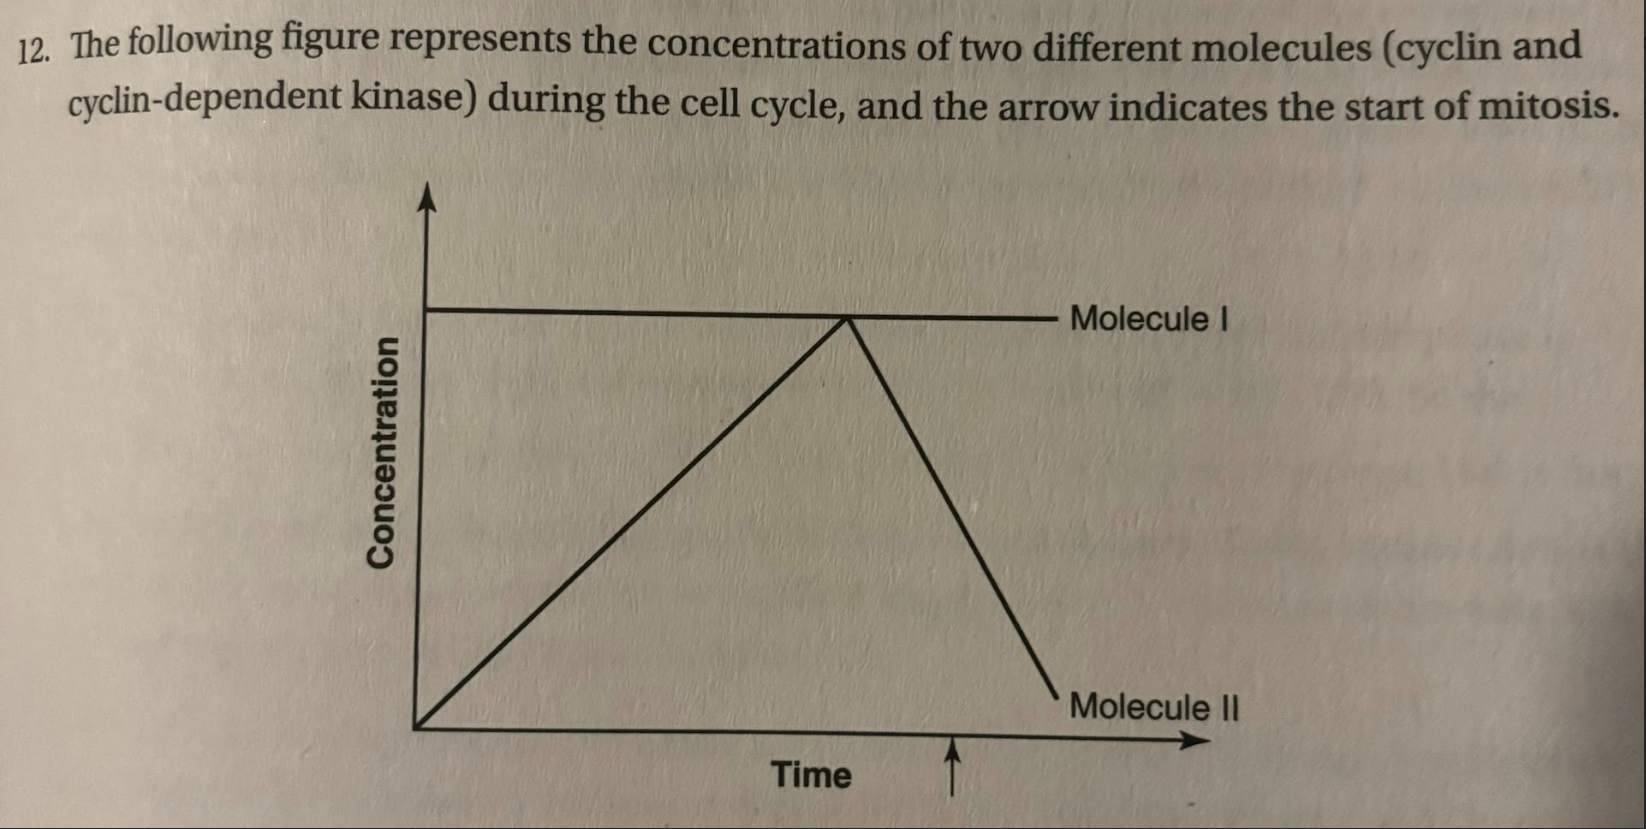
(a) Cell division can be describes as having three major events: replication of chromosomes, alignments of chromosomes, and separation of chromosomes. Describe the stages of the cell cycle during which each of these three major events occurs.
(b) In the figure, which molecule (cyclin or cyclin-dependent kinase) is represented by the line labeled “Molecule I”? Which molecule (cyclin or cyclin-dependent kinase) is represented by the line labeled “Molecule II”?
(c) Explain why mitosis starts at the point indicated by the arrow in the figure.
(d) A cancer cell has a mutation that results in the constant production of Molecule II. Explain how the process of mitosis might be affected by this mutation.
(a) Replication of chromosomes occurs during the S stage of interphase. Alignment of chromosomes occurs during metaphase of mitosis. Separation of chromosomes occurs during anaphase of mitosis.
(b) Molecule I represents the concentration of cyclin-dependent kinases because it is at a constant level throughout the cell cycle. Molecule II represents the concentration of cyclins because its level peaks just before the start of mitosis and then falls off rapidly during mitosis.
(c) Mitosis-promoting factor (MPF) triggers the start of mitosis. Mitosis-promoting factor forms when cyclins bind to cyclin-dependent kinases. The arrow shows the point at which there is enough cyclin to form the MPF needed to trigger the start of mitosis.
(d) If a cancer cell had a mutation that resulted in the constant high production of cyclins (Molecule II), there would be constantly high levels of MPF in the cell. Mitosis would constantly be stimulated, and the cell would divide uncontrollably.
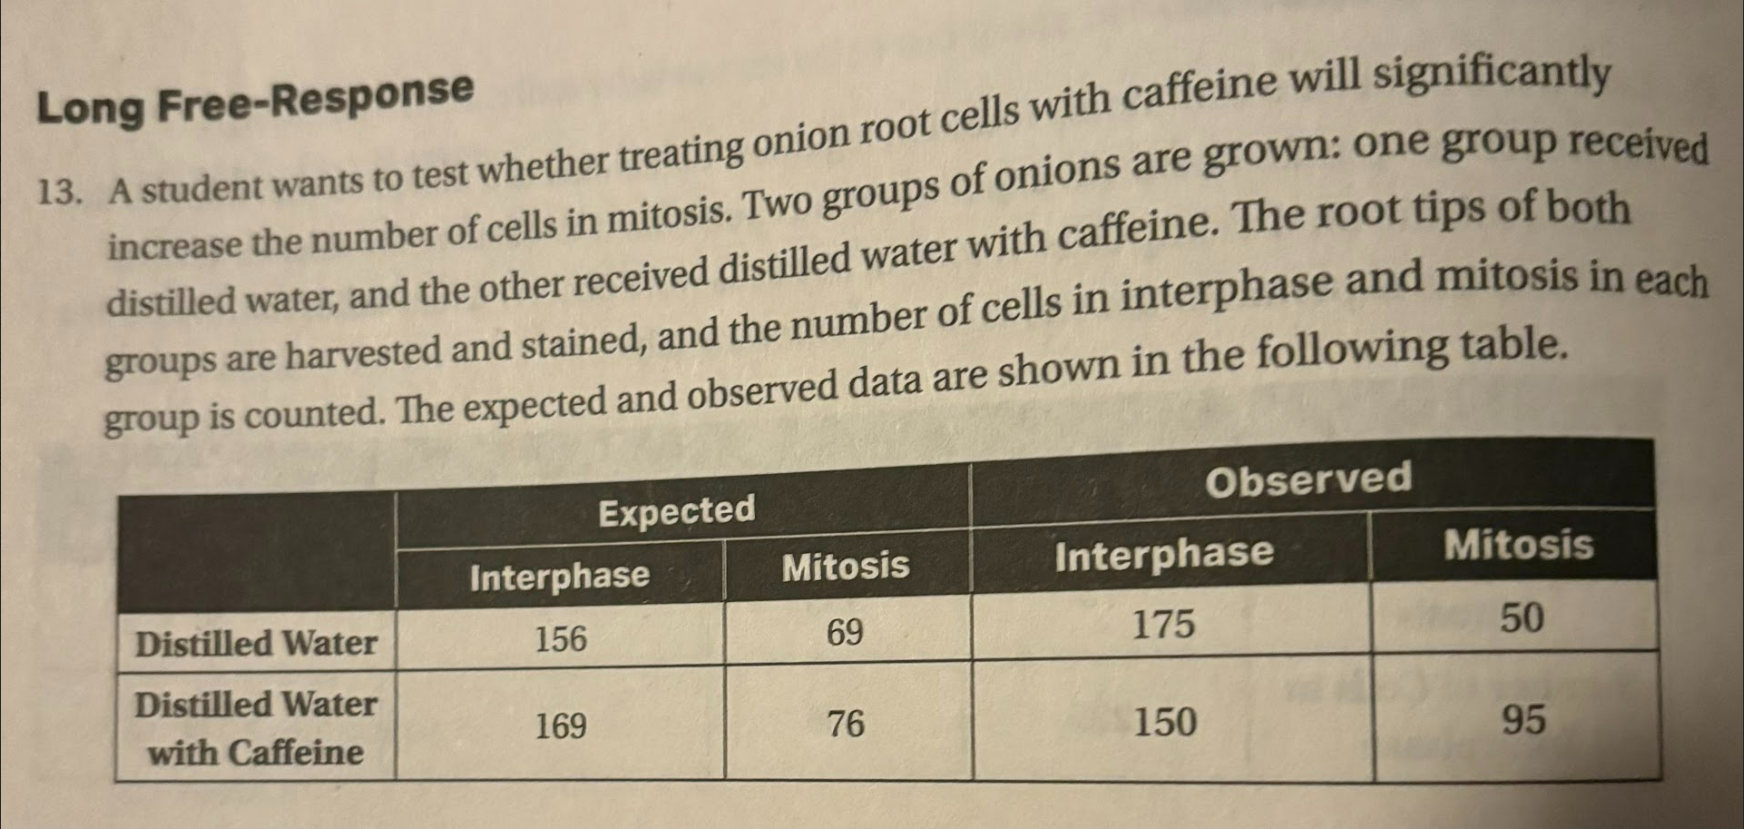
(a) State the null hypothesis for this experiment.
(b) Identify the independent variable and the dependent variable.
(c) Use the chi-square equation and a p-value of 0.05 to analyze the data. Determine if there is a statistically significant difference between the two groups of onions.
(d) Justify your conclusion form part (c).
(a) The null hypothesis is that there is no statistically significant difference between the number of cells in interphase and the number of cells in mitosis in the untreated cells compared to the number of cells in interphase and the number of cells in mitosis in the cells treated with caffeine.
(b) The independent variable is the presence of caffeine. The dependent variable is the number of cells in interphase or mitosis.
(c) Chi-square = x²= ∑(observed-expected)²/expected
Chi-square = (175 - 156)² / 156 + (50 - 69)² / 69 + (150 - 169)² / 169 + (95 - 76)² / 76
Chi-square = 2.314 + 5.232 + 2.136 + 4.750
Chi-square = 14.432
There are four possible outcomes to the experiment, so there are 3 degrees of freedom (df = number of possible outcomes - 1).
Using a p-value of 0.05, the critical value from the chi-square table is 7.81. Based on these calculations, there is likely a statistically significant difference between the two groups of onions.
(d) Since the calculated chi-square value of 14.432 is greater than the critical value of 7.81, the null hypothesis is rejected, and it is possible to say there is likely a statistically significant difference between the treated and untreated groups. The data support the alternative hypothesis that the addition of caffeine increases the miotic rate in onion root cells.