Looks like no one added any tags here yet for you.
Random (simple random)
everyone has an equal chance of being selected
Systematic Random Sample
selected at interval (every nth person)
Sampling w/o replacement
can only be selected once
Stratified Sample Steps
divide the population into homogeneous groups (age, gender, race)
do an SRS from each group
combine into one sample
Cluster Sample Steps
divide the population into heterogeneous groups (homeroom)
do an SRS of all the clusters
survey the clusters selected
multi-stage
draw a sample from a smaller group (10 states, 5 counties per state)
convenience bias
made up of people easy to reach
judgement bias
only choose experts or supporters
size bias
choosing a smaller group to represent a bigger group
response bias
results from survey problems (survey in wrong language)
voluntary response bias
self-selected volunteers
non-response bias
when people of a certain demographic choose not to participate
incorrect response bias
do not answer truthfully
questionnaire bias
question phrasing influences response
block design
the arranging of experimental units into groups(blocks) that are similar to one another, to control for certain factors
matched pairs randomized block design
subjects arranged in pairs matched on relevant factors
each pair receives both treatments by randomly assigning one treatment to each or each subject could get both treatments
union ( ∪ )
join sets together
list all elements but no repeats
intersection ( ∩ )
what sets have in common
conditional probability
probability of A given B has occured
P(A|B)=P(A∩B) / P(B)
mutually exclusive events
can never occur together, no common outcomes
P(A or B)=P(A)+P(B)
independent events
are not affected by other events
P(A∩B)=P(A)•P(B)
probability of intersection=P(A)•P(B)
mean of random variables
Mx=sum(xi•pi)
standard deviation of random variables
σx=sqrt(Σ(xi-Mi)^2•Pi)
conditions for a binomial setting
binary: success or failure
same probability: every outcome must have the same chance of occurring
independent
trials: number of trials set in advance
parameters of a geometric distribution
binary: success or failure
same probability: every outcome must have the same chance of occurring
independent
trials: number of trials required to obtain first success
Combination (nCr)
order is not important in arranging groups
Central Limit Theorem
If the sample is normal, the sampling distribution will be normal
If n>30, the sampling distribution will be normal
The large counts condition
the sample size should be large enough for the distribution of the sample proportion to be approximately normal
n•p>10 and n•(1-p)>10
Conditions to Check for Proportions
Random
Normal: 10 successes and 10 failures
Independent: n<.10N
Conditions to check for Means
Random
Normal: n>30 or normal sample
Independent: n<.10N
normalcdf(L, U, 0, 1)
used to find area under a curve, proportions
plug in z-score (usually in upper)
invNorm(P, 0, 1)
used to find z scores
plug in proportions or probabilities
invT (P, df)
used to find t scores
plug in proportions
when to use a z-score
used only when standard deviation of a population is known and the sample size is greater than 30
when to use a t-score
used when standard deviation of a population is unknown and the sample size is less than 30
p-value
the probability of a result being extreme or more extreme, assuming the null hypothesis is true.
type I error
rejecting the null when the null is true
probability is the same as the significance level
type II error
failing to reject the null when the alternative is true
probability=1-power
power
probability of rejecting Ho correctly
confidence interval conclusion
we are C% confident that the interval from __ to __ captures the (population parameter).
p>alpha
fail to reject Ho, no convincing evidence for Ha
p<alpha
reject Ho, convincing evidence for Ha
chi square conditions
Random
n<.1N
all expected counts>5
chi square goodness of fit (hypotheses and df)
Ho: the distribution is correct
Ha: at least one of the claimed proportions are incorrect
df=# of categories-1
chi square test for homogeneity (how to id, hypotheses, df)
2 separate samples from 2 unique populations
Ho: no difference in distributions of
Ha: difference in distributions of
df=(# of rows-1)(# of columns-1)
chi square test for association/independence (how to id, hypotheses, df)
1 sample from a single population
Ho: no association between
Ha: association between
df=(# of rows-1)(# of columns-1)
expected count for x2 test of homogeneity and independence
(row total•column total)/table total
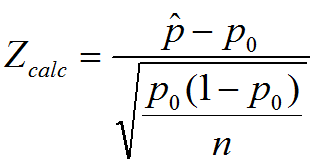
1 sample z test for population proportions
z=p hat minus the null proportion divided by the square root of the null proportion(1-null proportion) divided by n
1 sample t test for population means
t=sample mean minus null mean divided by standard deviation of the sample divided by the square root of n
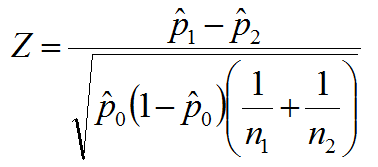
2 sample z test for population proportions
Pc or P0 =(x1+x2)/(n1+n2)
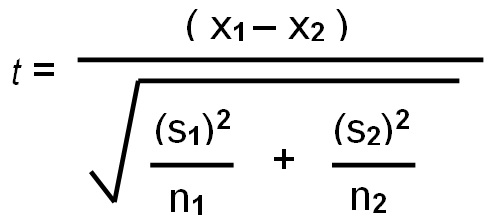
2 sample t test for population means
t=x1 minus x2 divided by the square root of s1 squared divided by n1 plus s2 squared divided by n2
interpreting slope on a least squared regression model
as x increases by 1 unit, it is predicted that the y will change by the slope value
t interval for slope of regression (formula and df)
b (your sample slope)+/- [t*(SEb)]
SE is given
df=n-2
use invT for t*
conditions for slope of a regression line
sample must be linear
random
n<.1N
no skewed or outlying residuals
the standard deviation of y does not vary with x
t test for slope of a regression model
y hat=a+bx
y hat=predicted y value
a=y-intercept
b=slope
Where to find y-intercept when reading a computer output for regression table
Row: Constant
Column: Coef
Where to find slope when reading a computer output for regression table
Row: x variable (under constant)
Column: Coef
Finding r on a computer output model
take the square root of R-Sq
match the +/- sign to the slope
What is S on a computer output model
standard deviation of the residuals
What is SE Coef on a computer output model
standard deviation of the slope
empirical rule
68% of data is within 1 σ
95% of data is within 2 σ
99.7% of data within 3 σ