Looks like no one added any tags here yet for you.
Population
The group of all persons, objects, or things that you want to study; the target audience (ex. Students in the classroom)
Parameter
A numerical characteristic of the population, usually the average. ex. average income, average household, etc (ex. mean number of hours everyone has been awake)
Sample
A small subset of the population that we select to study (ex. group 9)
Statistic
A numerical characteristic of the sample (ex. the mean number of hours group 9 has been awake)
Variable
The numerical value everyone in the population has (ex. age, business income, and expenses)
Data
The list of numbers from those in your sample (ex. amount of money, pulse rate)
Nominal Data
Categorical data that cannot be meaningfully ordered (ex. red, blue, green)
Ordinal Data
Categorical data that can be meaningfully ordered (ex. A+, A, C, F)
Interval Data
Numerical data that has no “true” zero and ratios have no meaning (ex. time, calendars, temperature (excluding Kelvin))
Ratio Data
Numerical data that has a “true” zero and ratios have meaning (ex. height, distance, percentages, age)
Simple Random Sampling
Each member of a population has an equal chance of being selected for the sample
Stratified Sampling
Population is divided into groups first called strata, and take a sample from each
Cluster Sampling
Divide the population into clusters, then randomly select a cluster
Systematic Sampling
Randomly select a starting point, then select every nth member of the population
Convenience Sampling
Using research/results that are readily available, or easiest to obtain
Voluntary Response Sampling
Sample chooses to respond to the survey themselves
Qualitative Data
Data that cannot be counted, measured or easily expressed using numbers
Quantitative Discrete Data
A type of quantitative data that can take only fixed values, always numerical and data that can be counted, but not measured (ex. the number of people in a class or test questions answered correctly)
Quantitative Continuous Data
A type of quantitative data set representing a scale of measurement that can consist of numbers other than whole numbers, like decimals and fractions (ex. height, weight, length, temperature)
Outlier
An observation that is radically different from the rest
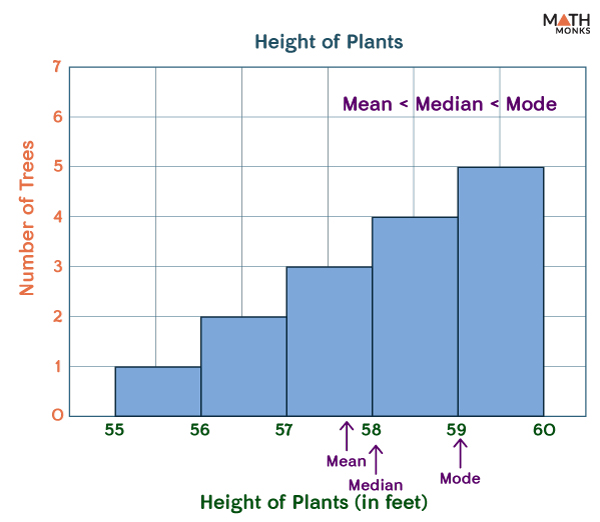
Skewed left
(often) mean < median
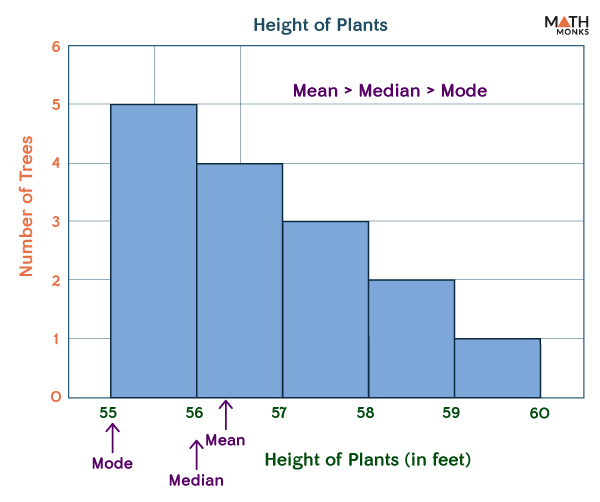
Skewed right
(often) mean > median
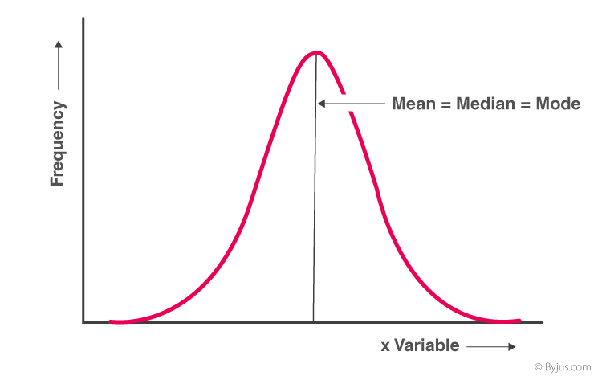
Symmetrical graph
mean = median
Mean
the average of a data set
Median
The middle number in a sorted list of numbers
Mode
The value that appears most frequently in a data set
Population Mean
μ
Sample Mean
x̄
Sample Standard Deviation
s.
Standard Deviation
The measure of the amount of variation of a random variable expected about its mean
Variance
The measurement of the spread between numbers in a data set
Population Variance
σ²
Sample Variance
s²
Z-Score
measures exactly how many standard deviations above or below the mean a data point is