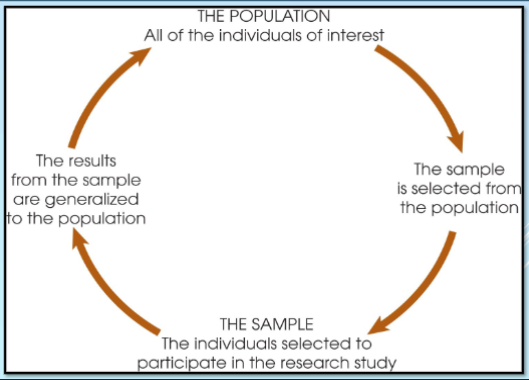
Population
An entire group of individuals
Sample
group of individuals selected to represent the population as usually populations are too large to examine the entire group
Descriptive value for a population
parameter (the p’s go together)
Descriptive value for a sample
statistic (the s’s go together)
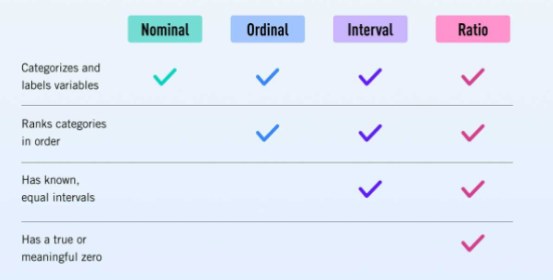
4 major scales of measurement
the scale chosen determines the types of questions that can be answered with the data: nominal, ordinal, interval, and ration
Nominal scale
an unordered set of categories identified by name only
Ordinal scale
an ordered set of categories, tells you the direction of difference between two individuals
Interval scale
an ordered series of equal sized categories, identify the direction and magnitude of a difference, zero point is located arbitrarily
Ratio scale
an interval scale where a value of zero indicates none of the variable, identify the direction and magnitude of differences
Which of the four levels of measurement categories and labels variables
Nominal, ordinal, interval, ratio
Which of the four levels of measurement ranks categories in order
Ordinal, interval, ratio
Which of the four levels of measurement has known equal intervals
Interval, ratio
Which of the four levels of measurement has a true or meaningful zero
Ratio
Goal of correlational studies
determine the strength and direction of the relationship between two variable
Correlational studies
uses observations of the two variables as they exist naturally
Correlation ________ causation
Correlation does not equal causation
Experiments
examine the relationship between 2 (or more) variables by changing one variable and observing the effects on the other variable
Only studies that identify causation
Independent Variable
a condition or event manipulated by experimenter (I decide)
Dependent Variable
an aspect of behavior thought to be affected by the independent variable (Depends on what I decide)
Nonexperimental studies
similar to experiments because they also compare groups of scores, do not use a manipulated variable to differentiate groups, the IV is a pre existing participant variable or a time variable
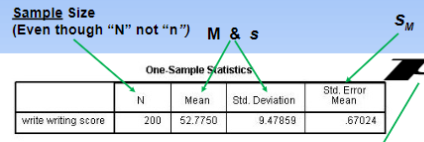
“N” indicates
Number of individuals in a data set for a population
“n” indicates
Number of individuals in a data set for a sample
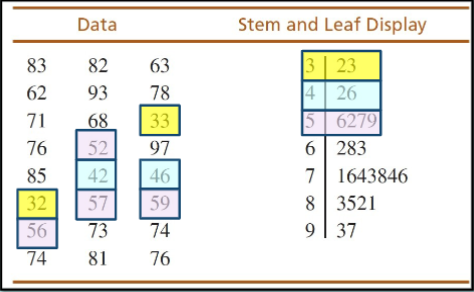
Stem and leaf plot
each score is divided into a stem consisting of the first digit(s) and leaf consisting of the final digit
Go through the list of scores one at a time and write the leaf for each score besides its stem
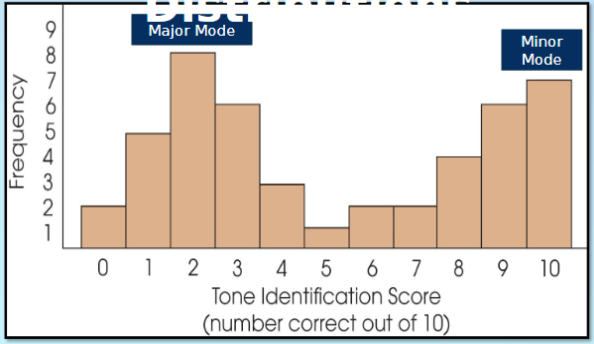
Mode
the most frequently occurring score or class interval in the distribution
Mode can be determined for what scales of measurement
nominal, ordinal, interval, or ratio
How many modes are there
there can be multiple
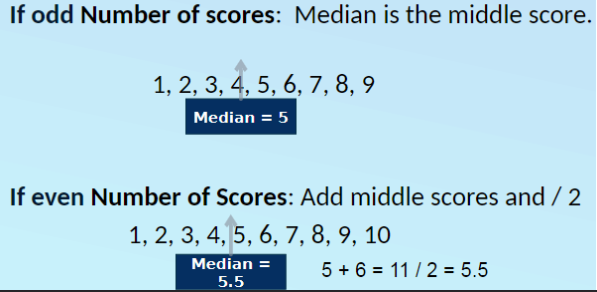
Median
divides the scores so that 50% have values equal to or less than the median; if sores are listed smallest to largest, the median is the midpoint of the list
Median can be determined for what scales of measurement
ordinal, interval, or ratio
Is the median affected by extreme score
no the medians tends to stay in the “center” of the distribution regardless of extreme scores
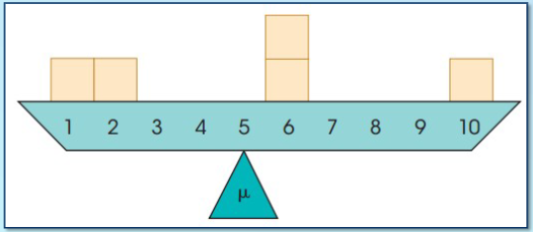
Mean
calculated by computing the sum or total for the entire set of scores and dividing the sum by the number of scores; the balance point of the distribution
Mean can be determined for what scales of measurement
ordinal, interval, or ratio
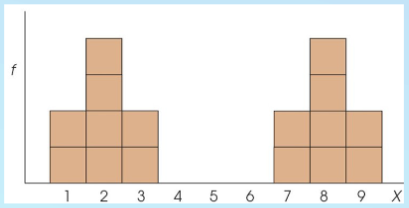
Mean is not representative when a distribution contains
a few extreme scores, or is very skewed; humped distribution and the mean score might actually represent no data value in the distribution
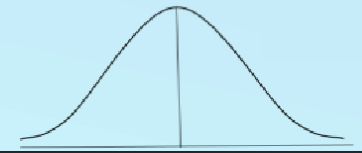
Relationship between measure of central tendency in symmetrical distribution
mean and median will always be equal
Relationship between measure of central tendency in unimodal symmetrical distribution
mean, mode, and median will always be equal
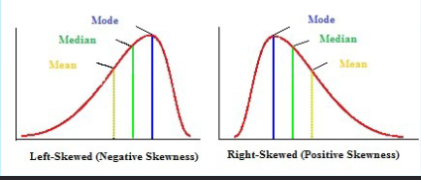
In a skewed distribution the mode
will be located at the peak on one side (closer to the steep slope)
In a skewed distribution the mean
will be displaced toward the tail
In a skewed distribution the median
will be located between the mean and the mode
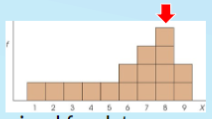
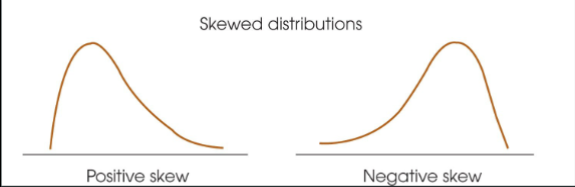
Skewed distribution
scores pile up on one side of the distribution
Positive skew
scores tend to pile up on the left side of the distribution with the tail pointing right.
Negative skew
scores tend to pile up on the right side with the tail pointing left
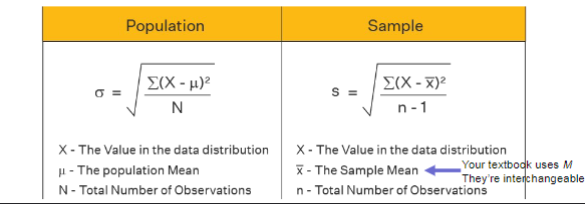
Simga (σ)
standard deviation for a population
S
standard deviation for a sample
Sum of square
the sum of the squared deviation values (value minus mean)
Variance
“average” the squared deviations from the mean
How to calculate variance
Determine each scores deviation (dist from mean)
Square the deviations
Sum them, and average the squared deviations
For population divide by N, for sample divide by n-1
Standard deviation
square root of the variance
What is the most common measure of variation?
Standard deviation
The does the standard deviation approximate?
The average distance between each data point and the mean of a dataset
the dispersion or variability of the data
Difference in standard deviation for sample vs population
the sum of squares is divided by df (n-1) instead of just the total number of observations (N)
Df
degrees of freedom (n-1); accounts for the fact that sample variance will typically underestimate population variance
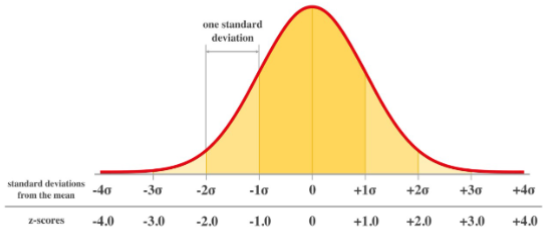
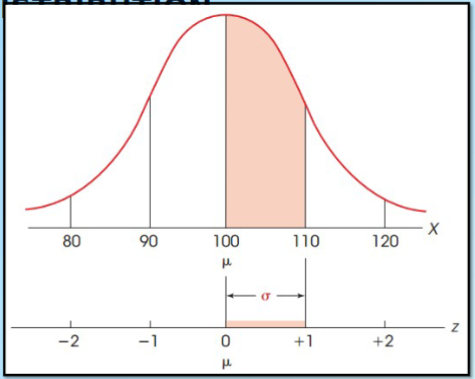
Z score
tell us how far away the point is from the mean as a proportion of standard deviation
Positive z score
value is above the mean
Negative z score
value is below the mean
Z score of 0
is the mean
Advantage of comparison using z scores
can compare distributions with different scales
Probability
The likelihood of an event occurring
Probability (p) equation
= specified outcome / total outcomes
A deck of 52 cards contains 12 royalty cards. If you randomly select a card from the deck, what is the probability of obtaining a royalty card?
(Express in proportion, decimal, percentage)
12:52 or 3:13
0.23
23.08%
Role of Probability
Used to calculate the likelihood of obtaining a specific sample from a given population
If the probability of getting a specific the sample is low, we can say that the sample probably came from some other population
Random Sampling
A statistical technique used to select a subset of individuals or items from a larger population
each member of the population has an equal chance of being chose
ensures that the sample is representative of the population and reduces bias.
Requirements of random sampling
Every individual has an equal chance of being chosen
Ensuring unbiased representation and increases the generalizability of the findings
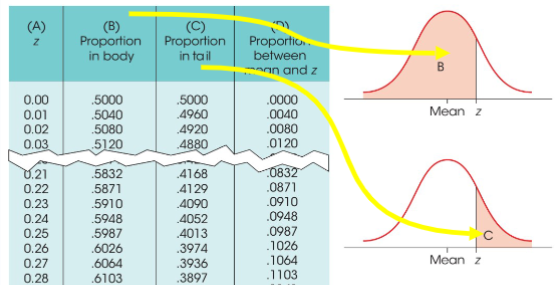
How to find probability given a normal distribution
Draw a vertical line at the data point
The line divides the distribution into 2 sections: the body and the tail
The exact location of the line can be specified by a z-score
Look at z-score table to see the proportion in body and tail.
To find probability corresponding to an X
First, transform the score into a z-score
Then look up the z-score in the table and read across the row to find the appropriate probability
To find the x corresponding to a proportion
First, look up the proportion in the table and read across the row to find the appropriate z-score
Then transform the z-score into a x-value
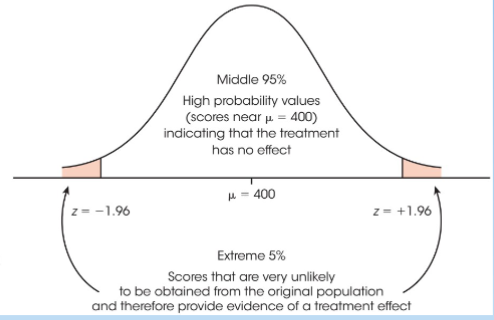
Critical value of z for a two-tailed significance test with α = .05
-+1.96
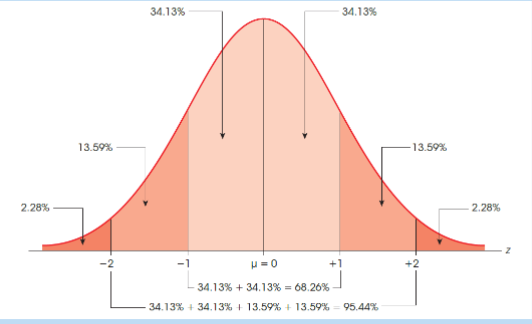
Normal distribution
A probability distribution that is symmetric and bell-shaped. It is characterized by its mean (μ) and standard deviation (σ).
The majority of the data falls near the mean, with fewer data points further away from the mean.
The shape of the distribution is determined by the mean and standard deviation.
The area under the curve represents the probability of observing a particular value or range of values.
Sampling Error
The difference between a sample statistic and the true population parameter it represents.
It occurs due to the inherent variability in the process of selecting a sample from a larger population.
Quantified using measures such as margin of error or standard error.
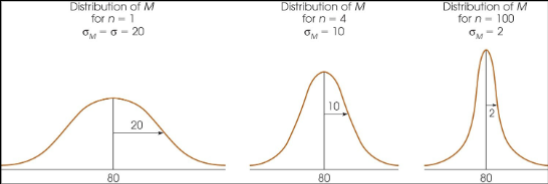
Understand how n and sigma effect the distribution
The bigger the sigma the wider the distribution
The expected value of the sample means is always
the population mean
Central limit theorem
The shape of the distribution of sample means is typically normal
Distribution of sample means approaches a normal distribution as n approaches infinity
the larger the sample size the _ the variability
the larger the sample size the Smaller the variability
It is guaranteed for a distribution to be almost perfectly normal if either:
the population the samples are obtained from is normal
the sample size is n=30 or more
Null hypothesis
The observed findings are due to random chance (there does not appear to be a real effect)
Predicts that the independent variable had no effect on the dependent variable
Alternative hypothesis
The observed findings cannot be explained by sampling error (there does appear to be a real effect)
Predicts that the independent variable did have an effect on the dependent variable
When do we reject the null hypothesis?
If the test statistic results are in the critical region, we conclude the difference is significant (an effect exists)
When do we fail to reject the null hypothesis?
If the test statistic is not in the critical region, conclude that the difference is not significant (any difference is just due to chance)
Alpha (α)
Establishes a criterion, or "cut-off", for deciding if the null hypothesis is correct.
Typically α = .05 (rarely α = .10 or α = .01)
How does alpha effect the likelihood of rejecting the null
The smaller the alpha level the less likely to reject the null (smaller critical region)
The larger the alpha level the more likely to reject the null (larger critical region)
Type I Error
Occur when the sample data indicate an effect when no effect actually exists.
Rejecting the null hypothesis when the null is true.
Caused by unusual, unrepresentative samples, falling in the critical region without any true effect.
Hypothesis tests are structured to make Type I errors unlikely.
Type II Errors
Occur when the hypothesis test does not indicate an effect but in reality an effect does exist.
We fail to reject the null hypothesis even though it was actually false.
More likely with a small treatment effect or poor study design (sample size too small).
p-Values
The probability of obtaining an effect at least as extreme as the one in your sample data, assuming the truth of the null hypothesis
Used when performing hypothesis tests; the statistical significance is checked by seeing if our test scores (ex z-score) indicate a p-value of less than our α
Chance of a Type 1 error if p = .05
Probably about 20-50% depending on context
Assuming the null is true, you’d obtain the observed difference or more in 5% of studies due to random sampling error.
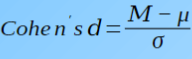
Effect size
Measures of the absolute magnitude of an effect, independent of sample size
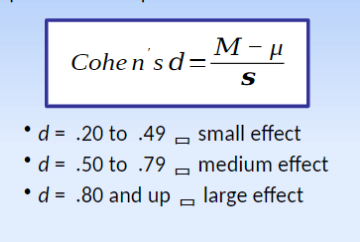
Cohen’s d
Standardized effect size
Like a z-test, measures mean difference in terms of the standard deviation
Why should hypothesis tests be accompanied by effect size?
Because effect size provides a measure of the practical significance of the results.
Hypothesis tests determine if there is a statistically significant difference, and effect size quantifies the magnitude of the difference.
How is effect size influenced by sample size and standard deviation?
Sample Size: Effect size is independent of sample size
Standard Deviation: Effect size is inversely related to the standard deviation
Power of a hypothesis test
The probability that the test will reject the null hypothesis when there is actually an effect
Importance of the power of a hypothesis test
It represents the probability of detecting a true effect or relationship between variables.
A higher power indicates a greater likelihood of correctly rejecting the null hypothesis and avoiding a Type II error (false negative).
A well-powered test increases the confidence in the results and enhances the reliability of scientific conclusions.
4 factors that impacts how hard it is to find effects
effect size (larger effects are easier to find)
sample size (larger samples make it easier to find effects)
alpha level (larger alpha level makes it easier to find effects
non-directional vs directional hypothesis (directional tests make it easier to find effects)
t-value
"estimated z-test.“
Estimated because we are using the sample standard deviation to estimate the unknown population standard deviation.
Why would you use t statistic instead of z test
Allows researchers to use sample data to test hypotheses about the difference between a sample mean and a population mean.
The t statistic does not require knowledge of the population standard deviation (σ)
Can be used for a completely unknown population (both μ and σ are unknown)
All that required is a sample and a reasonable hypothesis about μ
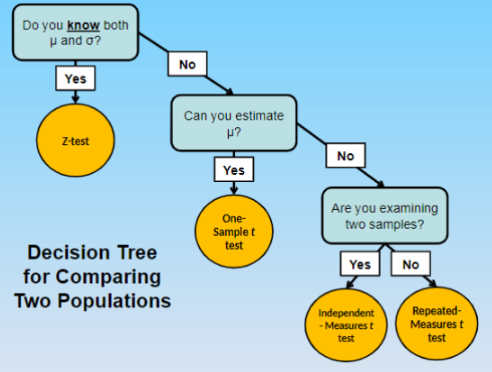
3 types of t-tests
One-sample t-test (when you don’t know μ or σ, but can approximate μ)
Independent Samples or Independent Measures t-test (when you don’t know μ or σ, and cannot approximate μ, and are studying 2 sample)
Dependent Samples or Repeated Measures t-test (when you don’t know μ or σ, and cannot approximate μ, and are studying 1 sample)
Steps of conducting a t-test
The hypothesis test with a t statistic follows the same four-step procedure that was used with z-tests:
State the hypotheses and select a value for α. (Note: The null always states a value for μ.)
Locate the critical region. (Note: You must find the value for df and use the t distribution table.)
Calculate the test statistic.
Make a decision. (Either "reject" or "fail to reject" the null hypothesis.)
How to locate the critical region in t-test
Need to calculate the degrees of freedom
df = n – 1 = 25 – 1 = 24
Then we go to the t distribution table.
Since we are using a non-directional hypothesis the test is two-tailed
Since our alpha level is .05 go to column with .05 in two tails
Go to the row corresponding to our df.
Take note of Critical Region
Effect of sample size on t-test
With large samples, the t value will be very similar to a z-test.
With small samples, however, the t-value will provide a relatively poor estimate of z.
influence of sample variance on t-test
Sample variance affects the t-test by influencing the calculation of the t-statistic
A larger sample variance leads to a larger standard error and a smaller t-statistic, making it less likely to reject the null hypothesis
A smaller sample variance leads to a smaller standard error and a larger t-statistic, making it more likely to reject the null hypothesis.
How to calculate the Cohen’s D for the one-sample t-test
r²
For t-test
Percentage of Variance Accounted for by the IV
Scores differ across individuals for many reasons.
By measuring the amount of variability that can be attributed to the IV, we obtain a new measure of effect size
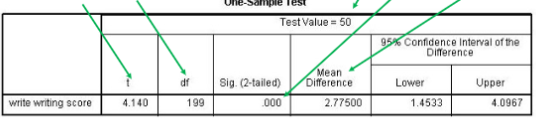
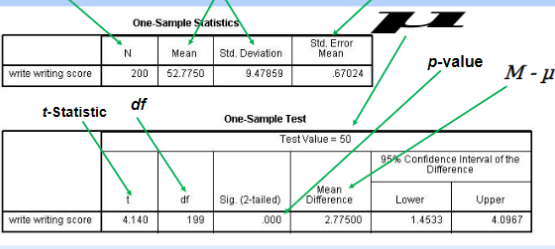
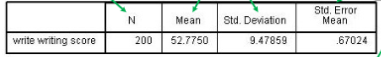
What are the arrows pointing at one-sample t-test?
What are the arrows pointing at one-sample t-test?