
The Market System (ch. 1-4)
The Economic Problem is that all countries have finite resources, yet we have unlimited wants. An economist must decide how to allocate these scarce resources between uses, weighing up the pros and cons of different situations. The three main questions which are asked are:
What to produce?
How to produce?
For whom to produce?
When making these choices, firms and governments will face a cost called opportunity cost. The opportunity cost is a sacrifice made when making a choice. This choice can be graphed on a chart which shows the different combinations of goods an economy can produce if all resources are used up, called the Production Possibility Curve (aka PPC). It is assumed that nations can produce capital goods (those purchased by firms to produce other goods) and consumer goods (those purchased by households with the intention of using them). When a point moves along the PPC, an opportunity cost occurs because you could be producing a different amount of something else and get more of it.
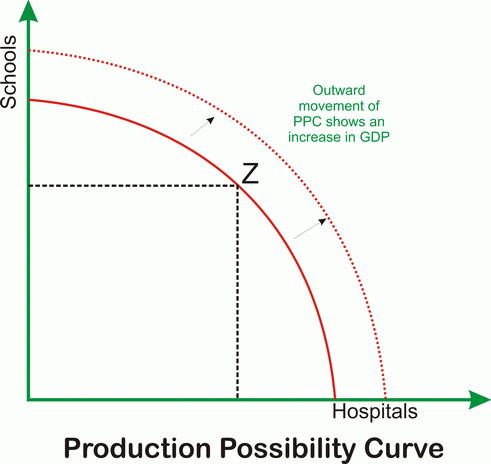
Over time, the PPC shifts outwards. This is called economic growth (an increase in the level of output by a nation). The reasons for economic growth are:
New Technology: new technology is faster and more reliable in production, thus causing more output
Improved Efficiency: new production methods developed, increasing output
Education and Training: economy becomes more productive as the proportion of educated workers increases as they can comprehend tasks faster and increase output
New Resources: some nations may find more resources, so they can produce more, thus increasing output
When the PPC shifts inwards, it means that there is negative economic growth. This could happen for a plethora of reasons:
Resource Depletion: running out of resources, reducing output
Weather: droughts reduce agricultural capacity, reducing output
Emigration: large numbers of highly skilled and qualified workers move overseas, reducing output
Wars and conflict: less production availability as fewer resources, reducing output
There are a few main economic assumptions. These are that:
Consumers aim to maximise benefits
They will buy the cheapest product out of products of the same quality
They will buy the highest quality product out of products at the same price
Businesses aim to maximise their profits
They will buy the cheapest resources out of resources at the same price
They will choose the highest price that the market can stand to maximise revenue and profit
However, in some situations, consumers and producers might not actually maximise their benefits:
Consumers
Difficulty in calculating benefits results in less satisfaction
Consumers may develop habits, such as brand loyalty
Influenced - consumers may be influenced by people such as friends or parents and adopt their buying habits
If consumers do not have access to all of the information, they cannot make balanced choices
Producers
Sales managers may attempt to sell as much as possible individually, thus selling larger quantities and lowering prices, making profits negative
Alternative business objectives such as customer care
Enterprises operating as charities do not always want profits
Social Enterprises want to help the community, not just gain profit
If producers do not have access to all of the information, they cannot make balanced choices
Demand is the amount of a good which is bought at given prices over periods of time. Effective demand is how much would be bought at any given price. Demand can be shown graphically, on the demand curve. This is a line drawn on a graph showing how much of a good will be bought at different prices. Price and quantity demanded have an inverse relationship.
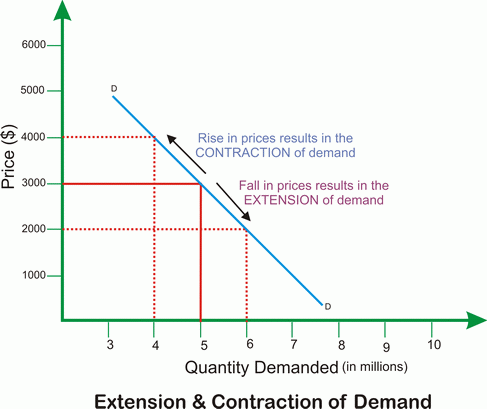
If the price of a good changes, then there is a movement along the demand curve, and if there is a change in other factors (income, etc) then the demand curve will shift. This means that it moves inwards or outwards.
There are some specific factors affecting demand:
Demographic Changes: an example of a demographic change is an ageing population, where there is an increase in demand for retirement homes and holidays for the elderly. Other changes include geographical demographics and ethnic demographics; when these things change, demand for goods increases and falls.
Advertising: firms may attempt to influence demand for their products through advertising and other forms of promotion. Heavy advertising results in a shift outwards
Income: when disposable income rises, demand for goods rises. When income rises, demand for normal goods (goods which you spend more money on when you have access to more money) rises. However, when income rises, demand for inferior goods (goods which are similar to supermarket ‘own goods’ brands) decreases as consumers move on to more expensive options
Fashion and tastes: demand rises for things which are more fashionable and attractive at the time, however, these tastes change over time
Price of substitutes: a substitute good is a good which is bought as an alternative to another for the same function. When the price of a substitute decreases, demand for a product falls (the demand curve shifts leftwards). If there are many substitutes, demand is changed significantly
Price of complements: a complementary good is a good which is purchased together with another good because it is consumed with that other good. If the price of the complement of a good increases, then the demand for the product may decrease.