Chapter 16: Evolution on a Large Scale
16.1 Speciation and Macroevolution
Macroevolution leads to speciation, the formation of new species.
Speciation is due to changes in the gene pool and genetic divergence of two populations based on microevolution principles.
Populations evolve adaptations to their environments over time.
Accumulated changes may lead to speciation and differentiation from other members of the same species.
Fossil records and genetic information document microevolution, macroevolution, and speciation in the history of life on Earth.
Defining Species
A species is a level of biological organization between an organism and a population.
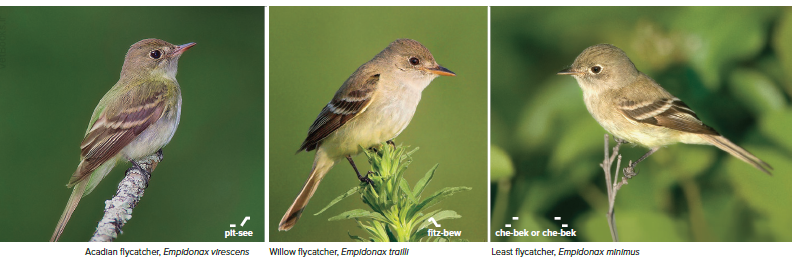
Appearance is not a reliable way to distinguish between two species.
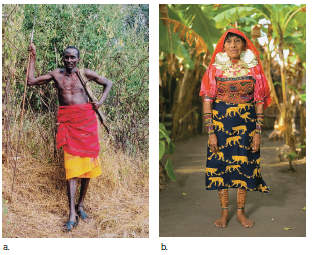
A species represents a group of organisms capable of interbreeding and producing fertile offspring.
The biological species concept states that members of a species interbreed and have a shared gene pool, and each species is reproductively isolated from every other species.
Gene flow occurs between populations of a species but not between populations of different species.
Red maple and sugar maple are separate species because their populations rarely hybridize in nature.
Humans belong to one species because members of different populations can produce fertile offspring.
The biological species concept has limitations.
It only applies to sexually reproducing organisms.
It cannot apply to asexually reproducing organisms.
Sexually reproducing organisms are not always as reproductively isolated as expected.
Some North American orioles live in the western and eastern halves of the continent.
The two most genetically distant oriole species will hybridize where they meet in the middle of the continent.
There are other definitions of species based on evolutionary relationships between species.
A species is a category of classification ranked below genus.
Species in the same genus share a recent common ancestor.
Scientists study relationships of species within a genus and between closely related genera to understand how species evolve over time.
Reproductive Barriers
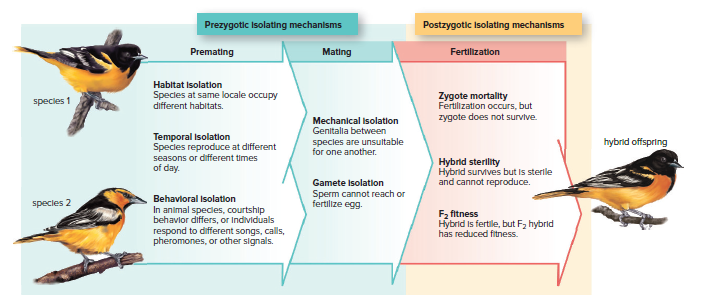
Prezygotic isolating mechanisms prevent fertilization from occurring.
Habitat isolation: Species occupy different habitats, so they are less likely to meet and mate.
Temporal isolation: Species reproduce at different times of the year, so they are less likely to meet and mate.
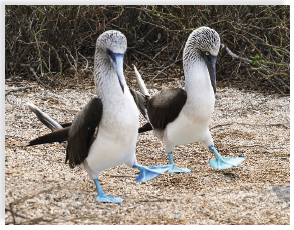
Behavioral isolation: Species have different courtship rituals, so they are less likely to mate.
Mechanical isolation: Species have incompatible genitalia or floral structures, so they cannot mate.
Gamete isolation: The gametes of different species cannot fuse, so fertilization cannot occur.
Postzygotic isolating mechanisms prevent hybrid offspring.
Zygote mortality: The hybrid zygote may not be viable and die. This can happen if the zygote has two different chromosome sets, which can lead to problems with mitosis or incompatible instructions from the maternal and paternal genes.
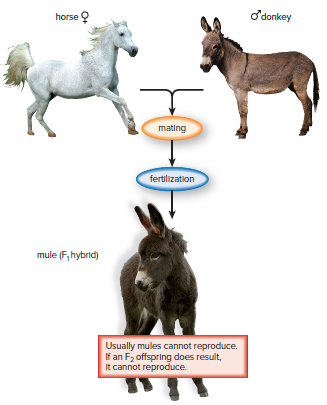
Hybrid sterility: The hybrid zygote may develop into a sterile adult. This is often the case with crosses between closely related species, such as a cross between a horse and a donkey, which produces a mule. The sterility of hybrids can be caused by complications in meiosis, which prevents the formation of viable gametes.
F2 fitness: Even if hybrids can reproduce, their offspring may be unable to reproduce. This is known as F2 fitness. In some cases, mules are fertile, but their offspring (the F2 generation) are not fertile.
Models of Speciation
DNA comparisons suggest that South American iguanas may be the common ancestor for both the marine iguana on the Galápagos Islands and the rhinoceros iguana on Hispaniola.
Green iguanas are strong swimmers and could have migrated to these islands by chance, forming separate populations.
Each population continued on its own evolutionary path as new mutations, genetic drift, and natural selection occurred.
Eventually, reproductive isolation developed, resulting in three species of iguanas.
This speciation model is called allopatric speciation, which is based on the geographic isolation of populations.
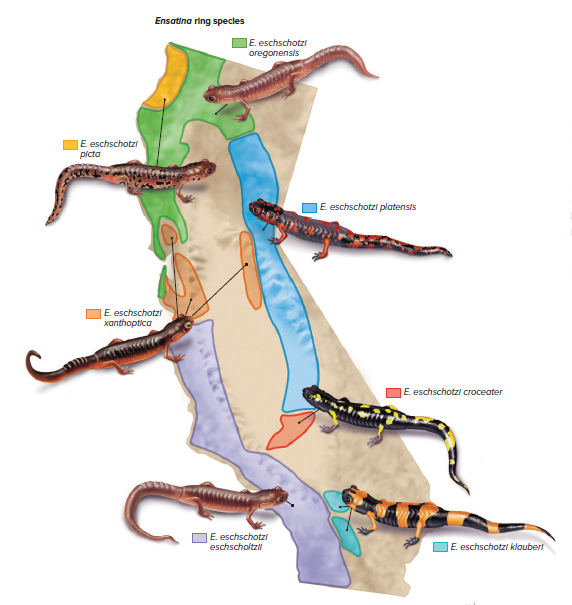
An example of allopatric speciation is the Ensatina salamanders in California.
Members of an ancestral population migrated southward, establishing a range of populations.
Each population was exposed to its own selective pressures, resulting in genetic differences.
Limited gene flow occurred between the eastern and western populations due to the barrier created by the Central Valley of California.
Genetic differences increased from north to south, resulting in two distinct forms of Ensatina salamanders in southern California that differ dramatically in color and interbreed only rarely.
Sympatric speciation is when a population develops into two or more reproductively isolated groups without prior geographic isolation.
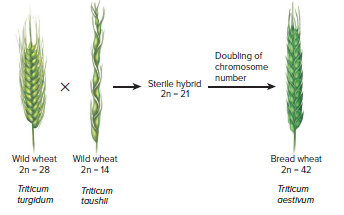
This type of speciation can occur in plants through polyploidy, which is an increase in the number of sets of chromosomes to 3n or above.
Polyploidy speciation is difficult to occur in animals due to the presence of sex chromosomes.
In plants, hybridization between two species can result in a doubling of the chromosome number, leading to polyploid plants that are reproductively isolated by a postzygotic mechanism.
Polyploid plants can only reproduce successfully with other similar polyploids and backcrosses with their parents are sterile.
Therefore, three species instead of two species result.
The parents of present-day wheat used to make bread had 28 and 14 chromosomes, respectively.
The hybrid with 21 chromosomes is sterile, but polyploid bread wheat with 42 chromosomes is fertile because the chromosomes can align during meiosis.
Adaptive Radiation
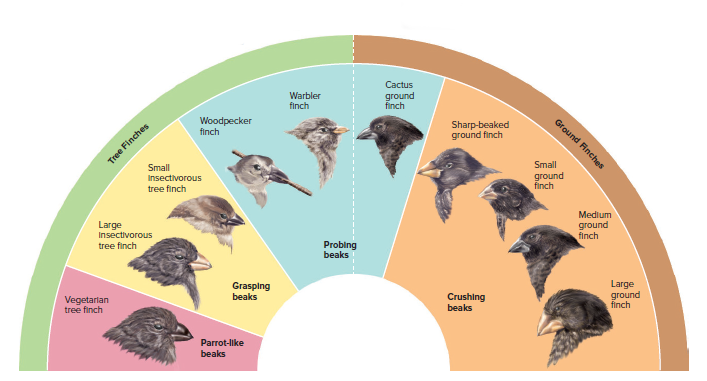
Finches on the Galápagos Islands are an example of speciation through adaptive radiation.
Many new species evolved from a single ancestral species during adaptive radiation.
The finches on the Galápagos Islands are hypothesized to be descendants of a single type of ancestral finch from the mainland.
The populations on the various islands were subjected to the founder effect involving genetic drift, genetic mutations, and the process of natural selection.
Each population became adapted to a particular habitat on its island due to natural selection.
The various populations became so genotypically different that they do not interbreed and are, therefore, separate species.
The finches use beak shapes to recognize members of the same species during courtship.
Honeycreepers on the Hawaiian Islands are descended from a common goldfinchlike ancestor that arrived from Asia or North America about 5 MYA.
Honeycreepers have a range of beak sizes and shapes for feeding on various food sources, including seeds, fruits, flowers, and insects.
16.2 The Fossil Record
The history of the origin and extinction of species on Earth is best discovered by studying the fossil record.
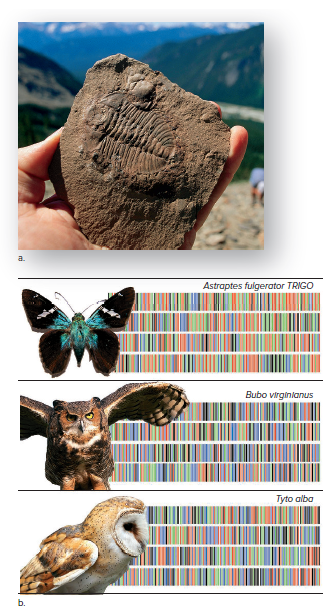
Fossils are the traces and remains of past life or any other direct evidence of past life.
Paleontology is the science dedicated to discovering and studying the fossil record.
Paleontology helps in making decisions about the history of species.
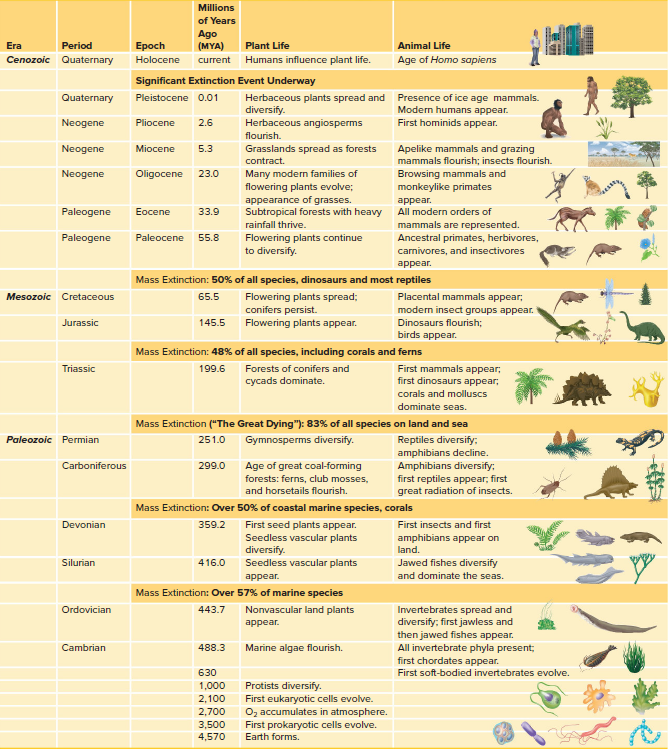
The Geological Timescale
Life-forms have evolved over time, resulting in different fossils in the layers of sedimentary rock in the Earth's crust.
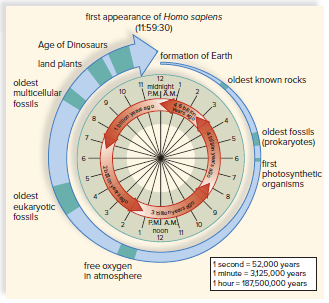
Geologists have constructed a geological timescale by studying the strata and fossils, dividing the history of life on Earth into eras, periods, and epochs.
The Cenozoic era is the only era divided into epochs, with more attention given to the evolution of primates and flowering plants.
Humans have been around for only about 0.04% of the history of life.
The geological timescale can be visualized as a 24-hour time span, with prokaryotes appearing at 5 A.M., eukaryotes at 4 P.M., multicellular forms at 8 P.M., and humans appearing 30 seconds before the end of the day.
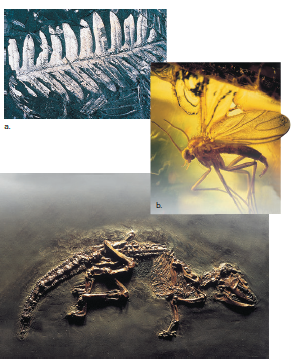
Fossils can be found in sedimentary rock, tar, ice, bogs, and amber, including shells, bones, leaves, and footprints.
Prokaryotes existed for 2 billion years before the eukaryotic cell and multicellularity arose during Precambrian time.
The evolution of the eukaryotic cell and multicellularity may have been spurred by the presence of oxygen added to the atmosphere by photosynthetic prokaryotes during the Precambrian.
All major groups of animals evolved during the Cambrian explosion.
The Precambrian fossil record is limited, while the Cambrian fossil record is abundant.
The evolution of invertebrate external skeletons led to an increase in the number of fossils.
The external skeleton may have evolved due to plentiful oxygen or as a defense against predation.
Plants appeared on land before animals during the Paleozoic era.
Nonvascular plants came before vascular plants, and gymnosperms came before angiosperms.
Fishes were aquatic; amphibians invaded the land; reptiles, including dinosaurs and birds, shared amniote ancestors with mammals.
Despite five mass extinctions, the number of species on Earth has continued to increase until the present time.
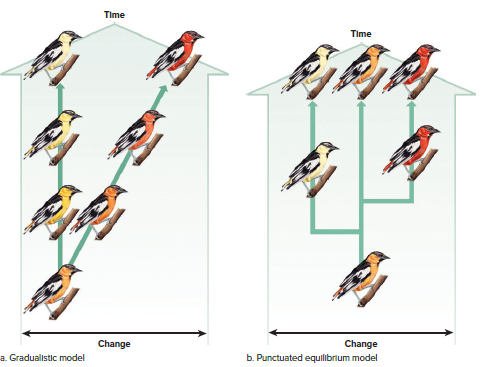
The Pace of Speciation
Darwin supported a gradualistic model to explain the pace of evolution.
Speciation occurs after populations become isolated, with each group continuing slowly on its own evolutionary pathway.
The gradualistic model shows the evolutionary history of groups of organisms using an evolutionary tree diagram.
It is difficult to indicate when speciation has occurred because there would be so many transitional links between species.
Paleontologists have developed a punctuated equilibrium model to explain the pace of evolution.
The punctuated equilibrium model says that a period of equilibrium (no change) is punctuated (interrupted) by speciation.
Transitional links are less likely to become fossils and less likely to be found.
Speciation probably involves only an isolated subpopulation at one locale.
The sudden appearance of a new species in the fossil record could represent many thousands of years because geological time is measured in millions of years.
Causes of Mass Extinctions
Most species have a limited lifespan and become extinct after a few million years.
Mass extinctions are the disappearance of a large number of species in a short period of time.
There have been five mass extinctions: at the ends of the Ordovician, Devonian, Permian, Triassic, and Cretaceous periods.
There was also a significant mammalian extinction at the end of the Pleistocene epoch.
Continental drift, climate change, and meteorite impacts have all contributed to mass extinctions.
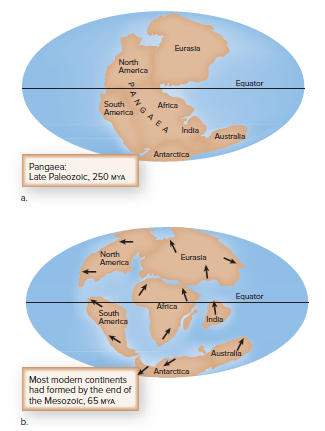
Continental drift has contributed to several extinctions.
The coastlines of several continents are mirror images of each other due to continental drift.
The same geological structures are found in many areas where the continents touched at one time.
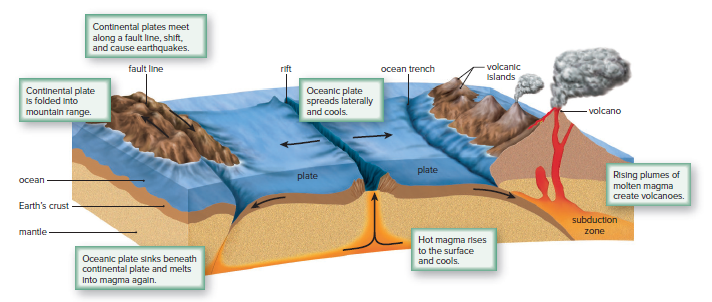
Plate tectonics explains why the continents drift.
The Earth's crust is fragmented into plates that float on a lower, hot mantle layer.
The continents and ocean basins are part of these plates, which move like conveyor belts.
Loss of habitat is a significant cause of extinction.
Continental drift can lead to massive habitat changes.
250 million years ago, all the Earth's continents came together to form one supercontinent called Pangaea, resulting in dramatic environmental changes.
Marine organisms suffered as the oceans merged, and the amount of shoreline was drastically reduced.
Terrestrial organisms were affected as well because the amount of interior land increased.
Meteor impacts can also cause mass extinctions.
A large meteorite striking Earth could cause a cloud of dust to block out the sun, causing plants to freeze and die.
The Cretaceous extinction that saw the demise of the dinosaurs may have been caused by a meteorite impact.
Evidence suggests that global warming events, specifically those that changed the temperatures of the oceans, are linked to mass extinctions of species.
The cause of these climate change events is still not well understood.
16.3 Systematics
Biology and systematics aim to understand the evolutionary history of life on Earth.
Systematics is analytical and uses data from the fossil record, comparative anatomy and development, and molecular data to determine phylogeny.
Phylogeny refers to the evolutionary history of a group of organisms.
Classification is a part of systematics, and ideally, organisms are classified based on our understanding of their evolutionary relationships.
Linnaean Classification
Taxonomy is a branch of biology that identifies, names, and classifies organisms.
Taxon refers to a group of organisms at a particular level in a classification system.
The binomial system of nomenclature assigns a two-part name to each type of organism.
The scientific name is in italics, and only the genus is capitalized.
The name of an organism usually says something about the organism.
Organisms need scientific names because common names vary from country to country and even within the same language.
Scientists use Latin because it is a universal language that most scholars know.
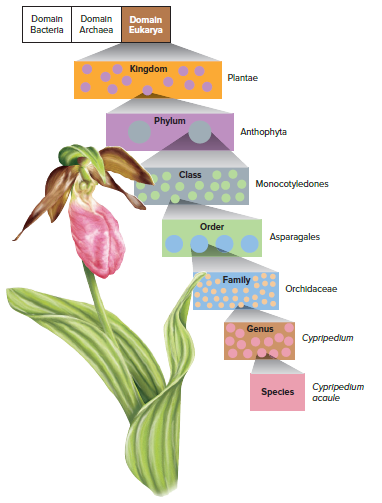
Taxonomists use several categories of classification created by Carl Linnaeus in the eighteenth century to show varying levels of similarity.
The higher the category, the more inclusive it is.
Taxonomists often subdivide each category of classification into additional categories, allowing for a further level of distinction within each major category.
Phylogenetic Trees
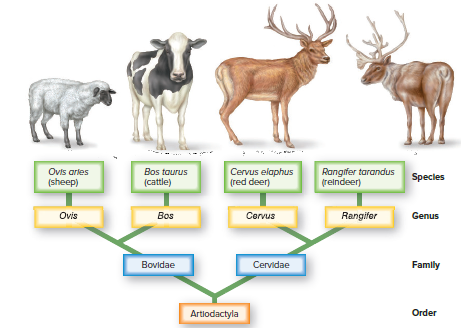
Figure 16.16 shows how the classification of organisms helps in constructing a phylogenetic tree.
The phylogenetic tree indicates common ancestors and lineages.
The common ancestor at the base of the tree has traits shared by all other groups in the tree.
Artiodactyla have hoofs with an even number of toes.
Cervidae have antlers, but Bovidae have no antlers.
Antlers are highly branched in red deer but palmate in reindeer.
Traits become more specific to particular groups of animals as the lineage moves from common ancestor to common ancestor.
Progression in specificity allows classification categories to serve as a basis for constructing a phylogenetic tree.
Tracing Phylogeny
Figure 16.16 uses morphological data, but systematists today use multiple types of data to determine evolutionary relationships between species.
Systematists rely on a combination of fossil records, morphological data, and molecular data to determine the correct sequence of common ancestors in any group of organisms.
Morphological data includes homologies, which are similarities among organisms that stem from having a common ancestor.
Comparative anatomy, embryological evidence, and fossil data provide information regarding homology.
Homologous structures are related to each other through common descent.
Deciphering homology is sometimes difficult because of convergent evolution, which is the acquisition of the same or similar traits in distantly related lines of descent.
Analogous structures have the same function in different groups, but organisms with these structures do not have a recent common ancestor.
Analogous structures arise because of adaptations to the same type of environment.
Speciation occurs due to mutations in DNA base-pair sequences.
Systematists assume that closely related species have fewer differences in their DNA base-pair sequences.
Molecular data can clarify relationships obscured by anatomical variations or convergence.
Computer software breakthroughs have made it possible to analyze nucleotide sequences quickly and accurately.
Comparative studies through the Internet make these analyses available to anyone.
Molecular systematics is a standard way to study the relatedness of organisms.
Comparative rRNA sequencing provides a reliable indicator of the similarity between organisms.
Ribosomal RNA sequencing helped investigators conclude that all living organisms can be divided into the three domains.
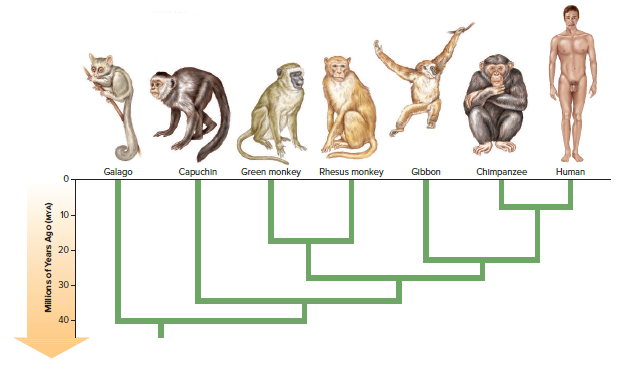
DNA differences show a close relationship between chimpanzees and humans.
A new subfamily, Homininae, includes chimpanzees, humans, and gorillas.
Gorillas and chimpanzees are more closely related to humans than they are to orangutans.
Humans and chimpanzees are placed together in their own tribe, a rarely used classification category, below the taxon subfamily.
Cladistics and Cladograms
Cladistics is a way to trace the evolutionary history of a group by using traits derived from a common ancestor to determine relationships.
Traits are used to construct phylogenetic trees called cladograms.
A cladogram depicts the evolutionary history of a group based on the available data.
The first step in constructing a cladogram is to draw up a table that summarizes the traits of the species being compared.
At least one, but preferably several species, are considered an outgroup. The outgroup is not part of the study group, also called the ingroup.
Any trait found in both the outgroup and the ingroup is a shared ancestral trait presumed to have been present in an ancestor common to both the outgroup and the ingroup.
Ancestral traits are not used to construct a cladogram. They merely help determine which traits will be used to construct the cladogram.
The principle of parsimony is a rule that many cladists follow, which states that the least number of assumptions is the most probable.
Therefore, any trait found in scattered species is not used to construct the cladogram because we would have to assume that these traits evolved more than once among the species of the study group.
The other differences are designated as shared derived traits—that is, they are homologies shared by only certain species of the study group.
Combining the data regarding shared derived traits will tell us how the members of the ingroup are related to one another.
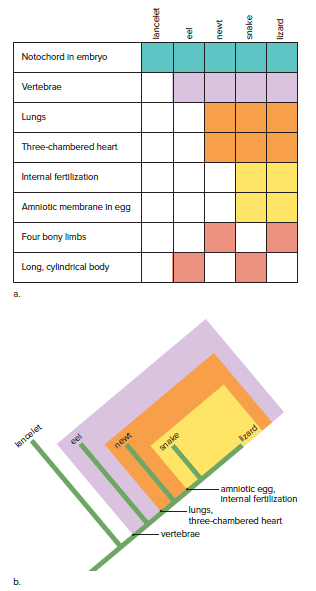
The Cladogram
A cladogram contains several clades.
Each clade includes a common ancestor and all of its descendant species.
The cladogram in Figure 16.18 has three clades.
The first clade includes the other two and so forth.
All the species in the study group belong to a clade that has vertebrae.
Only newts, snakes, and lizards are in a clade that has lungs and a three-chambered heart.
Only snakes and lizards are in a clade that has an amniotic egg and internal fertilization.
The sequence in which these traits must have evolved during the evolutionary history of vertebrates follows the principle of parsimony.
A cladogram is typically constructed using as much morphological, fossil, and molecular data as are available at the time.
Any cladogram should be viewed as a hypothesis.
The tree's consistency with the one true evolutionary history of life can be tested.
Modifications can be made on the basis of additional data.
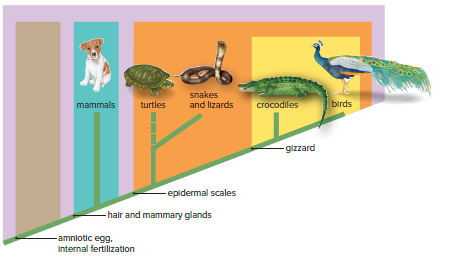
Linnaean Classification Versus Cladistics
Figure 16.19 shows problems with reconciling Linnaean classification with cladistics.
Birds and crocodiles are in a clade due to a recent common ancestor with a gizzard.
Birds share derived traits with reptiles, including scaly skin.
Linnaean classification places birds in their own group, separate from crocodiles and reptiles.
Cladists propose a different system of classification called PhyloCode.
Some biologists want to modify Linnaean classification to be consistent with cladistics.
There may be more clades than Linnaean taxonomic categories, making it difficult to equate them.
Taxons are not necessarily equivalent in the Linnaean system.
Some cladists recommend abandoning Linnaeus altogether due to these problems.
The Three-Domain System
Classification systems change over time.
Historically, biologists used the five-kingdom system of classification.
The five kingdoms were plants, animals, fungi, protists, and monerans (bacteria).
Organisms were placed into kingdoms based on cell type, level of organization, and type of nutrition.
Monerans were distinguished by being prokaryotic, while the other kingdoms were eukaryotic.
Monera contained all prokaryotes and evolved first, according to the fossil record.
Sequencing genes associated with rRNA production challenged the five-kingdom system.
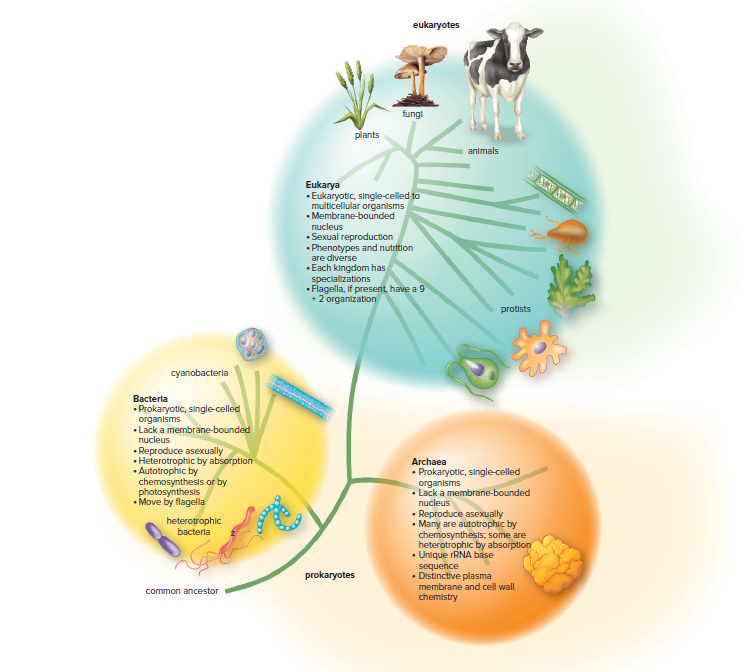
A new category of classification above the kingdom level was introduced, called the three-domain system.
All life may be grouped into one of three domains: Bacteria, Archaea, and Eukarya.
Prokaryotes were recognized as belonging to two groups so different from each other that they were assigned to separate domains: Bacteria and Archaea.
Eukarya contains kingdoms for protists, animals, fungi, and plants.
Domain Bacteria arose first, followed by Archaea and then Eukarya.
Archaea and Eukarya are more closely related to each other than either is to Bacteria.