


Chapters 24.1-24.2: Basic Macroeconomic Models
The Income-Consumption and Income-Saving Relationships
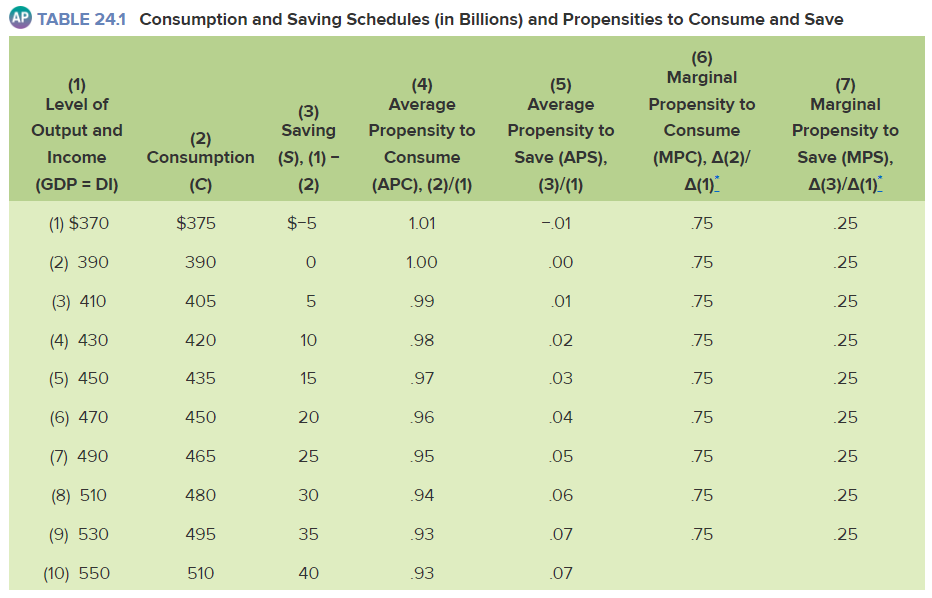
Consumption schedule::
A table of numbers showing the amounts households plan to spend for consumer goods at different levels of disposable income.
aka consumption function
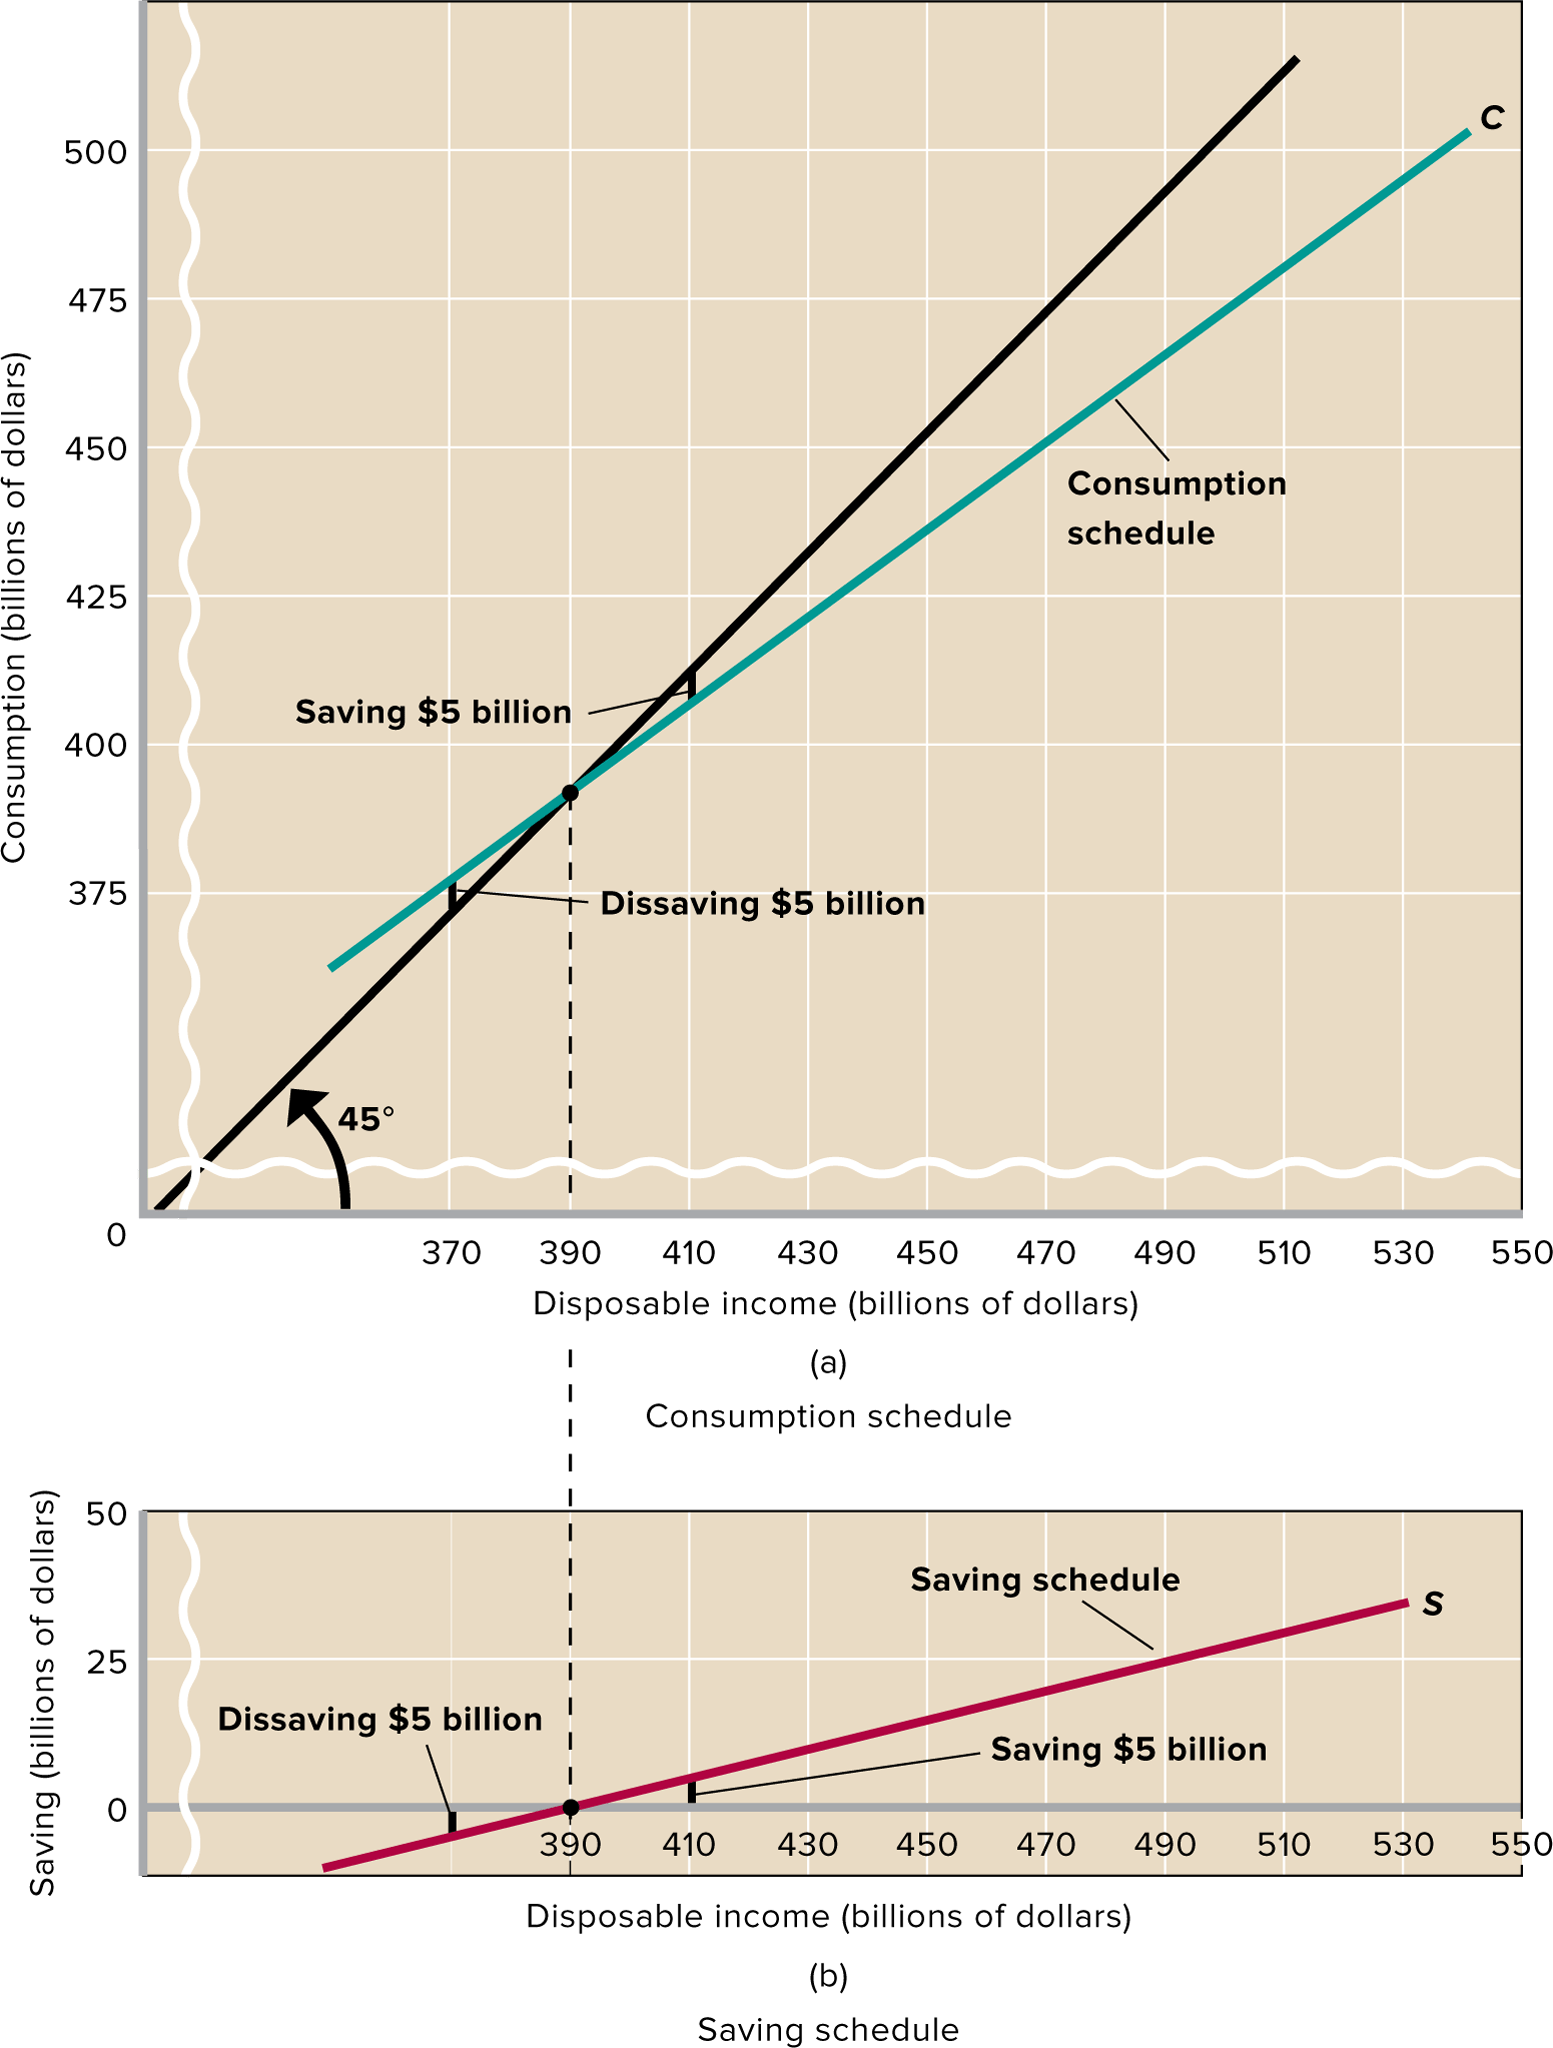
45° line:: The reference line in a two-dimensional graph that shows equality between the variable measured on the horizontal axis and the variable measured on the vertical axis.
At each point on the 45° line in the graph above, consumption would equal disposable income, or C = DI.
The slope of this line is 1 (y=x)
Saving schedule::
A table of numbers that shows the amounts households plan to save (plan not to spend for consumer goods), at different levels of disposable income.
aka saving function
Saving (S) = disposable income (DI) - consumption (C)
To find the amount saved for a given year, simply subtract the amount consumed from disposable income
dissaving::
consumption exceeds DI
break-even income::
The level of disposable income at which households plan to consume (spend) all their income and to save none of it. (C = DI).
APC and APS
Average propensity to consume (APC)::
The fraction, or percentage, of total income that is consumed
APC = consumption/disposable income
Average propensity to save (APS)::
The fraction, or percentage, of total income that is saved
APS = saving/disposable income
Since disposable income is either consumed or saved, APC + APS = 1
APC = 1 - APS
APS = 1- APC
In the table, we see that the APC and APS change each year
the APC falls as DI increases, while the APS rises as DI goes up.
MPC and MPS
Marginal propensity to consume (MPC)::
the ratio of a change in consumption to a change in the income that caused the consumption change
MPC = change in consumption/change in income
The MPC is the slope of the consumption schedule
Marginal propensity to save (MPS)::
the ratio of a change in saving to a change in the income that brought it about
MPS = change in consumption/change in income
The MPS is the slope of the saving schedule
Since disposable income is either consumed or saved, MPC + MPS = 1
MPC = 1 - MPS
MPS = 1- MPC
In the table, we see that the MPC and MPS stay the same each year
As disposable income rises in a typical economy:
Households increase their total spending and total saving. But the proportion of the income they consume (APC) decreases and the proportion of the income they save (APS) increases.
Nonincome Determinants of Consumption and Saving
What affects consumption other than income?
Note: When developing macroeconomic models, economists change their focus from the relationship between consumption (and saving) and disposable income to the relationship between consumption (and saving) and real domestic output (real GDP)
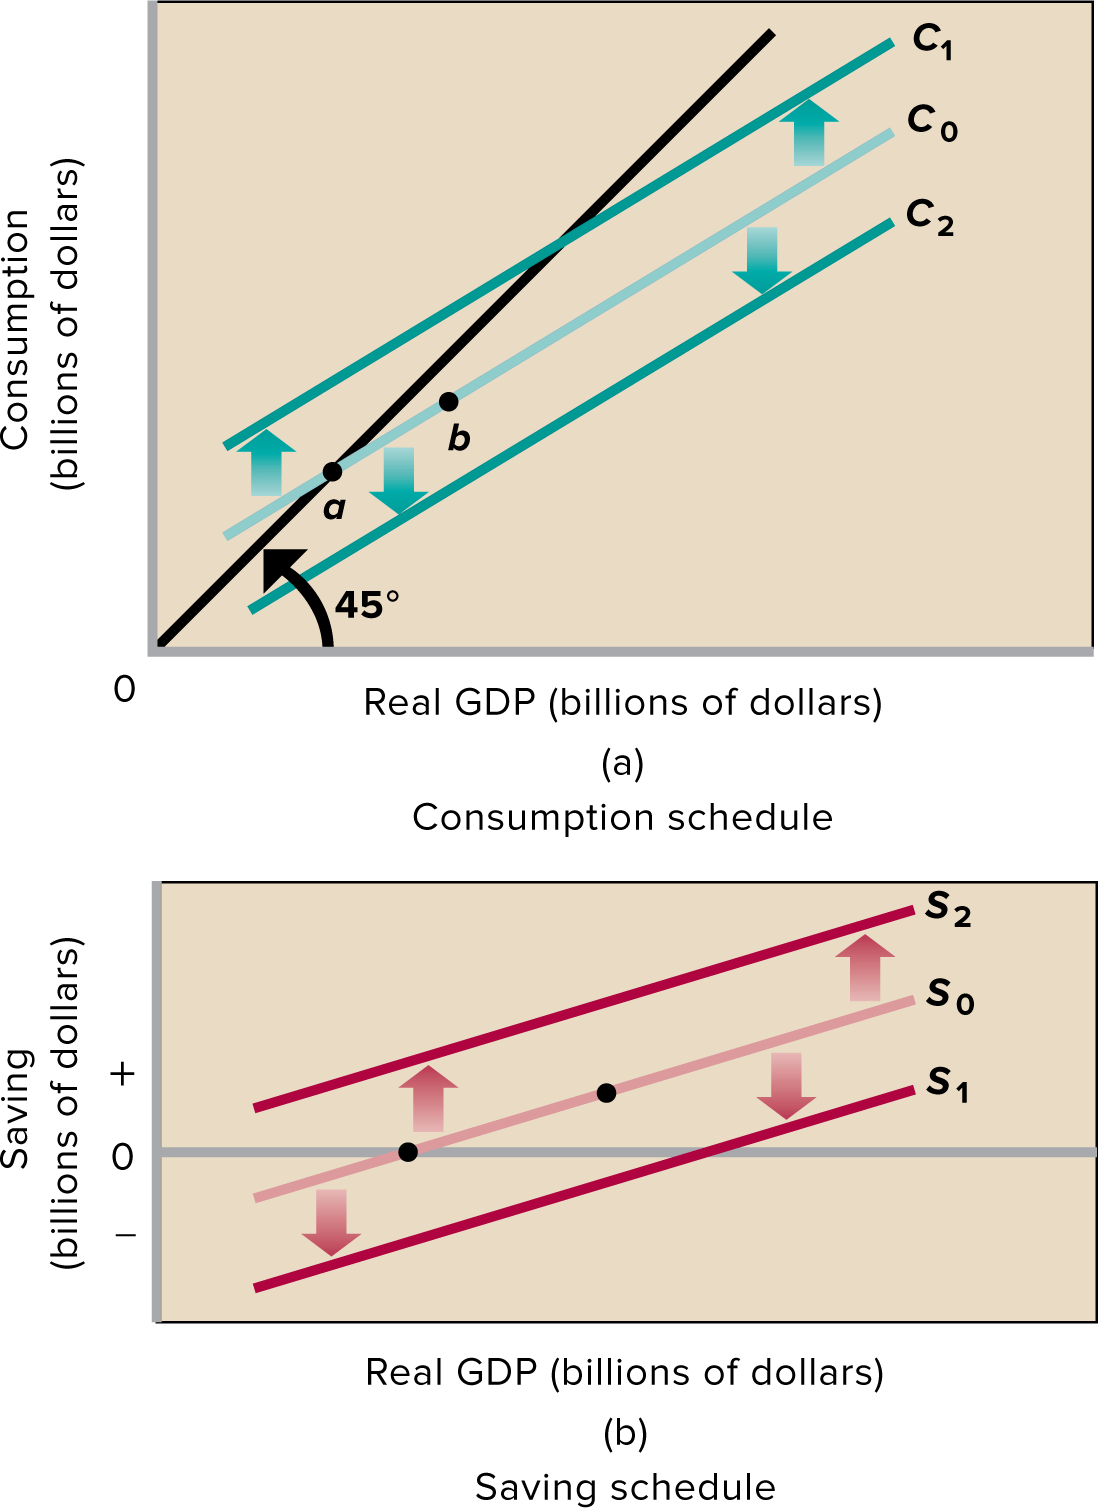
A change in income/real GDP alone causes movement along the schedules, such as from a to b in the above figure.
A shift of the entire schedule/line, such as from C0 to C1, is caused by a change in one or more nonincome determinants.
4 Nonincome Determinants of Consumption and Saving
Wealth
wealth::
the dollar amount of all the assets a household owns minus the dollar amount of its liabilities (all the debt that it owes)
wealth effect::
The tendency for people to increase their consumption spending when the value of their financial and real assets rises and to decrease their consumption spending when the value of those assets falls (reverse wealth effect).
Increased wealth shifts the consumption schedule upward and the saving schedule downward, and vice versa for decreased wealth.
Borrowing
By allowing households to spend more, borrowing shifts the current consumption schedule upward.
This means lower wealth and lower consumption in the future when the debts caused by borrowing must be repaid.
“Reverse wealth effect” only applies when wealth unexpectedly decreases, and not when wealth is intentionally decreased through borrowing
Expectations
Household expectations of higher prices tomorrow may cause households to buy more today while prices are still low, so the current consumption schedule shifts up and the current saving schedule shifts down.
Expectations of a recession and thus lower income in the future may lead households to reduce consumption and save more today, so the consumption schedule shifts down and the saving schedule shifts up.
Real interest rates
When real interest rates (those adjusted for inflation) fall, households tend to borrow more, consume more, and save less. Saving decreases because a lower real interest rate means less interest paid back to the saver.
Lower interest rates shift the consumption schedule slightly upward and the saving schedule slightly downward. Higher interest rates do the opposite.
Taxation
Changes in any of the 4 nonincome determinants shift the consumption and saving schedules in opposite directions.
In contrast, a change in taxes shifts the consumption and saving schedules in the same direction.
Higher taxes mean households have less disposable income to spend or save.
An increase in taxes shifts both the consumption and saving schedules downwards. An decrease in taxes shifts the consumption and saving schedules upwards.
Stability
The consumption and saving schedules usually are relatively stable unless altered by major tax increases or decreases.
This may be because consumption-saving decisions are strongly influenced by long-term considerations such as saving to meet emergencies or for retirement.
It may also be because changes in the nonincome determinants frequently work in opposite directions and therefore may be self-canceling.