


Units 1 & 2 Notes
Economics is the study of how to allocate scarce resources among competing ends.
Macroeconomics is the branch of economics that deals with the whole economy and issues that affect most of society.
These issues include inflation, unemployment, Gross Domestic Product, national income, interest rates, exchange rates, and so on.
Microeconomics is the branch of economics that looks at decision-making at the firm, household, and individual levels and studies behavior in markets for particular goods and services.
For example, it models a firm’s decision of how much to produce and what price to charge for its goods or services.
MEASUREMENT OF ECONOMIC PERFORMANCE
11.1 The Circular Flow and GDP
A country’s annual Gross Domestic Product (GDP) is the total value of all final goods and services produced in a year within that country.
The expression “final goods and services” indicates that to avoid double counting.
GDP does NOT include the value of intermediate goods like lumber and steel that go into the production of other goods like homes and cars, or the repurchase of used goods, which were included in GDP in the year in which they were first produced.
Also excluded from the calculation of GDP are financial transactions such as the buying and selling of stocks and bonds, since there is no productive activity associated with them to measure.
Public and private transfer payments also are not considered in GDP, nor are underground economic activities (both legal and illegal) and home production.
The media is prone to use changes in GDP as indicators of societal well-being.
Although an increase in this measure might reflect an increase in the standard of living, GDP also increases with expenditures on natural disasters, deadly epidemics, war, crimes, and other detriments to society.
Unless “bads” such as these are subtracted, be cautious in interpreting changes in GDP.
National income (NI) is the sum of income earned by the factors of production owned by a country’s citizens.
It includes wages, salaries, and fringe benefits paid for labor services, rent paid for the use of land and buildings, interest paid for the use of money, and profits received for the use of capital resources.
Personal income (PI) is the money income received by households before personal income taxes are subtracted.
Disposable income (DI) is personal income minus personal income taxes.
Be Careful!
Some textbooks ignore the intermediate step of personal income and just mention national income and disposable income. If the intermediate step is not used, then you would have to deduct taxes and add back in government transfers to go from national income to disposable income.
There are two primary methods for calculating GDP- the expenditure approach and the income approach.
The expenditure approach adds up spending by households, firms, the government, and the rest of the world using the following formula:
GDP = C + I + G + (X - M)
Here C represents personal consumption expenditures by households, such as purchases of durable and non-durable goods and services.
I represents investment in new physical capital, new construction (both commercial and residential), and additions to business inventories.
G represents government purchases.
X represents exports.
M represents imports.
The income approach makes use of the fact that expenditures on GDP ultimately become income.
National income can thus be modified slightly to arrive at GDP. To begin with, depreciation must be added must be added to national income.
Depreciation is the decline in the value of capital over time due to wear or obsolescence.
Depreciation expenses are subtracted from corporate profits before the NI calculation, so they must be re-added to capture the value of output needed to replace or repair worn-out buildings and machinery.
Subsidy payments made by the government to farmers (for example) are part of the farmers’ income but are not made in exchange for goods and services, so they are not part of GDP. Thus they must be subtracted from NI to find GDP.
Finally, we must add the income of foreign workers in the country whose GDP is being calculated, and we also must subtract the income of citizens working abroad.
This addition of the net income of foreign workers accounts for the fact that NI includes the income of all citizens, everywhere, whereas GDP includes the values of good produced domestically by anyone.
If George Lucas makes a film in France, his income will be part of the U.S. national income because he is a U.S. citizen, but his foreign-made film is part of France’s GDP.
We must subtract his income from NI when calculating the U.S. GDP. The opposite is true for citizens of France, for example, who produce in the United States.
In summary:
GDP = NI + Depreciation - Subsidies + Net income of foreigners
Net domestic product is GDP minus depreciation.
This indicates how much output is left over for consumption and additions to the capital stock after replacing the capital used up in the production process.
Circular Flow
It is useful to visualize the flow of resources through the economy with a diagram such as Figure 1.
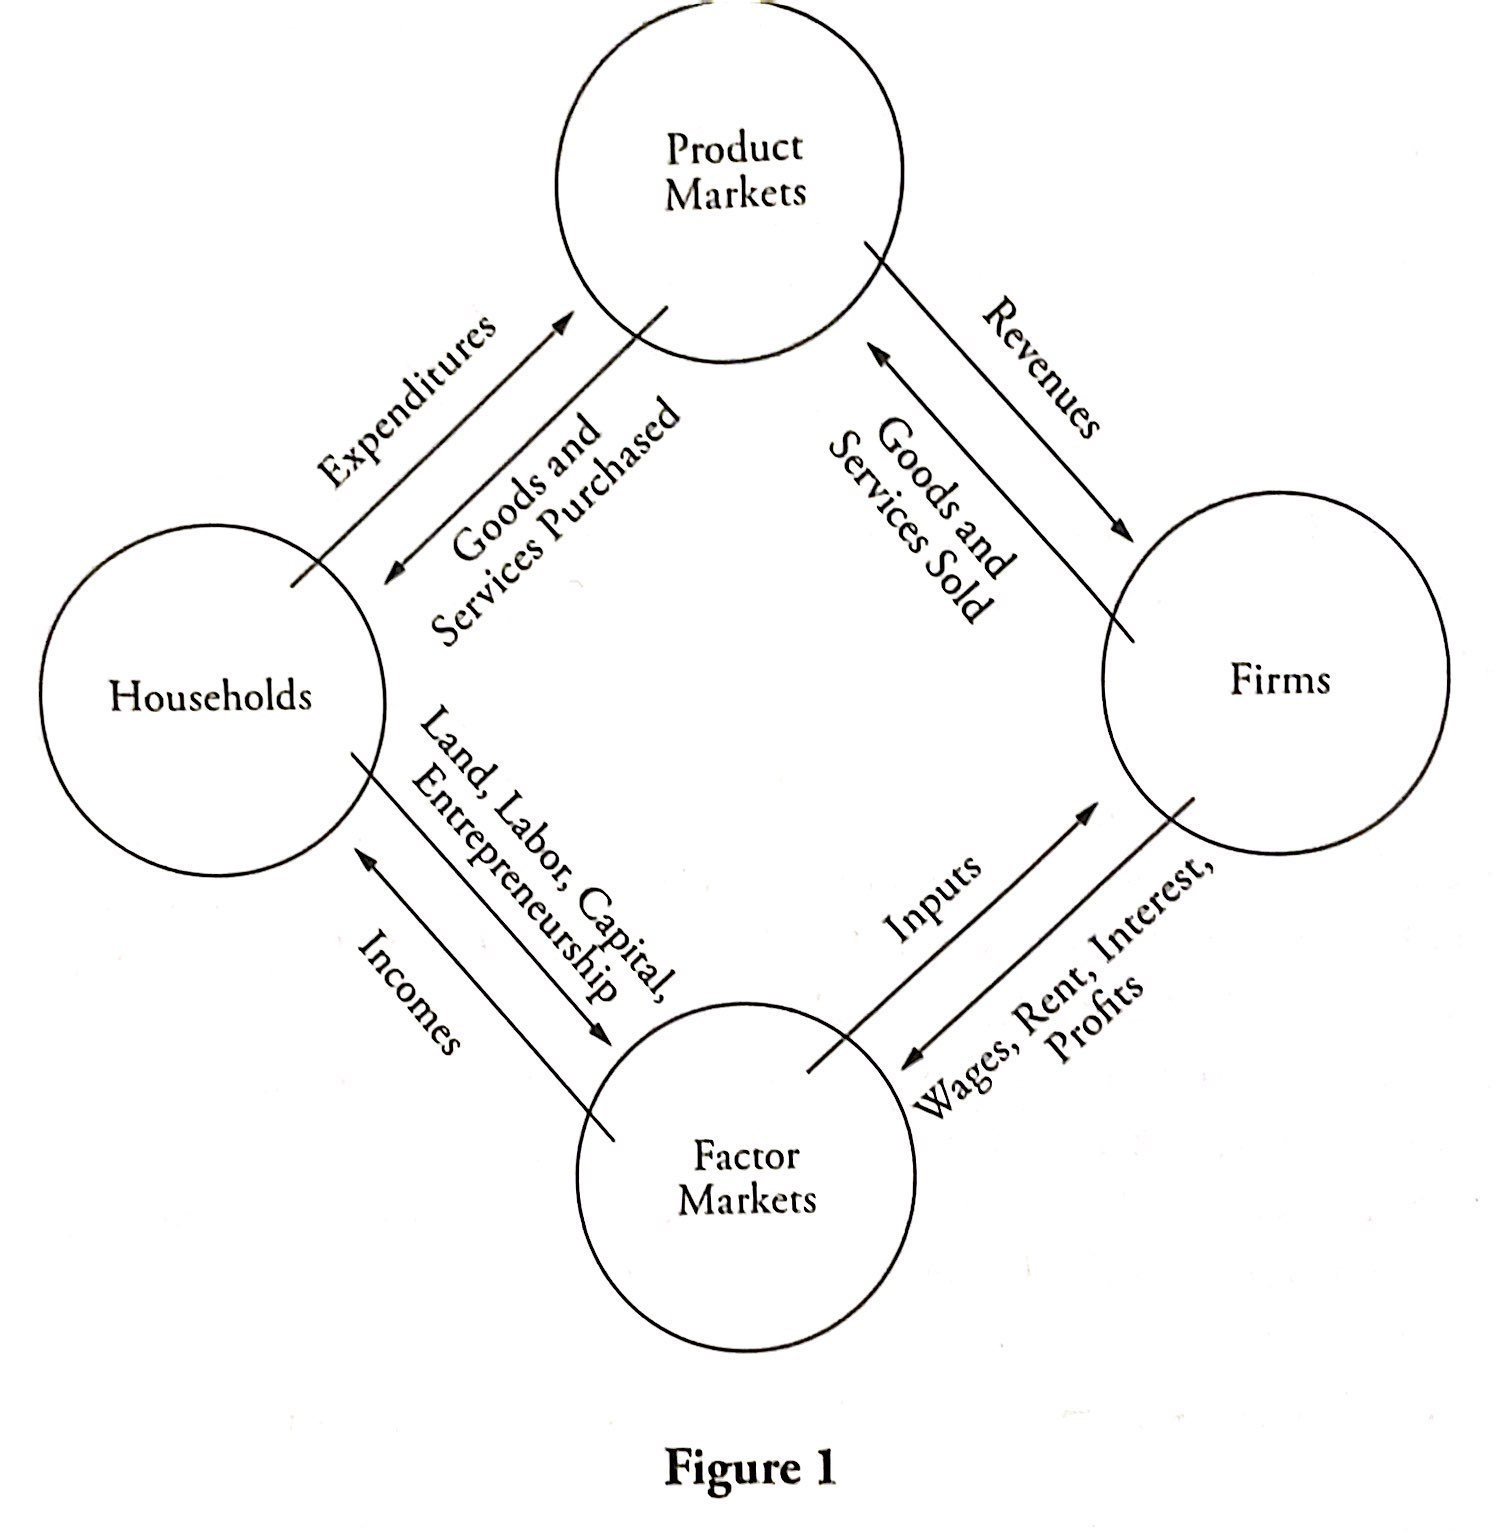
Questions regarding figures such as Figure 1 have shown up on past AP exams, so be sure to take the time to study and draw the circular flow diagram yourself.
Goods flow from firms to households through the product markets, and inputs flow from households to firms through the factor markets.
This simplified model highlights the interdependence between firms and households and the equality of aggregate (collection) income and expenditure.
If the payments from firms to households for outputs differ from the payments from households to firms for goods and services, the owners of the firms experience profits and losses.
Because the firm owners themselves represent households, the full value of expenditures, including any profits and losses, ends up as household income.
As for GDP, whether production is valued at what is paid for it or what is paid to produce it doesn’t matter because of the equality of aggregate income and aggregate expenditure.
Aggregate income = aggregate expenditure = GDP
These equalities hold even when the government and international transactions are included in the model, as discussed on the following page.
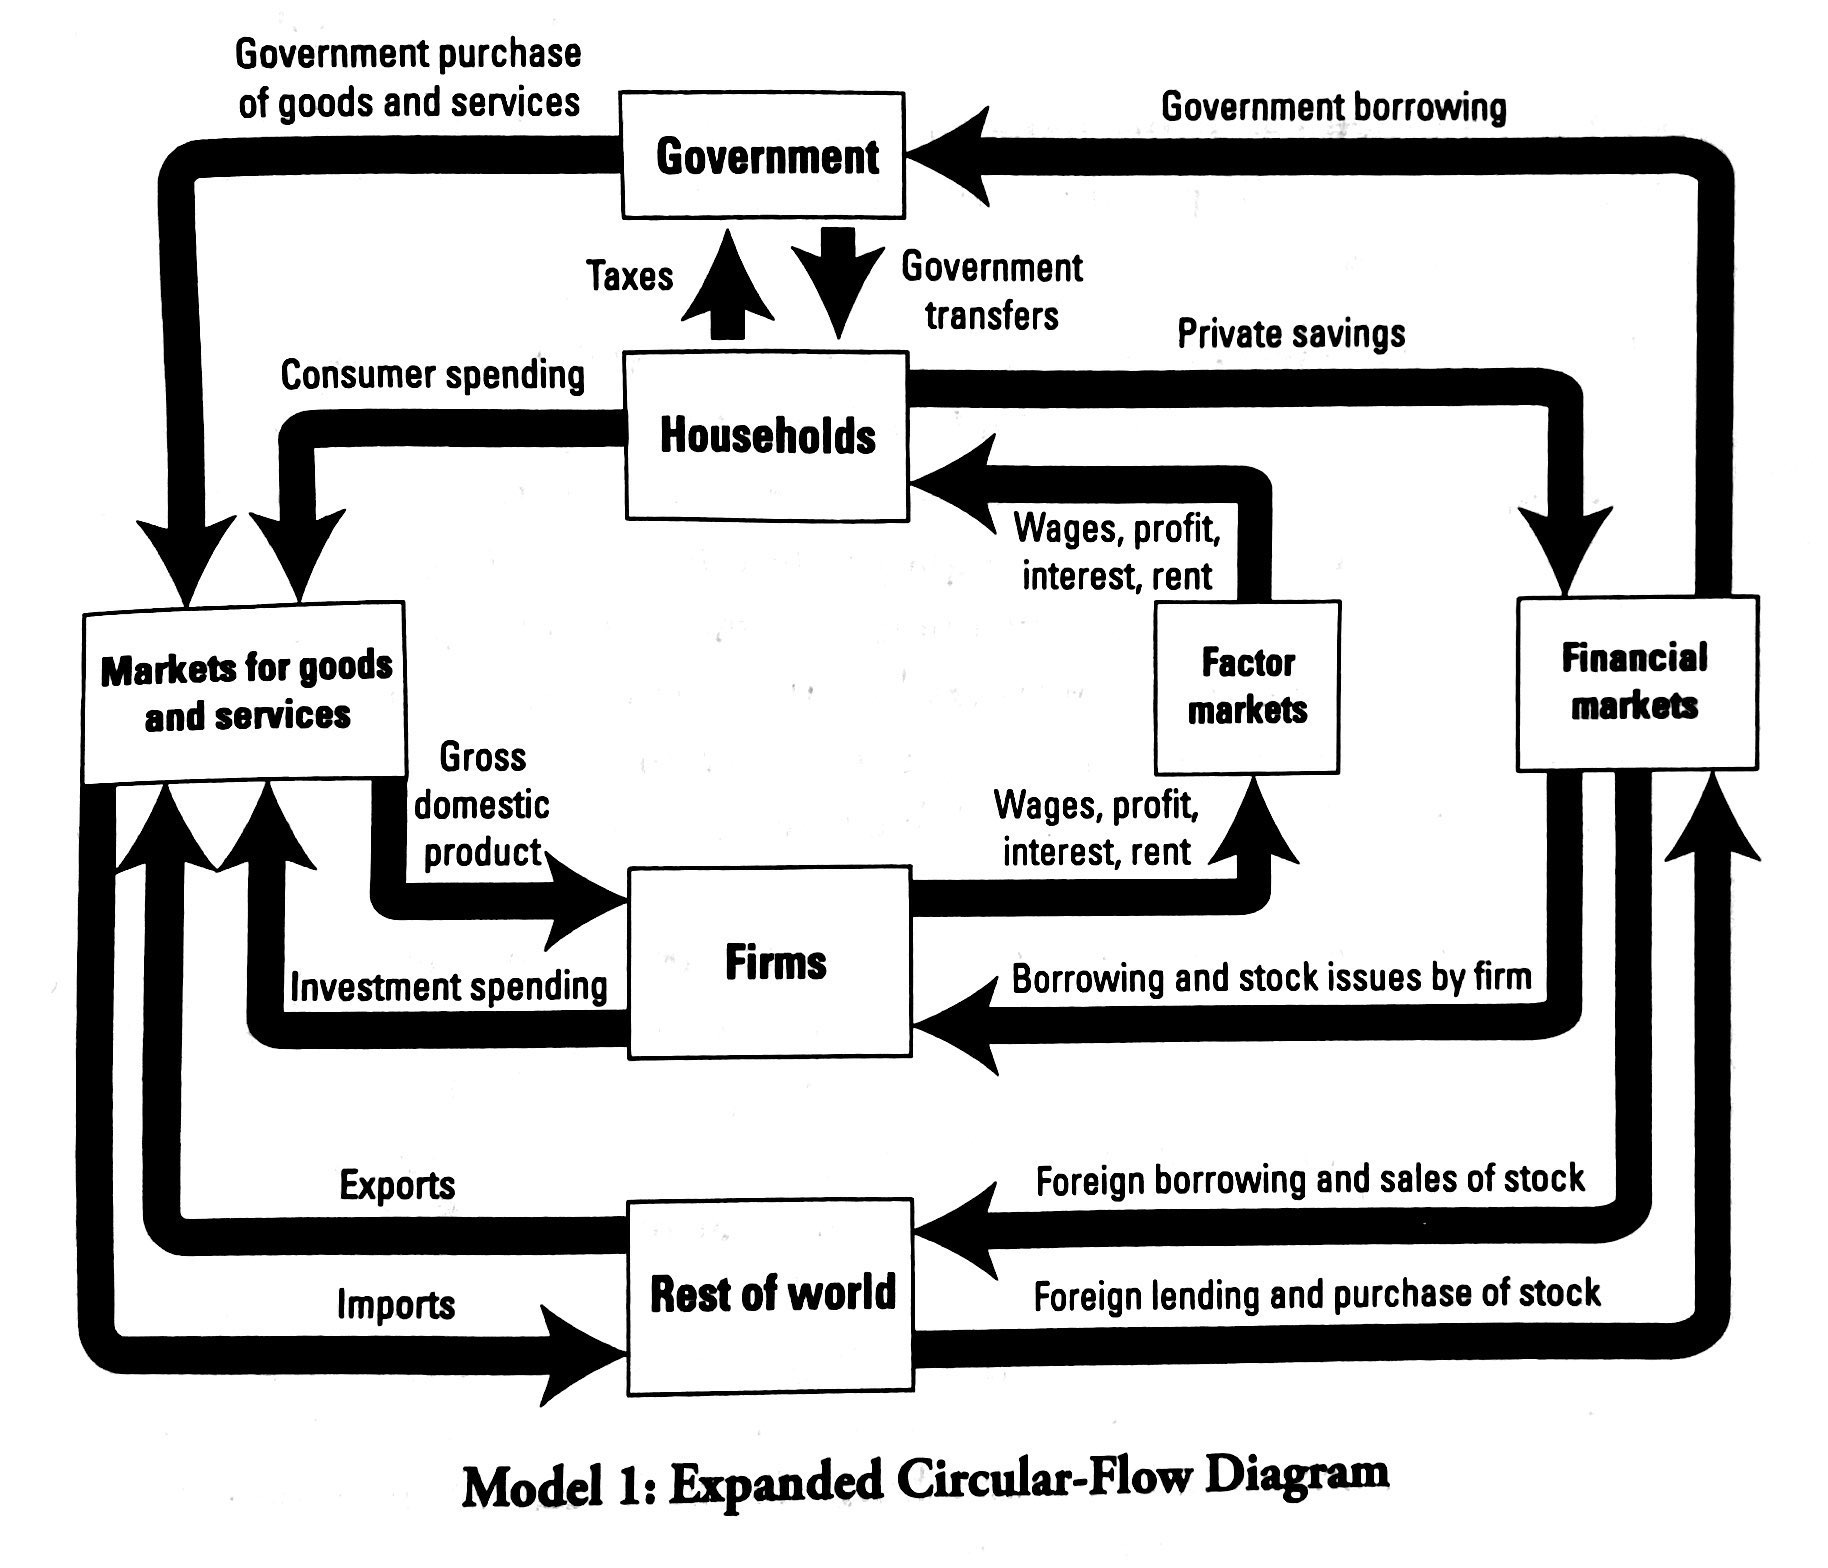
Before we move on, let’s get even broader and look at a larger circular flow diagram (Model 1) to see how money flows throughout the economy at large:
11.2 Unemployment
The labor force includes employed and unemployed adults.
To be considered unemployed, a labor force participant must be willing and able to work, and must have made an effort to seek work in the past four weeks.
The labor force participation rate is the number of people in the labor force divided by the working-age population.
The unemployment rate is the number of unemployed workers divided by the number in the labor force and then multiplied by 100 to get the percent.
The various categories of unemployment are defined below:
Frictional unemployment occurs as unemployed workers and firms search for the best available worker-job matches.
Included in this category are new labor entrants looking for their first jobs and workers who are temporarily between jobs because they are moving to a new location or occupation in which they will be more productive.
Structural unemployment is the result of a skills mismatch.
As voice recognition software is perfected, skilled typists may find themselves out of work.
The same was true for blacksmiths skilled at making horseshoes after the advent of the automobile made horse-drawn buggies obsolete.
Poorly educated people may find themselves structurally unemployed because they lack marketable skills.
Cyclical unemployment results from downturns in the business cycle.
During recessions and depressions, firms are likely to hire fewer workers or let existing workers go.
When the economy recovers, many of these cyclically unemployed workers will again find work.
Seasonal unemployment is the result of changes in hiring patterns due to the time of year.
Ski instructors and lifeguards are the classic examples of workers who lose their jobs because of the season.
Employ This Tip to Remember Unemployment
You can remember the categories of unemployment using the following irrelevant initialism:
Fire- Frictional
Some- Structural
Cut- Cyclical
Some- Seasonal
Discouraged workers are those who are willing and able to work, but become so frustrated in their attempts to find work that they stop trying.
Because they are not making an effort to find a job at least once every four weeks, discouraged workers are not counted among the unemployed in official statistics, and are a reason why the unemployment rates might understate the true unemployment problem.
On the other hand, dishonest workers bias the unemployment figures upward.
These individuals claim to be unemployed in order to receive unemployment benefits when, in fact, they do not want a job or are working for cash in an unreported job.
The natural rate of unemployment, about 5 percent in the United States, is the typical rate of unemployment in a normally functioning economy and is often thought of as the sum of frictional and structural unemployment.
Full employment is not 100 percent employment, but the level of employment that corresponds with the natural rate of unemployment. With full employment there is not cyclical unemployment.
Some unemployment can be a good thing.
Frictional unemployment often allows workers to move into jobs that are more satisfying for both the worker and the employer than a previous matching.
But high rates of unemployment can be devastating, leading to personal loss of self-confidence, crime, the breakup of families, and depression.
There are also losses to output and income.
Economists, including the late Arthur Okun, have estimated that for every one percentage point increase in the unemployment rate above the natural rate, output falls by 2 to 3 percentage points. This is called Okun’s law.
11.3 Price Indices and Inflation
Inflation is a sustained increase in the overall price level.
An increase in the price of one good is not necessarily inflation, although it might be part of a broader increase in the general price level that would constitute inflation.
The opposite of inflation- a sustained decrease in the general price level- is called deflation.
If all prices, wages, salaries, rents, and so forth increase by the same percentage, the real effects of inflation might be minimal.
For example, suppose Ted’s salary is $10 per day and he uses it to buy a pizza for $6 and two mochas for $2 each.
With inflation at the rate of 100 percent per day, all prices and salaries are doubled by the next day. Ted earns $20, pizzas cost $12 and mochas cost $4 each.
In economic terms, Ted’s nominal salary (the actual number of dollars) has increased, but his real salary (the purchasing power of the dollars) has remained the same.
There should be no real effect because Ted can still purchase exactly what he did before his salary- one pizza and two mochas.
If Ted notes the increase in his salary but does not notice the similar increase in all prices, he might think he is better off. This is called money illusion, and can lead to excessive spending.
Other detrimental effects of inflation include the following:
Stores must change price listings on signs, shelves, computers, and wherever else they are recorded to keep up with inflation. The costs of such changes are called menu costs, a name that originated with the classic example of restaurants having to print new menus after price changes.
Fixed income and incomes that increase at a rate less than the inflation rate decrease in values, imposing a burden on the recipients.
The value of interest payments do not increase in step with inflation decreases, hurting lenders and savers.
Social tensions tend to increase with inflation, in part due to the uncertainty and redistribution of income that it entails.
Increased shoe leather costs are the cost of time and effort that people spend trying to counteract the effects of inflation. Examples of this include holding less cash on hand and having to frequent trips to the ATM.
The unit of account (the standard monetary unit of measurement of value/costs of goods, services, and assets) is unstable because of inflation.
Inflation is a monetary-related economic problem. A high rate of inflation for a sustained period of time in any economy results in significant growth in the money supply.
11.4 Real vs. Nominal GDP
There are also benefits from inflation.
Those who borrowed money at fixed interest rates pay back amounts that are worth less in real terms due to inflation.
Suppose the interest rate on Stephanie’s $100 loan is fixed at five percent, meaning that she makes a nominal interest payment of $5 per year.
If the price of apples is $1 this year, the real purchasing power of her interest payment is five apples.
If inflation takes the price of apples up to $1.25, the real value of her interest payment decreases to the equivalent of four apples.
Price indices are used to measure inflation and adjust nominal values for inflation to find real values.
The Consumer Price Index (CPI) is the government’s gauge of inflation. It is used, for example, to adjust tax brackets and social security payments for inflation.
To find it, the Bureau of Labor Statistics checks the prices of items in a fixed representative “market basket” of thousands of goods and services used by typical consumers in a base year.
The CPI is calculated as
CPI = Cost of base year market basket at current prices/cost of base year market basket at base year prices x 100
The inflation between years Y and Z (Z being the more resent year) can be calculated using the following formula:
Inflation between years Y and Z = [CPI in Year Z/CPI in Year Y - 1] x 100
And any year’s nominal GDP (or any other nominal figure) can be converted into real base year dollars using the following formula:
Real GDP = Nominal GDP/CPI for the same year as the nominal figure x 100
The CPI may overestimate the inflation rate, primarily due to to its inflexible dependency on the base year market basket.
If the price of concert tickets goes up considerably, you might substitute movies for concerts.
Because the CPI relies on a fixed market basket, such substitutions for less expensive goods and services are not accounted for in its measure of inflation.
Quality improvements and price changes in new products that were not in the base year basket are also excluded from CPI inflation estimates.
The Producer Price Index (PPI) is similar in calculations to the CPI, but it applies to the prices of wholesale goods such as lumber and steel.
The PPI is sometimes a good predictor of future inflation because producers often pass their cost increases to consumers.
The Gross Domestic Product Deflator is an alternative general price index that reflects the importance of products in current market baskets, rather than in base year market baskets, which become less relevant over time.
Its formula is
GDP Deflator = Cost of current year market basket at current prices/Cost of current year market basket at base year prices x 100
This formula differs from the CPI calculation in that current year quantities are used.
The value of the GDP Deflator can be substituted for CPI values in the formulas for inflation and real GDP above.
Because the GDP Deflator reflects both price changes and substitutions away from goods from goods that have been relatively expensive, it generally registers a lower inflation rate than the CPI.
The primary causes of inflation are discussed in the section on aggregate demand.
11.5 Business Cycles
A business cycle is a recurrent fluctuation of financial and economic activity, which occurs non-periodically within a certain period of time.
Aggregate values such as product, income, or employment are areas where business cycles may occur.
For example, cyclical unemployment results from downturns in a business cycle. During recessions and depressions, firms are likely to hire fewer workers or let existing workers go. When the economy recovers, many of these cyclically unemployed workers will again find work.
Business cycles reflect the accelerations and decelerations in significant economic variables.
The growth rates of real Gross Domestic Product are usually used to measure business cycles.
A business cycle is also called an Economic Cycle or a Trade Cycle.
Classical Analysis
Classical economists theorize that wages, prices, and interest rates fluctuate quickly, clearing (bringing to equilibrium) labor and capital markets, and allowing input and output prices to stay in line with each other.
Classical economists also believe in Say’s law- the idea that supply creates its own demand. In other words, when supplying goods, workers can earn money to spend or save, and savings end up being borrowed and spent on business investments.
There should be no problem finding demand for the goods and services produced, because the income from making them will be spent purchasing them.
This supports the classical contention that the government does not need to concern itself with policies that maintain demand at a desirable level.
Critics of Say’s law argue that savings might not equal investment, because the interest rate does not fluctuate freely enough to clear the capital market (see Figure 2).
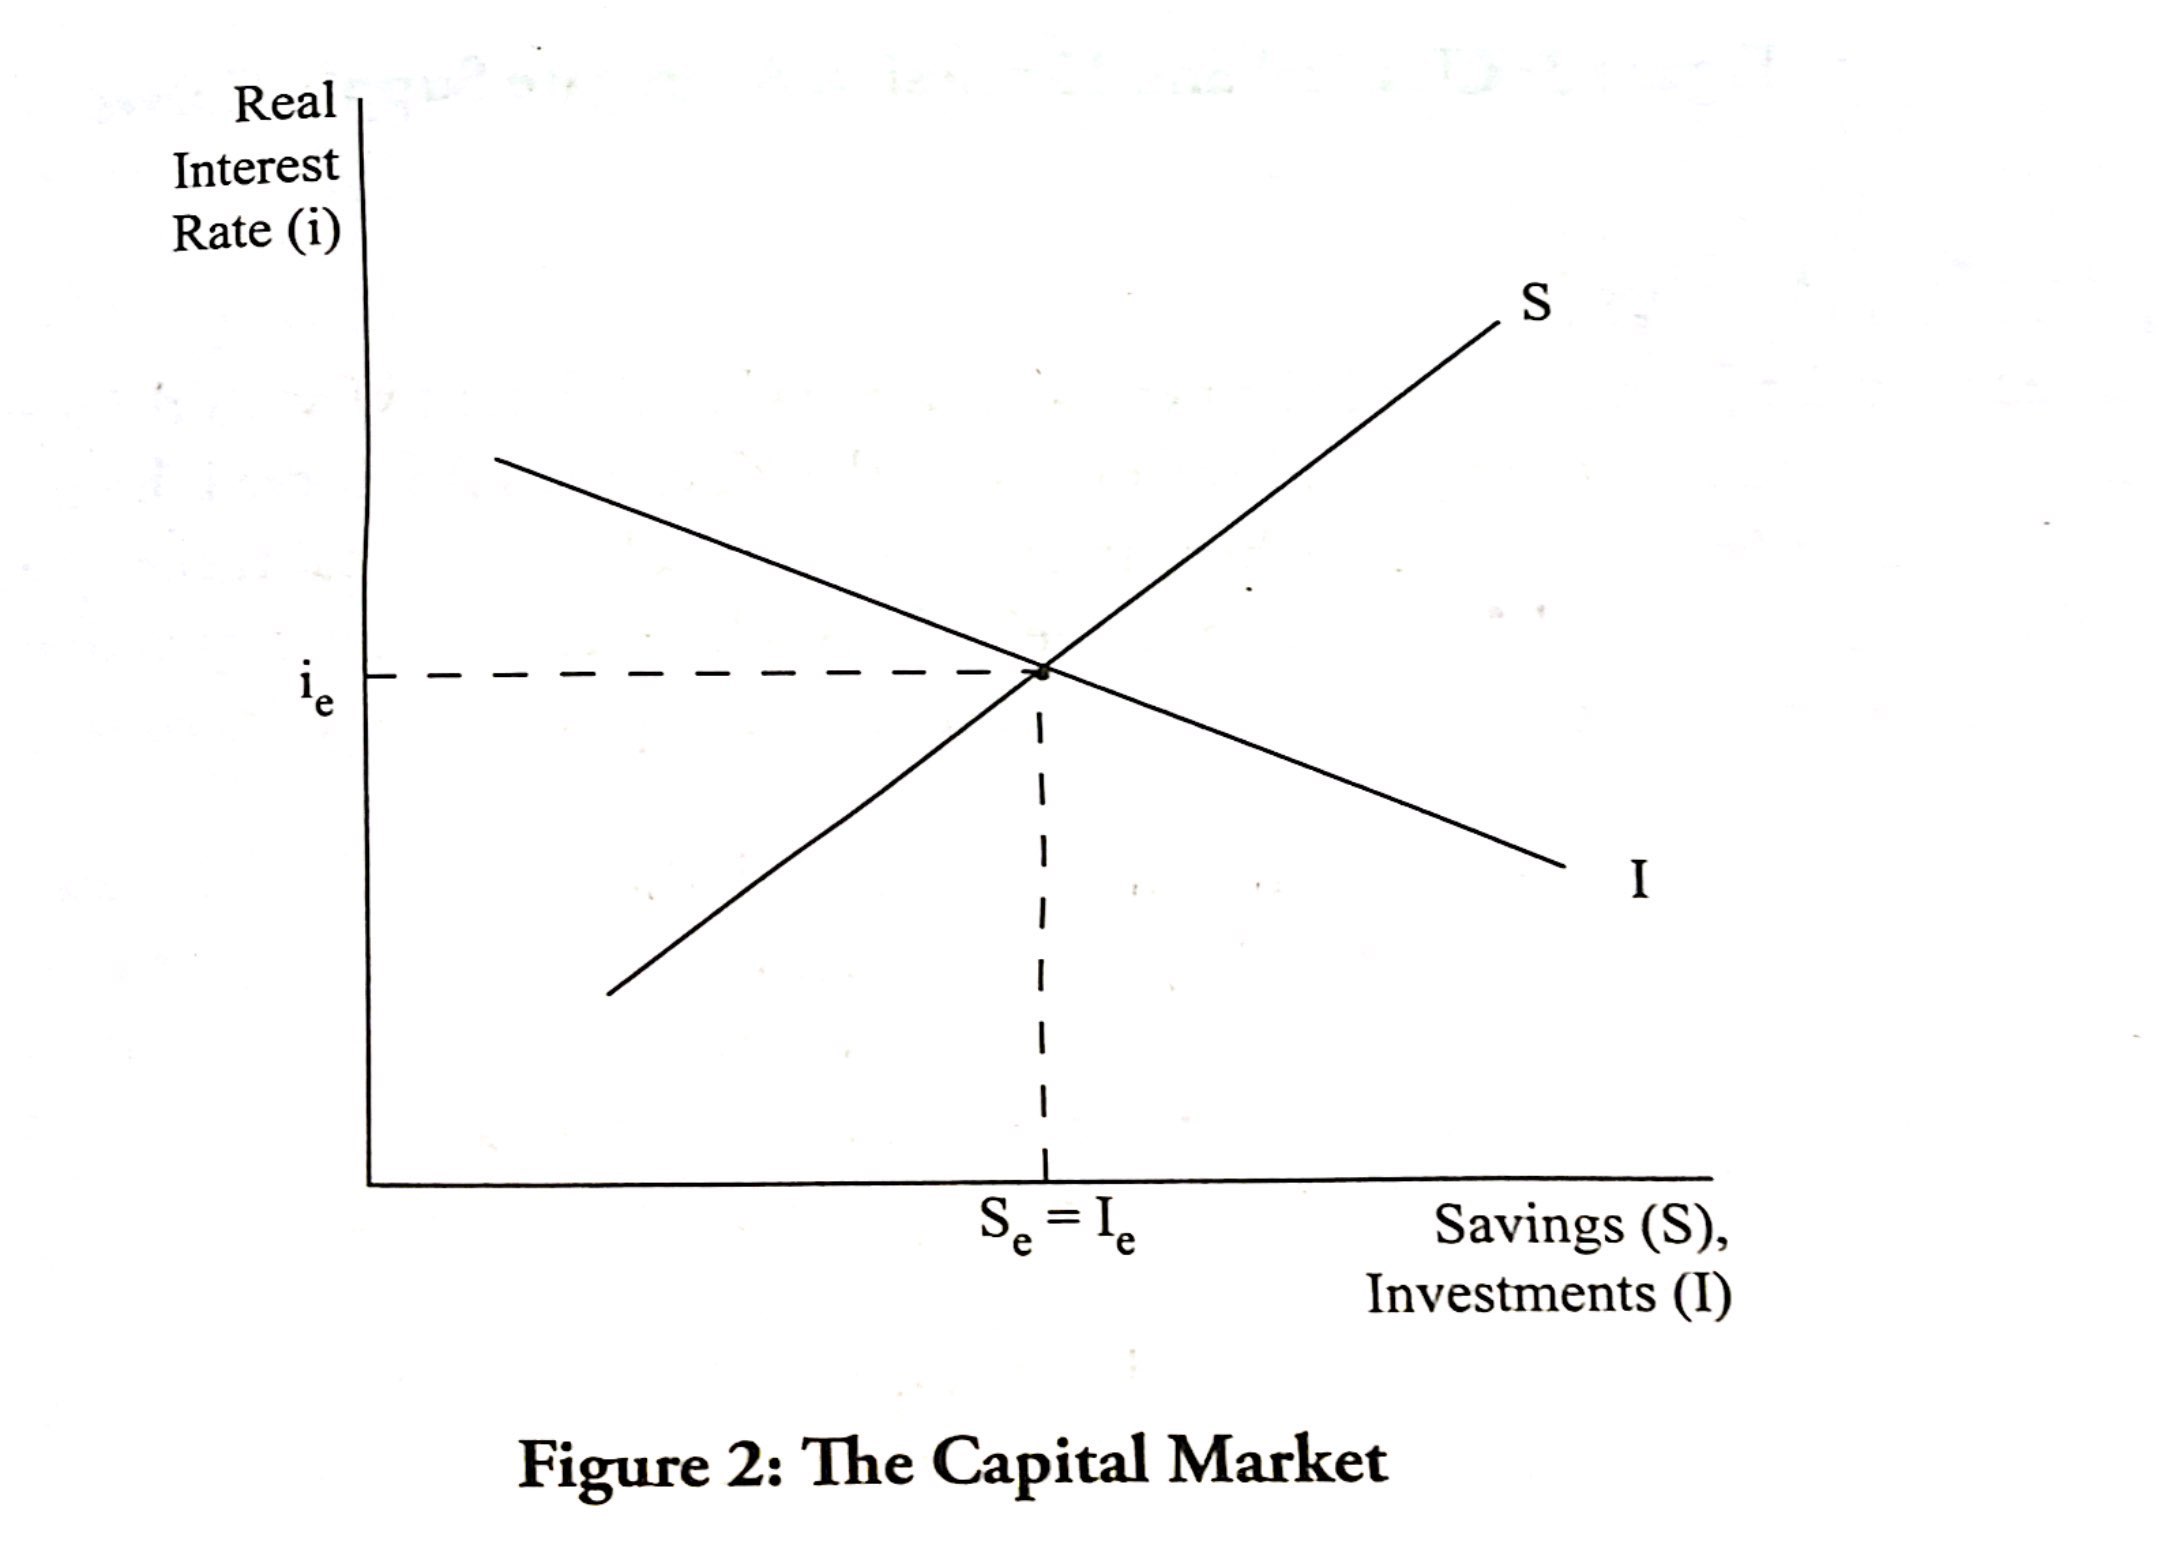
John Maynard Keynes (see next page) argued that investment demand depends more on expectations about the prosperity of the economy than on interest rates.
If savings exceed investment, some of the nation’s real GDP will not be purchased and firm inventories will expand, resulting in layoffs and subsequent production below full employment output.
Likewise, if savings are less than investments, expenditures will exceed real GDP and firm inventories will deplete, resulting in inflation and production beyond full employment output.
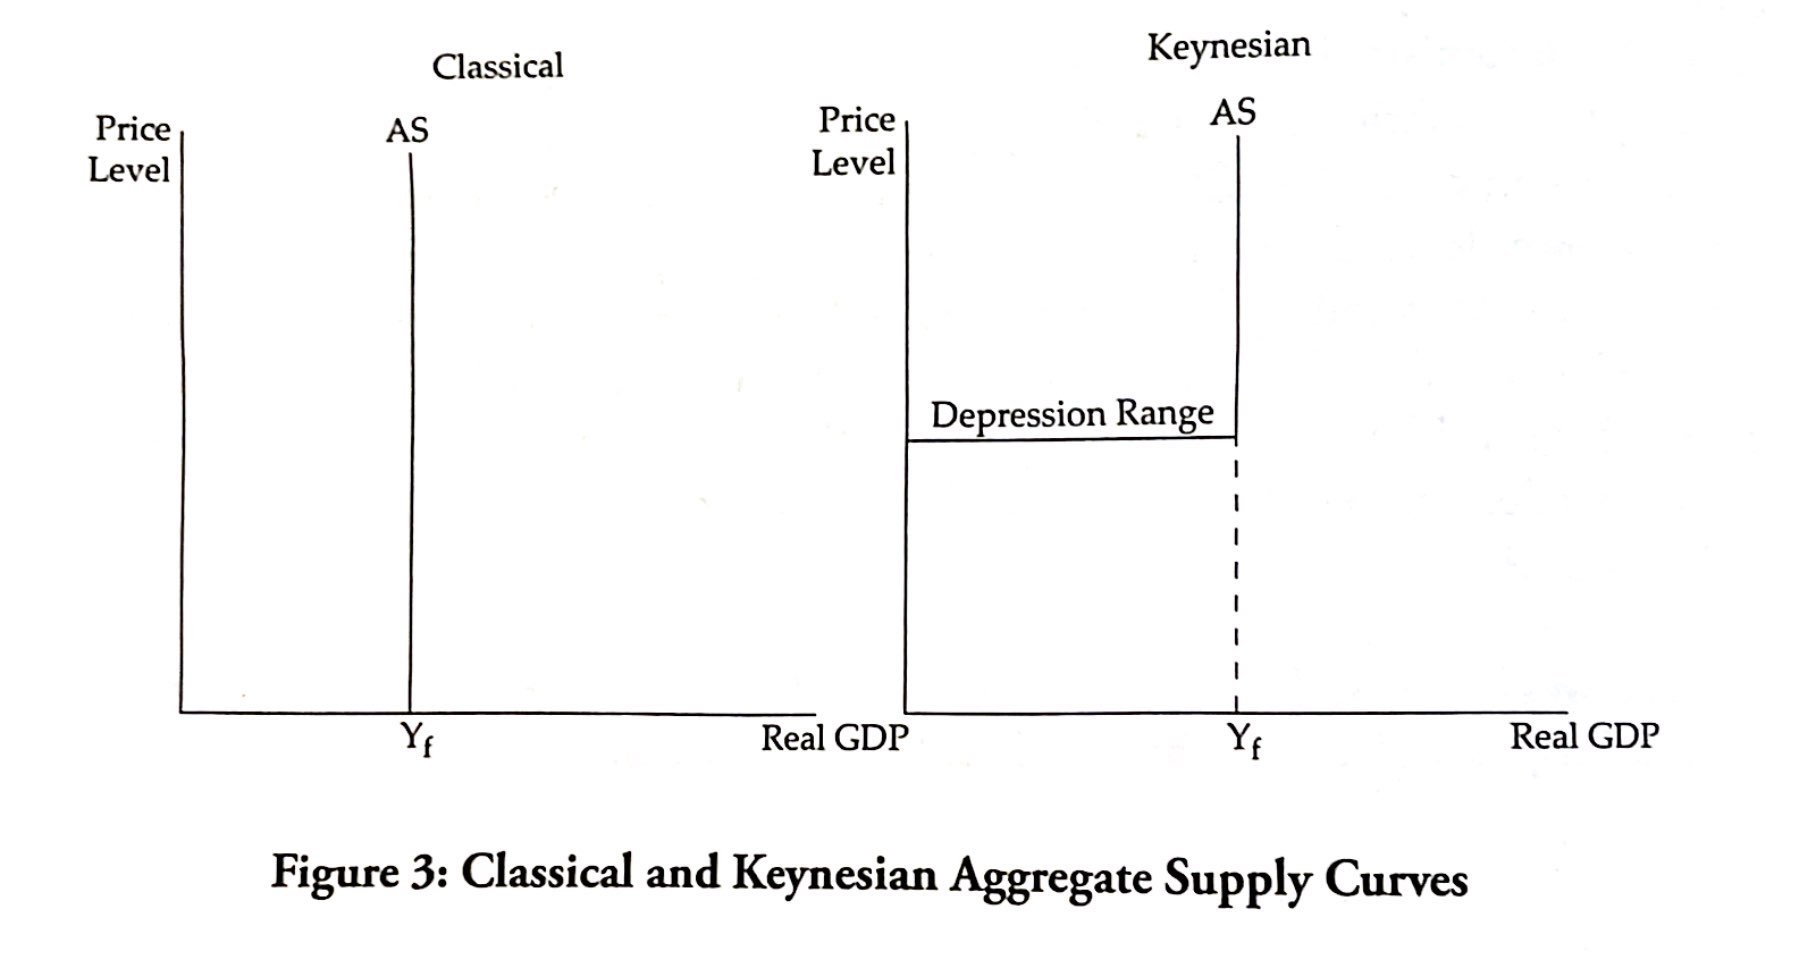
The general description of the long-run aggregate supply curve explains that real GDP rests at Y(f) in the long run after wage adjustments have had a chance to catch up with price adjustments.
If wages can adjust quickly, as classical theory suggests, they will remain in line with prices, and changes in the price level will not result in changes in real GDP even in the short run.
The assumption of flexible wages thus corresponds with a vertical aggregate supply curve as in the left side of Figure 3.
One result of a vertical AS is that increases in aggregate demand (due to expansionary policy or other wise) will increase the price level while having no effect on real GDP.
Keynesian Analysis
British economist John Maynard Keynes had a somewhat different view of the aggregate supply curve.
As illustrated on the right side of Figure 3, the Keynesian AS curve is horizontal until the full-employment level of output, where it becomes vertical, as classical theory predicts.
Keynes focused on the horizontal “depression range” of AS where excess capacity and unemployment allow increases in output and income without forcing the price level to increase.
Keynes blamed the existence of unemployment and the inability of the economy to self-adjust to full-employment output largely on “sticky” wages, particularly in the downward direction.
Keynesians argue that wage contracts are typically adjusted no more than once a year, and such influences as unions, tradition, and a reluctance to threaten company morale effectively prohibit decreases in wages.
If wages cannot adjust to match changes in price levels, deviations from full employment output might persist until the government steps in with monetary or fiscal policy (explained in Chapter 13) to bolster or tame the economy.
This is in contrast with the classical economists’ preference for laissez-faire (hands-off) governmental policy.