Microeconomics
AP Microeconomics
Unit 6: Market Failure and the Role of Government
private goods
Public goods
Spillover benefits
Positive Externalities
Subsidies
Pollution
Spillover Costs
Negative Externalities
Removing Spillover costs
Income Distribution
Tax Structures
Quintiles
Lorenz Curve
Gini Ratio
Sources of Inequality
Human capital
Abilities/personal skills
Discrimination
Preferences
Market power
Average tax rates
Marginal tax rates
Progressive tax
Regressive tax
Proportional tax

Chapter 11: Public Goods, Externalities, and the Role of Government
Private and public goods
Private goods
Are rivaled ( this means that the consumption of one person impacts the next consumer’s consumption)
Excludable (firm can decide who gets the product)
A good example would be a situation where there exist only 1 chips packet in a shop
If you were to purchase that packet, there wouldn’t be any left for the next customer (rivaled)
The same chips is excludable if you don’t pay for it
Public goods
Non-rivaled
Non-excludable
A good example would be of the police department
This is accessible to all civilians so it’s non-rivaled
Its non-excludable because everyone has the right to service
Who pays?
When it comes to private goods, only those pay who want the good badly
We could continue to purchase the private good until the marginal benefit = cost
When it comes to public goods, there isn’t a need for payment and all members of society have equal access to the good
A good example of these are public parks
Free rider problem is when some members of the community understand that they can consume the public good while others provide for it
Taking the example of public parks, there might be some individuals who pay part of the cost for the park’s renovation
While certain people pay, others avoid the payment since they get access to park regardless
The free-rider problem and the non-excludable nature of public goods require that the government collect taxes to pay for their provision
Spillover benefits and positive externalities
Spillover benefits is when one person’s consumption of a good provides utility to a third party who has not directly purchased the good
These aren’t reflected in the market price of that good
Take an example where a honey bee farmer lives next to a flower farmer
The honey bees would produce honey for the bee farmer as they collect pollen from the flower farmer
This way, without paying any additional cost, the bee farmer would benefit from living nearby to the flower farmer
This situation is known as positive externality and is represented below by a graph
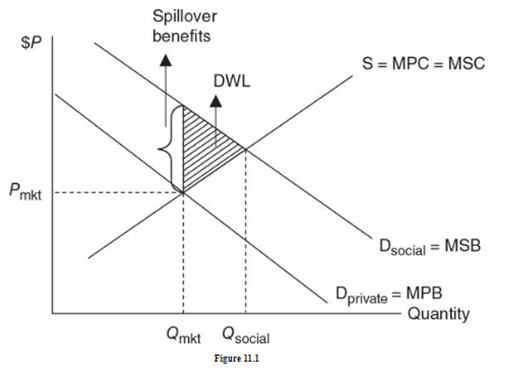
The marginal private benefits that the rose farmer earns is represented by the Dprivate and doesn’t take into consideration the societal benefits earned by the roses
The Dsocial is in fact greater than the private benefits and this is known as the spillover benefits
In terms of firms, market would grow roses at point Qmkt but the optimal quantity is in fact Qsocial due to which deadweight loss is created
In simpler terms, society would want the rose farmer to grow more roses than the market quantity
Back to the bee and rose farmer scenario, the rose farmer was providing a public good to the society that we might call ”community beautification”
The bee farmer and the rest of the society were the free-rider in the situation
Subsidies
On a larger scale, this type of market failure can be sorted through government intervention
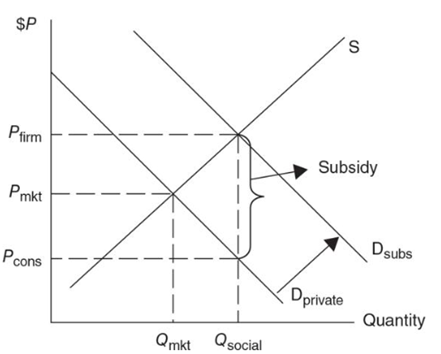
One solution might be to provide a subsidy to rose farmer equal to the amount of the spillover benefit that their activity provides to the community
This could be done in the form of vouchers or cash payments to the rose farmer which would in turn increase the demand for roses and other landscaping, shifting the private demand out to equal the social demand
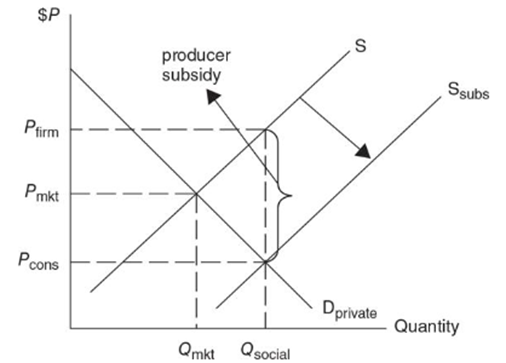
The government could also subsidize the production of rose which would cause supply curve to shift outwards
Pollution and spillover costs
Market failure also occurs when there are additional costs associated with the production of a good even if they aren’t reflected in the market price of the goods
Spillover costs and negative externalities
Spillover costs are when one person’s consumption of a good imposes disutility on a third party who has not directly purchased the good
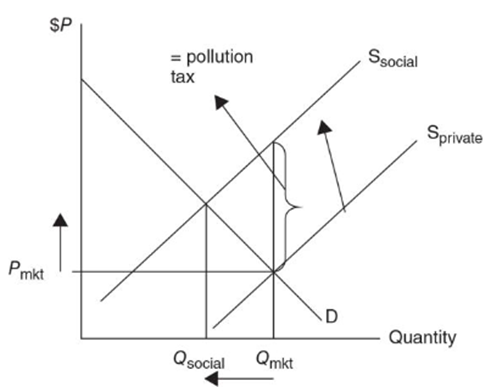
Pollution is an example of a negative externality
Existence of spillover costs from a negative externality means that not all of the costs of production are captured by the market supply curve Sprivate
Take the example of producing electricity by burning coal
Private cost of electricity production= coal+ labor+ capital.
Environmental costs = air pollution+ water pollution+ land pollution
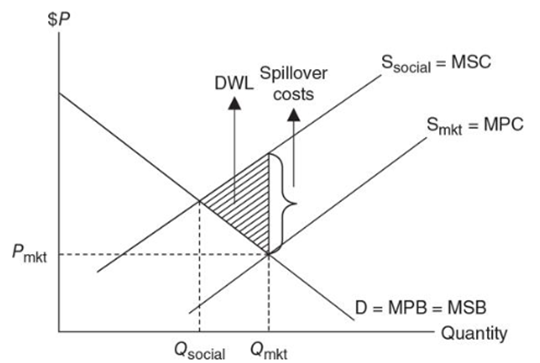
The private supply curve (labeled MPC for marginal private cost lies below the societal supply curve (labeled MSC for marginal social cost)
The market produces Qmkt units of electricity, but the optimal amount is less at Qsocial
Since the market is producing more than the socially optimal amount there is an overallocation of resources to electricity production creating deadweight loss
In other words, society wants less than the market provides
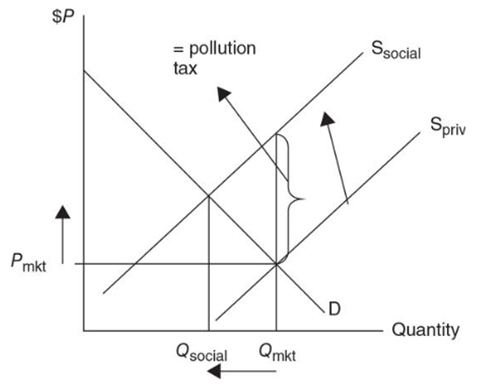
Removing spillover costs
Pollution Taxes
Purpose is to internalize spillover costs by imposing a tax on the production or consumption
This moves the market equilibrium quantity closer to the socially optimal quantity of electricity
Imposition of tax, equal to the spillover cost, per unit of coal that the power plant uses to produce electricity would result in an inward/ upward shift of the private supply curve, equating it to the social supply curve
Taxes may be imposed on consumers too if they are responsible for the negative externality
A good example is how too many vehicles on the road can contribute to a lot of pollution on the road
Government can respond by introducing taxes on vehicles purchase to limit the pollution
Income distribution and tax structures
Equity as a Goal
Some consumers are able to purchase expensive products in the market while others can’t afford even basic services.
Even if these services are exchanged at an efficient quantity where the marginal social benefit is equal to the marginal social cost, this still remains the case
An equal share?
Egalitarian, or equal-share view is supported by many people but there are certain criticism of this
The most common one is that the compensation that fails to match productivity
In clearer terms, how willingly would the people work hard or take greater risks when they know they would equal share of the economic resources despite their effort
Productivity share?
Marginal productivity theory says your wage is a function of your marginal revenue product
If competitive markets , this can be quite efficient and fair but the idea still holds critics
Those people who are unable to work, perhaps due to old age or disabilities, would find this theory farfetched
This would also apply to those people who are able to work but can’t find work
How do we measure the income distribution?
1. Quintiles
Arrange households from lowest incomes to highest income and divide that range into fifths, or quintiles (each quintiles is 20% of all the households)
Quintile | % of total income | % of total income |
|---|---|---|
Lowest 20% | 3.6% | 3.3% |
second 20% | 8.9% | 8.5% |
Third 20% | 14.8% | 14.6% |
Fourth 20% | 23% | 23.4% |
Highest 20% | 49.8% | 50.2% |
Total | 100% | 100% |
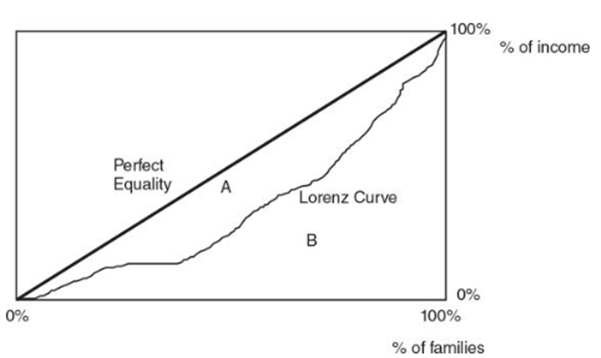
2. Lorenz Curve and Gini Ratio
Farther the Lorenz curve lies below the hypothetical line of perfect equality, the more unequal the distribution of income
Distance of the actual distribution of income from the line of perfect equality is calculated by constructing a Gini ratio, the area of the gap between the perfect equality line and the Lorenz curve (A) as a ratio of the entire area (A + B)
Closer the Gini ratio is to zero, the more equal the distribution
The closer to one, the more unequal the income distribution
What are the sources of inequality?
Abilities/personal skills
If people are highly skilled at something to can be do something unique, they can earn more than the average person
Human capital
Not everyone gets the same level of education or training like others and hence are unable to earn more
Discrimination
Social, race, and ethical discriminations are always there which in turn create limits certain people to earn despite their skill level
Preferences
varies from person to person, as some may not want to work at all while others may want to
Market power
We learned that monopoly and monopsony markets are detrimental to consumers and workers
The more market power held in the hands of the few, the more unequal the distribution of income.
Luck and connections
Some are born into rich households while others are lucky enough to stumble upon the right connections
Others may be from poor background or may not find themselves as lucky
Can income be redistributed?
Government should collect taxes from one segment of society and transfers it to another
These transfers come in the form of social programs like government housing, Medicare, or public education
Marginal and average tax rates
Change in taxes due / change in taxable income
The marginal tax rate is the rate paid on the last dollar earned
Average tax rate is the proportion of total income paid to taxes
Total taxes due / total taxable income
Progressive, Regressive, and Proportional Taxes
Progressive tax exists if as income increases, the average tax rates increase e.g. federal income tax
If your household income is above a certain minimum level but below a certain maximum level (a tax bracket), you might pay a different percentage as compared to if your household income went above the maximum tax level
Tax bracket is a range of income on which is applied a given marginal tax rate
It is designed so that the lowest incomes pay taxes at a much lower rate than the highest incomes
Regressive tax is if the average tax rate falls as income rises e.g. sales tax
Imagine a situation where 2 people shop at a grocery store with a 5% sales tax rate
Bill earns, let’s say $20,000 while Mary earns $200,000
Bill spends $10,000 annually on food and hence pays $500 in sales tax
Mary spends $20,000 annually on food at the grocery store and pays $1,000 in sales tax
Mathematically, Bill pays a much higher tax based percentage of income
Bills average tax rate = $500/ $20000 = 2.5%
Mary’s average tax rate = $1,000 / $200,000 = .5%
Proportional tax exists if a constant tax rate is applied regardless of income e.g. corporate taxes to an extent