


Unit 4.7: Financial Sector
The Loanable Funds Market
Loanable Funds market (loans)::
How much money in the form of loans consumers, businesses, and government are requiring
Determined by expectation of return on investment
Real interest rate::
The “price of borrowing money”
with loanable funds, use real instead of nominal b/c loans are usually taken over a longer period of time
Real interest rate = nominal interest rate - inflation rate
Demand for loans
Follows the law of demand like any other good/service (downsloping)
Represents the amount of loans being demanded by consumers, producers, and government
Supply of loans
Follows the law of supply like any other good/service (upsloping)
In a closed economy:
Supply in closed economy = national savings
national savings = public + private savings
In an open economy
Supply in open economy = national savings + net capital inflow (money coming in from foreign investors)
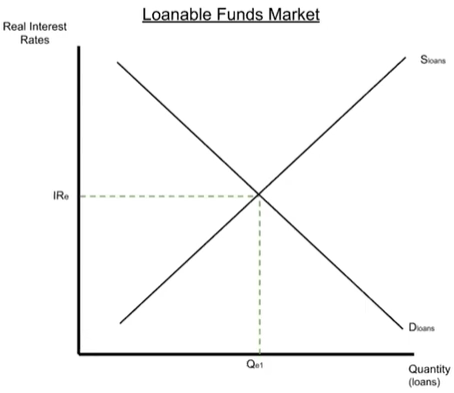
Equilibrium
Occurs when the interest rate is set where quantity supplied = quantity demanded
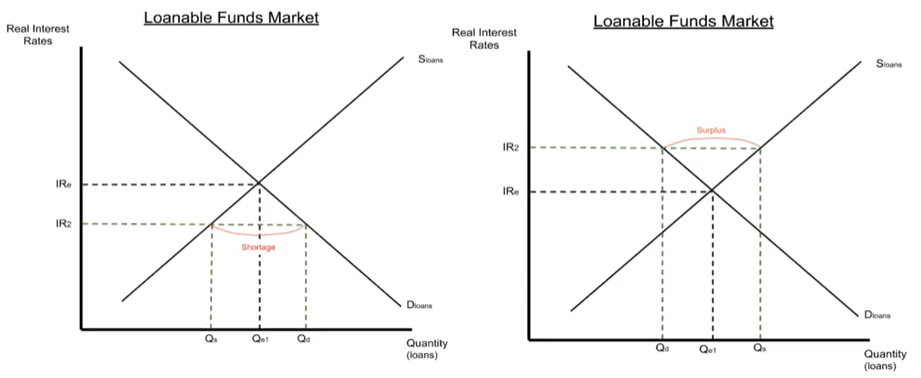
Disequilibrium in the loanable funds market
Left graph:
Real interest rate is below the equilibrium
Shortage of loans
demand will go up and supply will go down
borrowing will be more cheap (high demand)
less payoff for saving
People won’t keep as much money in the bank so the amount available to loan out decreases (low supply)
Must increase interest rate from IR2 to IRe
Right graph:
Real interest rate is above the equilibrium
Surplus of loans
demand will go down and supply will go up
borrowing will be more expensive (low demand)
more payoff for saving
People will keep more money in the bank so the amount available to loan out increases (high supply)
Must decrease interest rate from IR2 to IRe
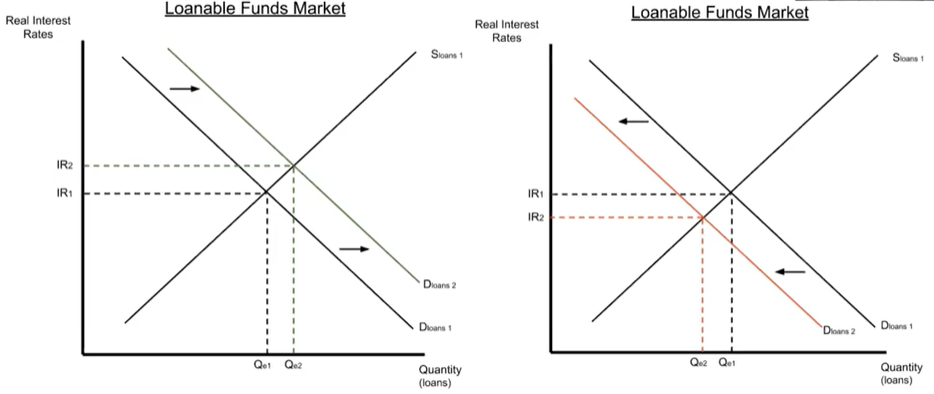
Changes in demand of loanable funds: shifted by changes in return on investment
Left graph:
Higher expected return on investment, economy doing well, higher income, etc
Demand for loans increases (shifts right)
Equilibrium interest rate increases
Right graph:
Lower expected return on investment, recession, people losing jobs, etc
Demand for loans decreases (shifts left)
Equilibrium interest rate decreases
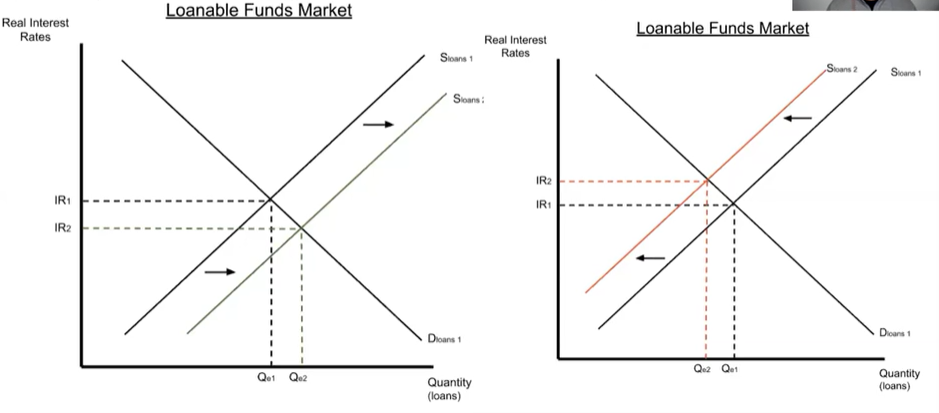
Changes in supply of loanable funds: shifted by changes in savers’ behavior
Saving refers to people keeping their money in banks instead of spending it
Left graph:
Saving increases
supply for loans increases (shifts right)
Equilibrium interest rate decreases
Right graph:
Saving decreases
supply for loans decreases (shifts left)
Equilibrium interest rate increases