Chapter 1: An Introduction to the Economic Way of Thinking
Economics is the study of choices.
Macroeconomics deals with the choices we make as a society, such as how much tax to pay and how many progran1s the government should sponsor .
Thus, Macroeconomics deals with choices that societies make.
Microeconomics deals with the choices individuals, households, or businesses make, the decision for both spouses in a family to have paid employment, and the decisions firms make when hiring workers.
Thus, Microeconomics deals with the choices individuals, household and businesses make.
Scarcity occurs when we have fewer resources than we have uses for those resources. '
The three basic economic resources are land, labor, and capital.
Scarcity forces us to allocate our scarce resources among the many uses for them, and we have to make choices or trade-offs between these various uses. Economic tools help us to understand and analyse choices and their implications.
The cost of a choice is what you give up to make the choice
The benefit of a choice is what you gain when you make the choice.
Utility is a synonym tor satisfaction or happiness and describes the benefit individuals get from their choices.
Profit is the difference between the earnings that a firm receives from selling its good or service and the costs incurred to produce the good or service.
Profit is the benefit that firms get from their choices.
The opportunity cost of a choice is the value of the next-best alternative foregone.
Decision makers weigh the costs and benefits associated with any choice in order to maximize the value of some objective.
In the case of individuals, economists assume that they maximize their utility, or satisfaction, when making choices.
In the case of business firms, economists assume that they maximize their profits when making choices.
As the benefits of making a particular choice increase, you are more likely to make the choice.
As the costs of making the choice increase, you are less likely to make the choice.
Ceteris paribus is a Latin term that means "all other things remaining constant" or "all else equal."
To isolate the effect of some causal event on an outcome. Other factors that might also affect the outcome cannot be allowed to change.
Without the ceteris paribus assumption, it would be difficult to isolate cause and effect when studying various economic or scientific outcomes.
Economists, use the concept of ceteris paribus to isolate important relationships.
however, just because other factors are initially held constant with the ceteris paribus assumption, they do not need to be held constant forever.
Analysis of economic choices often involves relaxing the ceteris paribus assumption in a series of steps.
The Marginal cost of a choice is the additional or incremental cost associated with the choice.
The marginal benefit of a choice is the additional or incremental benefit associated with the choice.
The law of diminishing marginal benefits: as more and more of an activity is done, the marginal benefits derived from the activity lend to diminish.
The law of marginal cost: as more and more of an activity is done, the marginal costs of the activity tend to increase.
Marginal benefits and marginal costs can be used to illustrate a general rule for making decisions: when the marginal benefit of an activity is greater than its marginal cost, we can increase our utility or profits by engaging in more of the activity. If the marginal cost is greater than the marginal benefit, engaging in more of the activity will make us worse off by decreasing our utility or our profits.
A skunk cost is a cost that, once incurred, cannot be recovered. Sunk costs are irrelevant when making decisions at the margin.
WORKING WITH GRAPHS
Graphs are visual representations of relationships between two or more variables.
CONSTRUCTION OF A GRAPH
The first step in constructing a graph is obtaining the data you want to show in the graph. Economic data can come from government agencies, from surveys, and from business records.
The second step is constructing a graph is drawing and labelling the axes of the graph.
For many graphs. data is shown on the Cartesian coordinate system, named after Rene Descartes.
The Cartesian coordinate system graphs data using a set of two axes to represent values of two variables.
The axes are drawn perpendicular to each other, and the point where they intersect is called the origin of the graph.
The horizontal axis is called the x-axis, and the vertical axis is called the y-axis.
The variable that is measured on the y-axis is the y-variable.
The variable that is measured on the x-axis is the x-variable.
Rightward movements along the x-axis correspond to increases in the value of the x-variable. Similarly, upward movements along the y-axis correspond to increases in the value of they-variable.
The next step in constructing a graph is to plot the corresponding data points on the graph. Corresponding data points are the data values that go together.
The third step in constructing a graph is to connect the data points and label the resulting curve or line. By convention, the term "curve" is used to describe the connected data points, regardless of whether the curve is a straight line or not.
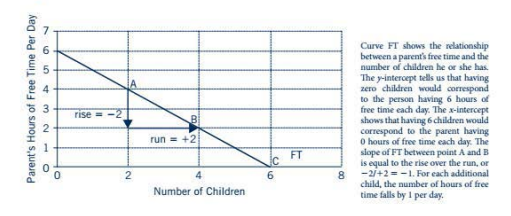
The intercepts of a graph are the places where the curve intersects the y- and x-axes. The y-intercept shows the value of the y-variable when the x-variable is zero. The x-intercept shows the value of the x-variable when the y-variable is zero.
Slope of a graph=(change in the y variable)/(change in the x variable)
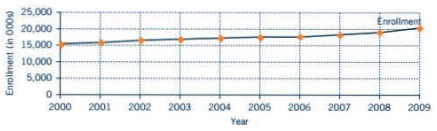
Taking an example here: We are interested in graphing the number of students enrolled in college across time.
1.OBTAIN DATA:
We can obtain data on this relationship from the U.S. Department of Education's National Center for Education Statistics.

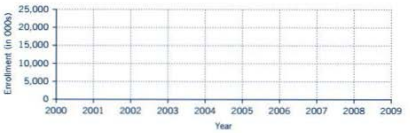
2.DRAW AND LABEL AXES:
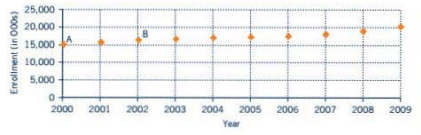
PLOT POINTS:
4.DRAW THE CURVE: